Grundlæggende statistik
| Institutionelle aktier (lange) | 30.326.889 - 72,48% (ex 13D/G) - change of -5,91MM shares -16,30% MRQ |
| Institutionel værdi (lang) | $ 1.426.990 USD ($1000) |
Institutionelt ejerskab og aktionærer
SJW Group (US:SJW) har 284 institutionelle ejere og aktionærer, der har indsendt 13D/G- eller 13F-formularer til Securities Exchange Commission (SEC). Disse institutioner har i alt 30,326,889 aktier. Største aktionærer omfatter BlackRock, Inc., Vanguard Group Inc, Amundi, Cerity Partners LLC, Morgan Stanley, State Street Corp, Nuance Investments, Llc, Geode Capital Management, Llc, Dimensional Fund Advisors Lp, and Invesco Ltd. .
SJW Group (NasdaqGS:SJW) institutionel ejerskabsstruktur viser aktuelle positioner i virksomheden efter institutioner og fonde, samt seneste ændringer i positionsstørrelse. Større aktionærer kan omfatte individuelle investorer, investeringsforeninger, hedgefonde eller institutioner. Skema 13D angiver, at investoren besidder (eller besidder) mere end 5 % af virksomheden og har til hensigt (eller har til hensigt at) aktivt at forfølge en ændring i forretningsstrategi. Skema 13G indikerer en passiv investering på over 5%.
The share price as of May 5, 2025 is 54,86 / share. Previously, on April 28, 2025, the share price was 53,51 / share. This represents an increase of 2,52% over that period.

Fondens stemningsscore
Fund Sentiment Score (fka Ownership Accumulation Score) finder de aktier, der bliver mest købt af fonde. Det er resultatet af en sofistikeret, multi-faktor kvantitativ model, der identificerer virksomheder med de højeste niveauer af institutionel akkumulering. Scoringsmodellen bruger en kombination af den samlede stigning i oplyste ejere, ændringerne i porteføljeallokeringer i disse ejere og andre målinger. Tallet går fra 0 til 100, hvor højere tal indikerer et højere niveau af akkumulering for sine jævnaldrende, og 50 er gennemsnittet.
Opdateringsfrekvens: Dagligt
Se Ownership Explorer, som giver en liste over højest rangerende virksomheder.
AI+ Ask Fintel’s AI assistant about SJW Group.
Select a question to share a public post with an AI-crafted answer.
Thinking of good questions…
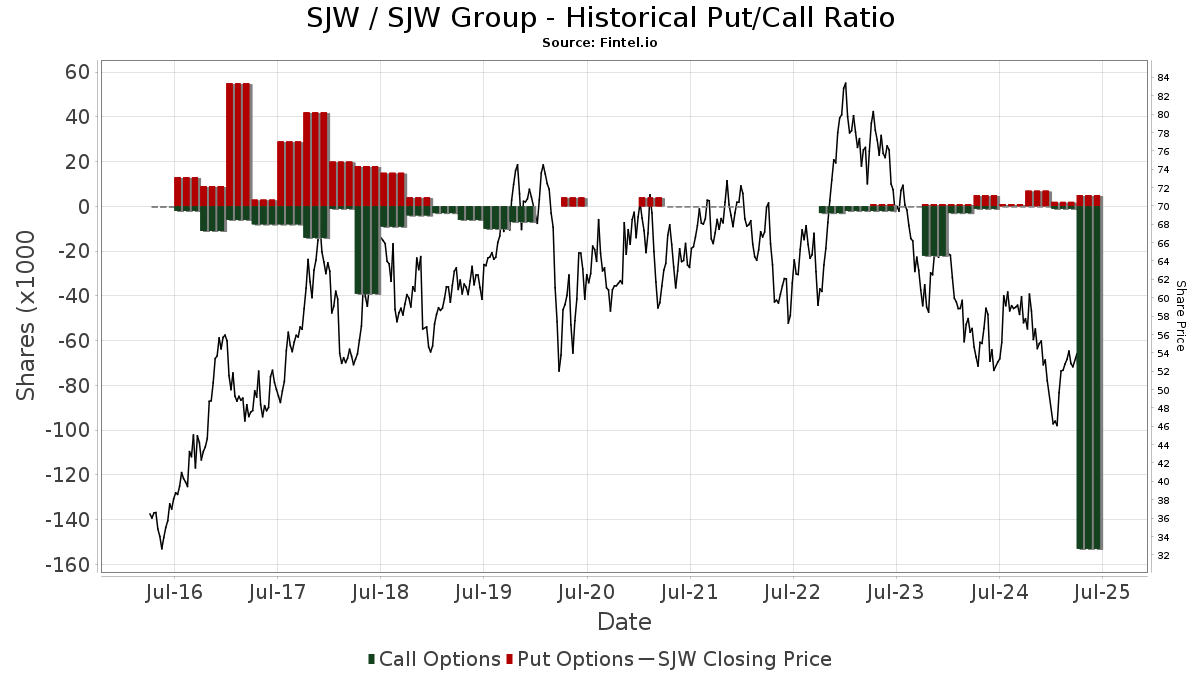
Institutionel Put/Call-forhold
Ud over at indberette standardaktie- og gældsudstedelser skal institutter med mere end 100 mill. aktiver under forvaltning også oplyse deres put- og call-optionsbeholdninger. Da salgsoptioner generelt indikerer negativ stemning, og købsoptioner indikerer positiv stemning, kan vi få en fornemmelse af den overordnede institutionelle stemning ved at plotte forholdet mellem put og kald. Diagrammet til højre viser det historiske put/call-forhold for dette instrument.
Brug af Put/Call Ratio som en indikator for investorernes stemning overvinder en af de vigtigste mangler ved at bruge totalt institutionelt ejerskab, som er, at en betydelig mængde af aktiver under forvaltning investeres passivt for at spore indekser. Passivt forvaltede fonde køber typisk ikke optioner, så indikatoren for put/call-forholdet følger mere nøje følelsen af aktivt forvaltede fonde.
13F og NPORT arkivering
Detaljer om 13F-arkivering er gratis. Detaljer om NP-ansøgninger kræver et premium-medlemskab. Grønne rækker angiver nye positioner. Røde rækker angiver lukkede positioner. Klik på linket ikon for at se den fulde transaktionshistorik.
Opgrader
for at låse premium-data op og eksportere til Excel ![]() .
.
| Fil dato | Kilde | Investor | Type | Gennemsnitlig pris (Øst) |
Aktier | Δ Aktier (%) |
Rapporteret Værdi ($1000) |
Δ Værdi (%) |
Port Alloc (%) |
|
|---|---|---|---|---|---|---|---|---|---|---|
| 2026-04-08 | 13F | Wealth Enhancement Advisory Services, Llc | 10.199 | 17,32 | 604 | 37,05 | ||||
| 2026-02-17 | 13F | Algert Global Llc | 48.251 | 145,04 | 2 | |||||
| 2026-02-17 | 13F | Russell Investments Group, Ltd. | 63.421 | 1.372,85 | 3.107 | 1.386,60 | ||||
| 2026-04-24 | 13F | Boston Trust Walden Corp | 82.722 | 4.853 | ||||||
| 2026-02-11 | 13F | Hughes Financial Services, LLC | 851 | 0,12 | 42 | 5,13 | ||||
| 2026-02-13 | 13F | Public Sector Pension Investment Board | 0 | -100,00 | 0 | |||||
| 2026-02-11 | 13F | Franklin Resources Inc | 40.649 | -59,13 | 1.991 | -58,89 | ||||
| 2026-01-26 | 13F | Cwm, Llc | 8.131 | 1,69 | 0 | |||||
| 2026-02-10 | 13F | Daiwa Securities Group Inc. | 9.831 | -5,07 | 0 | |||||
| 2026-02-12 | 13F | Quadrant Capital Group Llc | 525 | 194,94 | 26 | 212,50 | ||||
| 2026-02-11 | 13F | Illinois Municipal Retirement Fund | 17.012 | 4,55 | 833 | 5,18 | ||||
| 2026-02-06 | 13F | Larson Financial Group LLC | 2.014 | 7.646,15 | 99 | 9.700,00 | ||||
| 2026-02-09 | 13F | Hantz Financial Services, Inc. | 195 | 5,41 | 0 | |||||
| 2026-02-18 | 13F | State of Tennessee, Treasury Department | 20.970 | 65,35 | 1.091 | 76,82 | ||||
| 2026-02-11 | 13F | Los Angeles Capital Management Llc | 9.610 | 0,00 | 443 | -5,34 | ||||
| 2026-02-17 | 13F | Citadel Advisors Llc | Put | 11.200 | 93,10 | 549 | 94,33 | |||
| 2026-02-17 | 13F | State Of Wisconsin Investment Board | 17.327 | -5,48 | 849 | -4,93 | ||||
| 2025-11-04 | 13F | PAX Financial Group, LLC | 0 | -100,00 | 0 | |||||
| 2026-02-12 | 13F | Steward Partners Investment Advisory, Llc | 184 | 0,00 | 9 | 12,50 | ||||
| 2026-02-13 | 13F | Ieq Capital, Llc | 25.455 | 13,35 | 1.247 | 14,09 | ||||
| 2026-04-21 | 13F | Gilpin Wealth Management, Llc | 5 | 66,67 | 0 | |||||
| 2026-02-12 | 13F | Swiss National Bank | 66.200 | 5,08 | 3.243 | 5,70 | ||||
| 2026-02-17 | 13F | Citadel Advisors Llc | Call | 8.900 | 436 | |||||
| 2026-04-13 | 13F | IFP Advisors, Inc | 1.452 | 48,77 | 85 | 80,85 | ||||
| 2026-04-24 | 13F | Root Financial Partners, LLC | 58 | 18,37 | 3 | 50,00 | ||||
| 2026-02-17 | 13F | Citadel Advisors Llc | 66.077 | 70,18 | 3.237 | 71,27 | ||||
| 2025-11-14 | 13F | Sofos Investments, Inc. | 0 | -100,00 | 0 | |||||
| 2026-02-11 | 13F | Ameritas Investment Partners, Inc. | 2.661 | 130 | ||||||
| 2026-02-17 | 13F | Abel Hall, LLC | 10.209 | 500 | ||||||
| 2026-02-05 | 13F | Bessemer Group Inc | 457 | 140,53 | 0 | |||||
| 2026-02-10 | 13F | One Capital Management, LLC | 0 | -100,00 | 0 | |||||
| 2026-02-13 | 13F | Clarity Asset Management, Inc. | 549 | 0,92 | 27 | 0,00 | ||||
| 2026-02-17 | 13F | Raymond James Financial Inc | 30.961 | -22,18 | 1.517 | -21,73 | ||||
| 2026-02-17 | 13F | Public Employees Retirement System Of Ohio | 5.268 | 0,34 | 258 | 1,18 | ||||
| 2026-02-06 | 13F | ProShare Advisors LLC | 134.572 | 1,00 | 6.593 | 1,59 | ||||
| 2026-02-10 | 13F | Commonwealth Of Pennsylvania Public School Empls Retrmt Sys | 62.555 | 3,90 | 3.065 | 4,50 | ||||
| 2026-04-23 | 13F | Farmers & Merchants Investments Inc | 20 | 0,00 | 1 | |||||
| 2026-02-17 | 13F | Aquatic Capital Management LLC | 0 | -100,00 | 0 | |||||
| 2026-02-13 | 13F | Stifel Financial Corp | 18.111 | -2,54 | 887 | -1,88 | ||||
| 2026-02-11 | 13F | Nuance Investments, Llc | 906.724 | -11,27 | 44.420 | -10,74 | ||||
| 2026-02-10 | 13F | Clear Harbor Asset Management, LLC | 28.326 | -2,75 | 1.388 | -2,19 | ||||
| 2026-02-12 | 13F | MetLife Investment Management, LLC | 18.331 | 2,11 | 898 | 2,75 | ||||
| 2025-10-30 | 13F | Twin Peaks Wealth Advisors, LLC | 0 | -100,00 | 0 | |||||
| 2026-04-13 | 13F | Massmutual Trust Co Fsb/adv | 129 | 0,00 | 8 | 16,67 | ||||
| 2026-02-13 | 13F | Macquarie Group Ltd | 18.369 | 0,00 | 900 | 0,56 | ||||
| 2026-02-12 | 13F | Commonwealth Equity Services, Llc | 25.482 | 1.248 | ||||||
| 2026-02-17 | 13F | Engineers Gate Manager LP | 8.232 | -66,33 | 403 | -66,13 | ||||
| 2026-02-11 | 13F | CenterBook Partners LP | 28.976 | 1.420 | ||||||
| 2026-03-09 | 13F | Rubicon Advisors, GP | 14.194 | 695 | ||||||
| 2026-02-13 | 13F | SRS Capital Advisors, Inc. | 91 | -99,12 | 4 | -99,20 | ||||
| 2025-11-14 | 13F | Capstone Investment Advisors, Llc | 4.702 | 229 | ||||||
| 2026-02-12 | 13F | Wealthspire Advisors, LLC | 0 | -100,00 | 0 | |||||
| 2026-04-07 | 13F | Farther Finance Advisors, LLC | 832 | 2,34 | 49 | 23,08 | ||||
| 2026-02-13 | 13F | Great West Life Assurance Co /can/ | 53.869 | -6,47 | 3 | 0,00 | ||||
| 2026-02-17 | 13F | Bank Of America Corp /de/ | 115.719 | 5,44 | 5.669 | 6,08 | ||||
| 2026-04-24 | 13F | Abacus Wealth Partners, LLC | 13.799 | 29,69 | 810 | 55,28 | ||||
| 2026-02-17 | 13F | Creative Planning | 9.734 | 86,58 | 477 | 87,40 | ||||
| 2026-02-17 | 13F | Susquehanna International Group, Llp | 13.894 | 41,79 | 681 | 42,56 | ||||
| 2026-04-22 | 13F | Clear Creek Financial Management, LLC | 0 | -100,00 | 0 | |||||
| 2026-02-13 | 13F | Morgan Stanley | 1.368.180 | 123,02 | 67.027 | 124,36 | ||||
| 2026-02-17 | 13F | California State Teachers Retirement System | 31.036 | 0,23 | 1.520 | 0,86 | ||||
| 2026-04-20 | 13F | Louisiana State Employees Retirement System | 16.600 | 8,50 | 974 | 29,91 | ||||
| 2026-02-11 | 13F | SOUTH STATE Corp | 1.635 | 9,00 | 80 | 9,59 | ||||
| 2026-01-27 | 13F | Zurcher Kantonalbank (Zurich Cantonalbank) | 6.268 | 0,00 | 307 | 0,66 | ||||
| 2026-02-10 | 13F | Meramec Financial Planners, LLC | 107 | 6 | ||||||
| 2026-02-13 | 13F | Victory Capital Management Inc | 468.342 | 6,98 | 22.944 | 7,62 | ||||
| 2026-04-22 | 13F | Sterling Capital Management LLC | 1.105 | -42,54 | 65 | -31,91 | ||||
| 2026-02-12 | 13F | Jane Street Group, Llc | Call | 6.000 | 294 | |||||
| 2026-02-12 | 13F | Elo Mutual Pension Insurance Co | 0 | -100,00 | 0 | |||||
| 2026-02-12 | 13F | Jane Street Group, Llc | 29.026 | -20,48 | 1.422 | -20,03 | ||||
| 2026-02-06 | 13F | Leonteq Securities AG | 168 | 33,33 | 8 | 33,33 | ||||
| 2026-02-05 | 13F | High Note Wealth, LLC | 0 | -100,00 | 0 | |||||
| 2026-02-13 | 13F | Pinnacle Wealth Planning Services, Inc. | 384 | 19 | ||||||
| 2026-02-13 | 13F | Parkside Financial Bank & Trust | 149 | 6,43 | 7 | 16,67 | ||||
| 2026-02-17 | 13F | Voleon Capital Management Lp | 22.194 | -64,81 | 1.087 | -64,60 | ||||
| 2026-02-13 | 13F | American Century Companies Inc | 36.799 | -18,70 | 1.803 | -18,24 | ||||
| 2025-11-13 | 13F | Blueshift Asset Management, LLC | 0 | -100,00 | 0 | |||||
| 2026-02-09 | 13F | Geode Capital Management, Llc | 831.812 | 1,51 | 40.758 | 2,12 | ||||
| 2026-02-13 | 13F | Kestra Advisory Services, LLC | 2.526 | 124 | ||||||
| 2025-11-04 | 13F | UMA Financial Services, Inc. | 0 | -100,00 | 0 | |||||
| 2026-02-10 | 13F | Mutual Of America Capital Management Llc | 112.841 | -4,32 | 5.528 | -3,74 | ||||
| 2026-02-10 | 13F | Ellevest, Inc. | 4.590 | 225 | ||||||
| 2026-02-13 | 13F | Police & Firemen's Retirement System of New Jersey | 8.863 | 0,58 | 434 | 1,17 | ||||
| 2026-02-11 | 13F | LPL Financial LLC | 6.446 | 316 | ||||||
| 2026-02-13 | 13F | Dynamic Technology Lab Private Ltd | 0 | -100,00 | 0 | |||||
| 2026-01-26 | 13F | KBC Group NV | 417.891 | 0,00 | 20 | 0,00 | ||||
| 2026-02-03 | 13F | Ethic Inc. | 21.817 | 41,34 | 1.069 | 42,21 | ||||
| 2026-02-10 | 13F | Goldman Sachs Group Inc | 482.535 | 60,11 | 23.639 | 61,07 | ||||
| 2026-02-20 | 13F | Sunbelt Securities, Inc. | 2 | 0 | ||||||
| 2026-02-12 | 13F | Federation des caisses Desjardins du Quebec | 6.253 | 26,04 | 306 | 26,97 | ||||
| 2026-02-17 | 13F | Fmr Llc | 20.644 | -36,60 | 1.011 | -36,21 | ||||
| 2026-04-16 | 13F | Everstar Asset Management, LLC | 20.365 | 139,59 | 1.195 | 187,02 | ||||
| 2026-01-26 | 13F | Private Trust Co Na | 858 | 0,00 | 42 | 2,44 | ||||
| 2026-02-18 | 13F | First Citizens Bank & Trust Co | 6.209 | 304 | ||||||
| 2026-02-06 | 13F | EverSource Wealth Advisors, LLC | 517 | -37,18 | 25 | -37,50 | ||||
| 2026-02-11 | 13F | Simplex Trading, Llc | 65 | -77,82 | 3 | |||||
| 2026-02-11 | 13F | Simplex Trading, Llc | Call | 800 | 166,67 | 39 | ||||
| 2025-11-04 | 13F | Cornerstone Planning Group LLC | 0 | -100,00 | 0 | |||||
| 2026-02-02 | 13F | Principal Financial Group Inc | 158.701 | 0,19 | 7.775 | 0,79 | ||||
| 2026-02-11 | 13F | Simplex Trading, Llc | Put | 800 | -27,27 | 39 | ||||
| 2026-04-21 | 13F | Financial Consulate, Inc | 11 | 0,00 | 1 | |||||
| 2026-02-04 | 13F | Liberty Wealth Management Llc | 8.618 | 0,00 | 422 | 0,72 | ||||
| 2026-02-09 | 13F | Quest Partners LLC | 5.354 | -85,45 | 262 | -85,37 | ||||
| 2026-02-06 | 13F | Covestor Ltd | 45 | -4,26 | 0 | |||||
| 2026-01-29 | 13F | Teachers Retirement System Of The State Of Kentucky | 8.041 | -7,13 | 0 | |||||
| 2026-02-11 | 13F | Jpmorgan Chase & Co | 45.716 | -78,91 | 2.240 | -78,79 | ||||
| 2026-02-05 | 13F | HFM Investment Advisors, LLC | 2 | 0,00 | 0 | |||||
| 2026-02-17 | 13F | Brevan Howard Capital Management LP | 11.235 | -7,49 | 550 | -6,94 | ||||
| 2026-02-10 | 13F | BW Gestao de Investimentos Ltda. | 81.202 | 3.978 | ||||||
| 2026-02-10 | 13F | Lido Advisors, LLC | 8.115 | 0,00 | 398 | 0,51 | ||||
| 2026-02-17 | 13F | Cetera Investment Advisers | 5.386 | 15,06 | 264 | 15,86 | ||||
| 2026-02-12 | 13F | Dimensional Fund Advisors Lp | 658.935 | 1,11 | 32.282 | 1,72 | ||||
| 2026-02-04 | 13F | Swiss Life Asset Management Ltd | 52.561 | 0,21 | 2.575 | 0,78 | ||||
| 2026-02-13 | 13F | Smartleaf Asset Management LLC | 97 | 90,20 | 5 | 100,00 | ||||
| 2026-02-10 | 13F | Bank of New York Mellon Corp | 183.106 | -40,71 | 8.970 | -40,36 | ||||
| 2025-11-14 | 13F | Two Sigma Advisers, Lp | 0 | -100,00 | 0 | -100,00 | ||||
| 2025-11-03 | 13F | Annis Gardner Whiting Capital Advisors, LLC | 0 | -100,00 | 0 | |||||
| 2026-04-20 | 13F | Jfs Wealth Advisors, Llc | 18 | -10,00 | 1 | |||||
| 2026-04-24 | 13F | Keybank National Association/oh | 3.999 | 235 | ||||||
| 2026-02-13 | 13F | Van Eck Associates Corp | 12.766 | 11,42 | 1 | |||||
| 2026-02-09 | 13F | Hartland & Co., LLC | 3 | -98,85 | 0 | -100,00 | ||||
| 2026-02-12 | 13F | Ankerstar Wealth, LLC | 12 | 1 | ||||||
| 2026-02-24 | 13F | Bell Investment Advisors, Inc | 0 | -100,00 | 0 | |||||
| 2026-02-13 | 13F | Jacobs Levy Equity Management, Inc | 21.729 | -2,15 | 1.065 | -1,57 | ||||
| 2026-02-11 | 13F | Cerity Partners LLC | 1.445.802 | -0,18 | 70.830 | 0,42 | ||||
| 2026-02-13 | 13F | Vontobel Holding Ltd. | 19.446 | 0,22 | 953 | 0,85 | ||||
| 2026-02-13 | 13F | Martingale Asset Management L P | 20.011 | 147,42 | 980 | 149,36 | ||||
| 2026-04-20 | 13F | Assenagon Asset Management S.A. | 0 | -100,00 | 0 | |||||
| 2026-02-17 | 13F | Alliancebernstein L.p. | 39.701 | 16,44 | 1.945 | 17,11 | ||||
| 2026-02-17 | 13F | Schonfeld Strategic Advisors LLC | 0 | -100,00 | 0 | |||||
| 2026-02-13 | 13F | Wells Fargo & Company/mn | 96.903 | 69,34 | 4.747 | 70,39 | ||||
| 2025-10-28 | 13F | First National Corp /ma/ /adv | 36.238 | -1,83 | 1.714 | -10,69 | ||||
| 2026-04-06 | 13F | GAMMA Investing LLC | 3.420 | 38,80 | 201 | 66,67 | ||||
| 2026-04-22 | 13F | Pictet Asset Management Holding SA | 7.654 | 15,31 | 449 | 38,15 | ||||
| 2026-04-24 | 13F | Medallion Wealth Advisors, LLC | 660 | 0,00 | 39 | 18,75 | ||||
| 2026-02-13 | 13F | BNP Paribas Asset Management Holding S.A. | 17.175 | 1 | ||||||
| 2026-02-17 | 13F | Ameriprise Financial Inc | 101.216 | -6,40 | 4.959 | -5,85 | ||||
| 2026-02-13 | 13F | State Street Corp | 1.359.773 | 4,60 | 66.615 | 5,22 | ||||
| 2025-11-14 | 13F | Thematics Asset Management | 132.246 | 24,47 | 6.440 | 16,65 | ||||
| 2026-04-16 | 13F | E. Ohman J:or Asset Management AB | 51.187 | 8,84 | 3.014 | 30,70 | ||||
| 2026-01-27 | 13F | Meritage Portfolio Management | 0 | -100,00 | 0 | |||||
| 2026-01-12 | 13F | Canvas Wealth Advisors, LLC | 10.729 | 6,14 | 526 | 10,29 | ||||
| 2026-02-12 | 13F | CoreCommodity Management, LLC | 16.958 | -15,31 | 831 | -14,87 | ||||
| 2026-02-11 | 13F | Rise Advisors, LLC | 0 | -100,00 | 0 | |||||
| 2026-02-17 | 13F | Advisor Group Holdings, Inc. | 976 | -7,58 | 48 | -9,62 | ||||
| 2026-02-17 | 13F | Jump Financial, LLC | 9.387 | -76,00 | 460 | -75,89 | ||||
| 2026-02-19 | 13F | Invesco Ltd. | 646.559 | 13,46 | 31.675 | 14,13 | ||||
| 2026-02-10 | 13F | Bnp Paribas Arbitrage, Sa | 24.306 | -72,60 | 1.191 | -72,45 | ||||
| 2026-02-10 | 13F | Quantbot Technologies LP | 0 | -100,00 | 0 | |||||
| 2026-02-13 | 13F | Transamerica Financial Advisors, Inc. | 7 | 0 | ||||||
| 2026-02-09 | 13F | New Age Alpha Advisors, LLC | 61.651 | 0,39 | 3.020 | 1,00 | ||||
| 2025-11-04 | 13F | Gitterman Wealth Management, LLC | 9.441 | 194,48 | 460 | 176,51 | ||||
| 2026-02-09 | 13F/A | Fideuram - Intesa Sanpaolo Private Banking S.p.a. | 32.849 | 1.609 | ||||||
| 2026-02-06 | 13F | Envestnet Portfolio Solutions, Inc. | 5.093 | 250 | ||||||
| 2026-02-13 | 13F | Prudential Financial Inc | 31.163 | -6,32 | 1.527 | -5,80 | ||||
| 2026-01-28 | 13F | Universal- Beteiligungs- und Servicegesellschaft mbH | 6.950 | 17,40 | 340 | 18,06 | ||||
| 2026-02-09 | 13F | Huntington National Bank | 1 | -94,74 | 0 | |||||
| 2026-02-12 | 13F | Davy Global Fund Management Ltd | 20.987 | 4,73 | 1.028 | 5,44 | ||||
| 2026-02-17 | 13F | Zimmer Partners, LP | 43.816 | -64,75 | 2.147 | -64,55 | ||||
| 2026-02-12 | 13F | Cloud Capital Management, LLC | 0 | -100,00 | 0 | |||||
| 2026-02-09 | 13F | Keating Financial Advisory Services, Inc. | 7 | 0 | ||||||
| 2026-02-13 | 13F | Cohen & Steers, Inc. | 544.544 | 27 | ||||||
| 2026-02-13 | 13F | Manufacturers Life Insurance Company, The | 0 | -100,00 | 0 | |||||
| 2026-02-11 | 13F | Syon Capital Llc | 4.129 | 202 | ||||||
| 2026-01-15 | 13F | Allspring Global Investments Holdings, LLC | 7.755 | 9,94 | 382 | 14,41 | ||||
| 2026-02-17 | 13F | Ameriflex Group, Inc. | 69 | -50,00 | 3 | -50,00 | ||||
| 2026-02-17 | 13F | Jones Financial Companies Lllp | 238 | 0,00 | 12 | 0,00 | ||||
| 2026-02-12 | 13F | Voya Investment Management Llc | 21.361 | 1,48 | 1.046 | 2,05 | ||||
| 2026-02-13 | 13F | Verition Fund Management LLC | 0 | -100,00 | 0 | |||||
| 2026-02-13 | 13F | Umb Bank N A/mo | 78 | -40,00 | 4 | -50,00 | ||||
| 2026-02-13 | 13F | Public Employees Retirement Association Of Colorado | 2.872 | 0,00 | 0 | |||||
| 2026-02-12 | 13F | Campbell & CO Investment Adviser LLC | 0 | -100,00 | 0 | |||||
| 2026-02-12 | 13F | Renaissance Technologies Llc | 84.000 | -27,77 | 4.115 | -27,34 | ||||
| 2026-02-17 | 13F | D. E. Shaw & Co., Inc. | 0 | -100,00 | 0 | |||||
| 2026-03-31 | 13F | Sankala Group LLC | 27 | 0,00 | 2 | 0,00 | ||||
| 2026-01-28 | 13F | Teacher Retirement System Of Texas | 0 | -100,00 | 0 | |||||
| 2026-01-29 | 13F | Vanguard Group Inc | 2.731.868 | 2,93 | 133.834 | 3,54 | ||||
| 2026-01-28 | 13F | Arizona State Retirement System | 9.401 | -2,14 | 461 | -1,50 | ||||
| 2026-02-09 | 13F | Atlantic Trust, LLC | 0 | -100,00 | 0 | |||||
| 2026-02-11 | 13F | Manchester Capital Management LLC | 16 | 1 | ||||||
| 2026-04-14 | 13F | Clean Yield Group | 46.418 | 8,69 | 2.723 | 30,16 | ||||
| 2026-02-02 | 13F | Danske Bank A/s | 100 | 0,00 | 5 | 0,00 | ||||
| 2026-01-30 | 13F | Jennison Associates Llc | 17.235 | 844 | ||||||
| 2026-04-10 | 13F | Abound Wealth Management | 3 | 0,00 | 0 | |||||
| 2026-01-21 | 13F | Sound Income Strategies, LLC | 23 | 1 | ||||||
| 2026-02-13 | 13F | First Trust Advisors Lp | 502.393 | -61,81 | 24.612 | -61,58 | ||||
| 2026-02-17 | 13F | ATLAS Infrastructure Partners (UK) Ltd. | 584.080 | 28.614 | ||||||
| 2026-01-28 | 13F | Salomon & Ludwin, LLC | 200 | -34,85 | 10 | -35,71 | ||||
| 2026-02-17 | 13F | Millennium Management Llc | 4.792 | -96,43 | 235 | -96,42 | ||||
| 2026-04-03 | 13F | Ridgewood Investments LLC | 10.323 | 49,37 | 606 | 80,06 | ||||
| 2026-02-12 | 13F | CIBC Private Wealth Group, LLC | 183.639 | 0,00 | 8.996 | 0,60 | ||||
| 2026-02-13 | 13F | Schroder Investment Management Group | 166.238 | 9,62 | 8.189 | 12,49 | ||||
| 2026-02-05 | 13F | Atria Investments Llc | 16.980 | -12,51 | 832 | -12,06 | ||||
| 2026-02-17 | 13F | Northern Trust Corp | 342.958 | -3,79 | 16.802 | -3,21 | ||||
| 2026-02-17 | 13F | Adage Capital Partners Gp, L.l.c. | 0 | -100,00 | 0 | |||||
| 2026-02-17 | 13F | Gallagher Fiduciary Advisors, LLC | 8.252 | 14,74 | 404 | 15,43 | ||||
| 2026-02-02 | 13F | Fifth Third Bancorp | 250 | 400,00 | 12 | 500,00 | ||||
| 2026-04-23 | 13F | TFC Financial Management | 4 | 0,00 | 0 | |||||
| 2026-01-30 | 13F | SOL Capital Management CO | 0 | -100,00 | 0 | |||||
| 2026-02-17 | 13F | Aqr Capital Management Llc | 154.671 | 14,21 | 7.577 | 14,89 | ||||
| 2026-04-08 | 13F | DiNuzzo Private Wealth, Inc. | 6 | 0,00 | 0 | |||||
| 2026-02-13 | 13F | MAI Capital Management | 31 | 210,00 | 2 | |||||
| 2026-02-17 | 13F | Freestone Grove Partners LP | 0 | -100,00 | 0 | |||||
| 2026-01-30 | 13F | Us Bancorp \de\ | 928 | -27,61 | 45 | -27,42 | ||||
| 2026-02-11 | 13F | Parallel Advisors, LLC | 594 | 1.020,75 | 29 | 1.350,00 | ||||
| 2026-04-23 | 13F | CWM Advisors, LLC | 3.619 | -14,18 | 212 | 2,91 | ||||
| 2026-02-10 | 13F | Rothschild Investment Llc | 38 | -20,83 | 2 | -50,00 | ||||
| 2026-02-17 | 13F | XTX Topco Ltd | 11.547 | 155,92 | 566 | 157,99 | ||||
| 2026-04-10 | 13F | Perigon Wealth Management, LLC | 7.789 | 0,59 | 457 | 20,32 | ||||
| 2026-02-13 | 13F | Aigen Investment Management, Lp | 4.900 | 1,28 | 240 | 2,13 | ||||
| 2026-02-05 | 13F | Allworth Financial LP | 411 | -87,22 | 20 | -87,18 | ||||
| 2026-02-10 | 13F | Connor, Clark & Lunn Investment Management Ltd. | 23.708 | 1.161 | ||||||
| 2026-02-13 | 13F | Vega Investment Solutions | 236 | 0,00 | 12 | -8,33 | ||||
| 2026-02-12 | 13F | Federated Hermes, Inc. | 34.254 | 41,91 | 1.678 | 42,81 | ||||
| 2026-04-23 | 13F | SJS Investment Consulting Inc. | 7 | 133,33 | 0 | |||||
| 2026-01-20 | 13F | Harbor Capital Advisors, Inc. | 182 | -1,62 | 0 | |||||
| 2026-02-13 | 13F | Y-Intercept (Hong Kong) Ltd | 0 | -100,00 | 0 | |||||
| 2026-02-03 | 13F | Costello Asset Management, INC | 258 | 0,00 | 13 | 0,00 | ||||
| 2026-04-24 | 13F | Yousif Capital Management, Llc | 9.971 | 11,81 | 585 | 24,52 | ||||
| 2026-02-17 | 13F | Advisory Services Network, LLC | 0 | -100,00 | 0 | |||||
| 2026-01-29 | 13F | D.a. Davidson & Co. | 8.321 | 5,22 | 408 | 5,71 | ||||
| 2026-02-18 | 13F | EP Wealth Advisors, Inc. | 6.899 | -9,35 | 338 | -14,68 | ||||
| 2026-02-12 | 13F | Johnson Financial Group, Inc. | 0 | -100,00 | 0 | |||||
| 2026-02-13 | 13F | Entropy Technologies, LP | 0 | -100,00 | 0 | |||||
| 2026-04-24 | 13F | IFM Investors Pty Ltd | 2.389 | -44,98 | 140 | -44,44 | ||||
| 2026-04-07 | 13F | Signaturefd, Llc | 87 | 50,00 | 5 | 150,00 | ||||
| 2026-04-16 | 13F | SG Americas Securities, LLC | 30.689 | 9,35 | 2 | 0,00 | ||||
| 2026-01-28 | 13F | Klp Kapitalforvaltning As | 14.200 | 27,93 | 696 | 28,70 | ||||
| 2026-02-11 | 13F | Deutsche Bank Ag\ | 55.677 | 2,96 | 2.728 | 3,57 | ||||
| 2026-02-17 | 13F | Quantinno Capital Management LP | 20.402 | 75,82 | 1.000 | 76,81 | ||||
| 2026-02-17 | 13F | Atom Investors LP | 23.425 | -61,05 | 1.148 | -60,84 | ||||
| 2026-02-12 | 13F | Skandinaviska Enskilda Banken AB (publ) | 8.941 | -4,43 | 438 | -3,74 | ||||
| 2026-02-13 | 13F | Kempen Capital Management N.v. | 72.314 | 1,83 | 3.543 | 2,43 | ||||
| 2026-04-17 | 13F | AdvisorNet Financial, Inc | 285 | 0,00 | 17 | 23,08 | ||||
| 2026-02-04 | 13F | Versor Investments LP | 0 | -100,00 | 0 | |||||
| 2026-02-17 | 13F | MIRAE ASSET GLOBAL ETFS HOLDINGS Ltd. | 23.877 | 6,36 | 1.170 | 6,95 | ||||
| 2026-02-17 | 13F | Quadrature Capital Ltd | 0 | -100,00 | 0 | -100,00 | ||||
| 2026-02-06 | 13F | Global Retirement Partners, LLC | 1.687 | 0,00 | 83 | 0,00 | ||||
| 2026-04-20 | 13F | Chatham Capital Group, Inc. | 24.864 | -8,20 | 1.459 | 9,95 | ||||
| 2026-02-03 | 13F | International Assets Investment Management, Llc | 56 | 3 | ||||||
| 2025-11-06 | 13F | Ameritas Advisory Services, LLC | 0 | -100,00 | 0 | |||||
| 2026-02-17 | 13F | ISAM Funds (UK) Ltd | 0 | -100,00 | 0 | |||||
| 2026-02-11 | 13F | Meeder Asset Management Inc | 2.101 | 458,78 | 103 | 466,67 | ||||
| 2026-04-15 | 13F | Fortitude Family Office, LLC | 40 | 700,00 | 2 | |||||
| 2026-02-13 | 13F | Rhumbline Advisers | 101.201 | -5,01 | 4.958 | -4,45 | ||||
| 2025-11-13 | 13F | Duff & Phelps Investment Management Co | 0 | -100,00 | 0 | -100,00 | ||||
| 2026-02-12 | 13F | Nuveen, LLC | 182.787 | -25,05 | 8.955 | -24,60 | ||||
| 2026-02-13 | 13F | Estabrook Capital Management | 0 | -100,00 | 0 | |||||
| 2026-02-13 | 13F | Mariner, LLC | 46.865 | 1,89 | 2.296 | 2,55 | ||||
| 2026-04-08 | 13F | Ausbil Investment Management Ltd | 244.282 | 359,88 | 14.276 | 448,62 | ||||
| 2026-01-15 | 13F | Nisa Investment Advisors, Llc | 602 | -15,69 | 29 | -14,71 | ||||
| 2026-02-11 | 13F | Brandywine Global Investment Management, LLC | 81.927 | 354,92 | 4.014 | 357,58 | ||||
| 2026-02-17 | 13F | Janus Henderson Group Plc | 14.947 | 0,00 | 732 | 0,55 | ||||
| 2026-04-06 | 13F | Versant Capital Management, Inc | 803 | 0,00 | 47 | 20,51 | ||||
| 2026-02-13 | 13F | Cullen Capital Management, LLC | 7.342 | -37,73 | 360 | -37,46 | ||||
| 2026-02-17 | 13F | Mercer Global Advisors Inc /adv | 6.951 | 66,53 | 293 | 43,84 | ||||
| 2026-02-12 | 13F | Loudon Investment Management, LLC | 5.450 | 267 | ||||||
| 2026-02-17 | 13F | Two Sigma Investments, Lp | 196.911 | 35,45 | 9.647 | 36,26 | ||||
| 2026-01-30 | 13F | Torren Management, LLC | 1 | 0 | ||||||
| 2026-02-13 | 13F | Citigroup Inc | 10.518 | -14,25 | 515 | -13,74 | ||||
| 2026-02-12 | 13F | New York State Common Retirement Fund | 11.369 | 0,00 | 557 | 0,54 | ||||
| 2026-02-13 | 13F | Capula Management Ltd | 53.476 | 30,00 | 2.620 | 30,75 | ||||
| 2026-02-17 | 13F | First Manhattan Co | 0 | -100,00 | 0 | |||||
| 2026-02-17 | 13F | Price T Rowe Associates Inc /md/ | 34.484 | 10,81 | 2 | 0,00 | ||||
| 2026-02-12 | 13F | Skopos Labs, Inc. | 17.672 | 864 | ||||||
| 2026-02-06 | 13F | HighTower Advisors, LLC | 6.485 | -7,54 | 318 | -7,04 | ||||
| 2026-02-17 | 13F | Yaupon Capital Management LP | 99.884 | 4.893 | ||||||
| 2026-01-16 | 13F | Vista Investment Partners Llc | 0 | -100,00 | 0 | |||||
| 2026-01-05 | 13F | Confluence Investment Management Llc | 0 | -100,00 | 0 | -100,00 | ||||
| 2026-04-14 | 13F | Bay Harbor Wealth Management, LLC | 2 | 100,00 | 0 | |||||
| 2026-02-17 | 13F | Man Group plc | 50.251 | 103,07 | 2.462 | 104,23 | ||||
| 2026-01-29 | 13F | UBS Group AG | 112.387 | -11,31 | 5.506 | -10,79 | ||||
| 2026-04-21 | 13F | Robeco Institutional Asset Management B.V. | 20.133 | 1.181 | ||||||
| 2026-02-13 | 13F | Inspire Advisors, LLC | 11.805 | -38,27 | 578 | -37,92 | ||||
| 2026-02-14 | 13F | Rockefeller Capital Management L.P. | 608 | -15,44 | 30 | -17,14 | ||||
| 2025-11-14 | 13F | Texas Permanent School Fund | 0 | -100,00 | 0 | |||||
| 2026-02-13 | 13F | Squarepoint Ops LLC | 0 | -100,00 | 0 | |||||
| 2026-02-09 | 13F | Legal & General Group Plc | 568.822 | 1,39 | 27.878 | 2,07 | ||||
| 2026-02-18 | 13F | Mackenzie Financial Corp | 10.221 | 502 | ||||||
| 2026-02-06 | 13F | Bare Financial Services, Inc | 20 | -82,91 | 1 | -100,00 | ||||
| 2026-02-17 | 13F | Private Advisor Group, LLC | 7.310 | -48,67 | 358 | -48,34 | ||||
| 2026-02-05 | 13F | ANTIPODES PARTNERS Ltd | 383.905 | 18.809 | ||||||
| 2026-02-05 | 13F | Thrivent Financial For Lutherans | 22.881 | -3,35 | 1 | 0,00 | ||||
| 2026-04-15 | 13F | Exchange Traded Concepts, Llc | 41.909 | -7,07 | 2.459 | 11,27 | ||||
| 2026-02-12 | 13F | Cibc World Markets Corp | 0 | -100,00 | 0 | |||||
| 2026-02-06 | 13F | FourThought Financial Partners, LLC | 6.769 | 332 | ||||||
| 2026-04-13 | 13F | Creative Financial Designs Inc /adv | 3 | -66,67 | 0 | |||||
| 2026-02-17 | 13F | Hotchkis & Wiley Capital Management Llc | 254.823 | 0,63 | 12.484 | 1,22 | ||||
| 2026-02-05 | 13F | Gabelli Funds Llc | 147.655 | 0,14 | 7.234 | 0,72 | ||||
| 2026-04-23 | 13F | ELCO Management Co., LLC | 4.472 | -20,04 | 262 | -4,38 | ||||
| 2026-02-03 | 13F | SBI Securities Co., Ltd. | 84 | -34,38 | 4 | -33,33 | ||||
| 2026-02-17 | 13F | Balyasny Asset Management Llc | 18.911 | 926 | ||||||
| 2025-11-12 | 13F | CIBC Bancorp USA Inc. | 187.026 | 9.108 | ||||||
| 2026-01-16 | 13F | Trust Co Of Vermont | 61 | 0,00 | 3 | 0,00 | ||||
| 2026-02-13 | 13F | Barclays Plc | 70.565 | 12,54 | 3.457 | 13,20 | ||||
| 2026-03-20 | 13F/A | Hsbc Holdings Plc | 0 | -100,00 | 0 | -100,00 | ||||
| 2026-02-13 | 13F | Quarry LP | 52 | -63,89 | 3 | -71,43 | ||||
| 2026-02-12 | 13F | BlackRock, Inc. | 6.655.180 | 6,62 | 326.037 | 7,25 | ||||
| 2026-02-03 | 13F | Mitsubishi UFJ Kokusai Asset Management Co., Ltd. | 352 | 0,00 | 17 | 0,00 | ||||
| 2026-02-17 | 13F | Guggenheim Capital Llc | 19.413 | 19,75 | 951 | 20,53 | ||||
| 2025-11-14 | 13F | Cubist Systematic Strategies, LLC | 0 | -100,00 | 0 | -100,00 | ||||
| 2026-02-13 | 13F | Ubs Asset Management Americas Inc | 136.876 | 4,58 | 6.706 | 5,19 | ||||
| 2026-02-04 | 13F | Oregon Public Employees Retirement Fund | 7.610 | 2,70 | 373 | 3,33 | ||||
| 2026-02-12 | 13F | State Board Of Administration Of Florida Retirement System | 8.211 | 0,00 | 402 | 0,75 | ||||
| 2026-02-17 | 13F | Voloridge Investment Management, Llc | 76.822 | -18,71 | 3.764 | -18,23 | ||||
| 2026-02-05 | 13F | Amalgamated Bank | 9.668 | 0,37 | 0 | |||||
| 2026-01-30 | 13F | New York State Teachers Retirement System | 21.107 | 10,95 | 1 | |||||
| 2026-02-13 | 13F | Arete Wealth Advisors, LLC | 5.700 | 0,00 | 0 | |||||
| 2026-02-05 | 13F | Gamco Investors, Inc. Et Al | 61.630 | 0,00 | 3.019 | 0,60 | ||||
| 2026-02-17 | 13F | Maryland State Retirement & Pension System | 35.765 | 1,78 | 1.752 | 2,40 | ||||
| 2026-02-12 | 13F | Ensign Peak Advisors, Inc | 2.758 | -64,90 | 135 | -64,66 | ||||
| 2026-02-13 | 13F | Rodgers Brothers Inc. | 23.250 | -51,31 | 1.139 | -51,01 | ||||
| 2026-01-12 | 13F | Rialto Wealth Management, LLC | 0 | -100,00 | 0 | |||||
| 2026-04-14 | 13F | Prospera Financial Services Inc | 90.012 | 2,43 | 5.281 | 22,67 | ||||
| 2026-02-12 | 13F | EntryPoint Capital, LLC | 8.021 | 0,00 | 393 | 0,51 | ||||
| 2026-02-12 | 13F | Principal Securities, Inc. | 0 | -100,00 | 0 | |||||
| 2026-02-17 | 13F | Royal Bank Of Canada | 4.985 | -1,66 | 245 | -0,81 | ||||
| 2025-11-14 | 13F | Susquehanna Fundamental Investments, Llc | 0 | -100,00 | 0 | |||||
| 2026-02-13 | 13F | Sei Investments Co | 73.597 | 165,65 | 3.606 | 167,23 | ||||
| 2026-02-17 | 13F | Tower Research Capital LLC (TRC) | 1.978 | 102,46 | 97 | 104,26 | ||||
| 2026-02-06 | 13F | VSM Wealth Advisory, LLC | 97 | 5 | ||||||
| 2026-02-13 | 13F | Walleye Capital LLC | 0 | -100,00 | 0 | |||||
| 2026-02-06 | 13F | Pnc Financial Services Group, Inc. | 3.413 | 12,38 | 167 | 13,61 | ||||
| 2026-02-17 | 13F | Canada Pension Plan Investment Board | 10.200 | 500 | ||||||
| 2026-02-12 | 13F | Bank Of Montreal /can/ | 11.536 | -11,64 | 565 | -11,02 | ||||
| 2025-11-14 | 13F | Point72 (DIFC) Ltd | 0 | -100,00 | 0 | -100,00 | ||||
| 2026-02-06 | 13F | Handelsbanken Fonder AB | 9.965 | -5,51 | 0 | |||||
| 2026-04-13 | 13F | True Wealth Design, LLC | 17 | 0,00 | 1 | |||||
| 2026-04-17 | 13F | Vermillion Wealth Management, Inc. | 2 | 0 | ||||||
| 2026-02-13 | 13F | Marshall Wace, Llp | 0 | -100,00 | 0 | -100,00 | ||||
| 2026-01-29 | 13F | Comerica Bank | 8.867 | -16,65 | 434 | -16,22 | ||||
| 2026-02-03 | 13F | Ballentine Partners, LLC | 0 | -100,00 | 0 | |||||
| 2026-02-13 | 13F | Caitong International Asset Management Co., Ltd | 0 | -100,00 | 0 | |||||
| 2025-11-14 | 13F | Prosperity Consulting Group, LLC | 0 | -100,00 | 0 | |||||
| 2026-02-13 | 13F | Charles Schwab Investment Management Inc | 433.757 | 3,27 | 21.250 | 3,88 | ||||
| 2025-11-14 | 13F | ExodusPoint Capital Management, LP | 13.063 | 636 | ||||||
| 2025-11-14 | 13F | Vennlight Capital Management, LP | 0 | -100,00 | 0 | -100,00 | ||||
| 2026-02-17 | 13F | Susquehanna Portfolio Strategies, LLC | 66.198 | 3.243 | ||||||
| 2026-02-10 | 13F | Intech Investment Management Llc | 14.115 | 0,00 | 691 | 0,58 | ||||
| 2026-02-17 | 13F | Resolution Capital Ltd | 234.455 | 11.486 | ||||||
| 2025-11-13 | 13F | Norges Bank | 0 | -100,00 | 0 | -100,00 | ||||
| 2026-02-11 | 13F | Group One Trading, L.p. | Call | 200 | 100,00 | 10 | 125,00 | |||
| 2026-02-10 | 13F | State of Wyoming | 8.646 | 424 | ||||||
| 2026-02-11 | 13F | Group One Trading, L.p. | Put | 100 | 5 | |||||
| 2026-02-12 | 13F | Hrt Financial Lp | 30.153 | 8,15 | 1 | 0,00 | ||||
| 2026-02-17 | 13F | Amundi | 1.712.886 | -21,60 | 83.937 | -20,79 | ||||
| 2026-04-20 | 13F | State of Alaska, Department of Revenue | 19.476 | 8,27 | 1 | |||||
| 2026-02-09 | 13F | Jackson Creek Investment Advisors LLC | 37.863 | 2 | ||||||
| 2026-01-30 | 13F | R Squared Ltd | 0 | -100,00 | 0 | |||||
| 2026-02-12 | 13F | Keynote Financial Services Llc | 56.218 | 9,34 | 2.754 | 10,03 | ||||
| 2026-04-23 | 13F | North Star Investment Management Corp. | 44.800 | 0,00 | 2.628 | 19,78 | ||||
| 2026-02-10 | 13F | Magellan Asset Management Ltd | 21.849 | 1,32 | 1.070 | 1,90 |
Other Listings
| US:HTO | 59,72 $ |