Grundlæggende statistik
| Institutionelle ejere | 128 total, 125 long only, 0 short only, 3 long/short - change of -7,91% MRQ |
| Gennemsnitlig porteføljeallokering | 0.5177 % - change of -25,94% MRQ |
| Institutionelle aktier (lange) | 6.078.081 (ex 13D/G) - change of -3,36MM shares -35,60% MRQ |
| Institutionel værdi (lang) | $ 227.897 USD ($1000) |
Institutionelt ejerskab og aktionærer
ProShares Trust - ProShares Short S&P500 (US:SH) har 128 institutionelle ejere og aktionærer, der har indsendt 13D/G- eller 13F-formularer til Securities Exchange Commission (SEC). Disse institutioner har i alt 6,078,081 aktier. Største aktionærer omfatter Morgan Stanley, UBS Group AG, Citadel Advisors Llc, Rothschild Capital Partners, LLC, Colony Group, LLC, Susquehanna International Group, Llp, Susquehanna International Group, Llp, First National Corp /ma/ /adv, Axxcess Wealth Management, Llc, and Arete Wealth Advisors, LLC .
ProShares Trust - ProShares Short S&P500 (ARCA:SH) institutionel ejerskabsstruktur viser aktuelle positioner i virksomheden efter institutioner og fonde, samt seneste ændringer i positionsstørrelse. Større aktionærer kan omfatte individuelle investorer, investeringsforeninger, hedgefonde eller institutioner. Skema 13D angiver, at investoren besidder (eller besidder) mere end 5 % af virksomheden og har til hensigt (eller har til hensigt at) aktivt at forfølge en ændring i forretningsstrategi. Skema 13G indikerer en passiv investering på over 5%.
The share price as of September 15, 2025 is 37,66 / share. Previously, on September 16, 2024, the share price was 44,80 / share. This represents a decline of 15,94% over that period.

Fondens stemningsscore
Fund Sentiment Score (fka Ownership Accumulation Score) finder de aktier, der bliver mest købt af fonde. Det er resultatet af en sofistikeret, multi-faktor kvantitativ model, der identificerer virksomheder med de højeste niveauer af institutionel akkumulering. Scoringsmodellen bruger en kombination af den samlede stigning i oplyste ejere, ændringerne i porteføljeallokeringer i disse ejere og andre målinger. Tallet går fra 0 til 100, hvor højere tal indikerer et højere niveau af akkumulering for sine jævnaldrende, og 50 er gennemsnittet.
Opdateringsfrekvens: Dagligt
Se Ownership Explorer, som giver en liste over højest rangerende virksomheder.
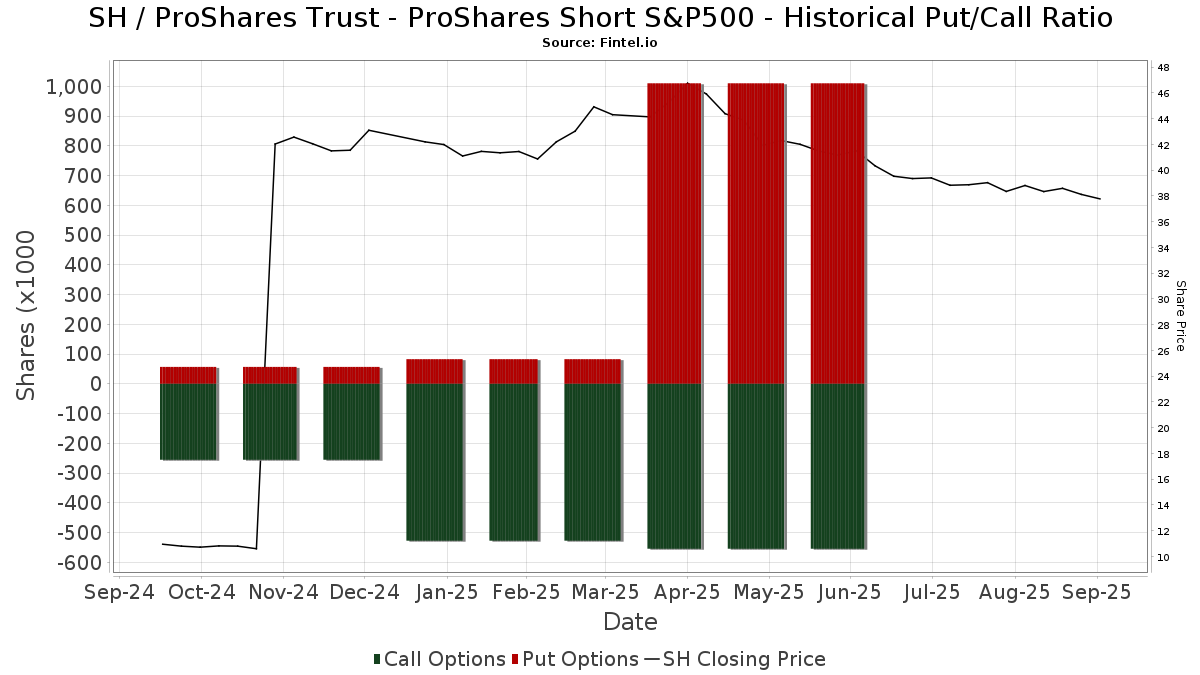
Institutionel Put/Call-forhold
Ud over at indberette standardaktie- og gældsudstedelser skal institutter med mere end 100 mill. aktiver under forvaltning også oplyse deres put- og call-optionsbeholdninger. Da salgsoptioner generelt indikerer negativ stemning, og købsoptioner indikerer positiv stemning, kan vi få en fornemmelse af den overordnede institutionelle stemning ved at plotte forholdet mellem put og kald. Diagrammet til højre viser det historiske put/call-forhold for dette instrument.
Brug af Put/Call Ratio som en indikator for investorernes stemning overvinder en af de vigtigste mangler ved at bruge totalt institutionelt ejerskab, som er, at en betydelig mængde af aktiver under forvaltning investeres passivt for at spore indekser. Passivt forvaltede fonde køber typisk ikke optioner, så indikatoren for put/call-forholdet følger mere nøje følelsen af aktivt forvaltede fonde.
13F og NPORT arkivering
Detaljer om 13F-arkivering er gratis. Detaljer om NP-ansøgninger kræver et premium-medlemskab. Grønne rækker angiver nye positioner. Røde rækker angiver lukkede positioner. Klik på linket ikon for at se den fulde transaktionshistorik.
Opgrader
for at låse premium-data op og eksportere til Excel ![]() .
.
| Fil dato | Kilde | Investor | Type | Gennemsnitlig pris (Øst) |
Aktier | Δ Aktier (%) |
Rapporteret Værdi ($1000) |
Δ Værdi (%) |
Port Alloc (%) |
|
|---|---|---|---|---|---|---|---|---|---|---|
| 2025-07-16 | 13F | One + One Wealth Management, Llc | 79.982 | -0,73 | 3.174 | -11,62 | ||||
| 2025-05-15 | 13F | Gts Securities Llc | 0 | -100,00 | 0 | |||||
| 2025-08-14 | 13F | Mariner, LLC | 0 | -100,00 | 0 | |||||
| 2025-05-15 | 13F | Wolverine Trading, Llc | Put | 0 | -100,00 | 0 | -100,00 | |||
| 2025-08-11 | 13F | Sykon Capital Llc | 0 | -100,00 | 0 | |||||
| 2025-08-14 | 13F | Federation des caisses Desjardins du Quebec | 390 | -6,92 | 15 | -16,67 | ||||
| 2025-05-14 | 13F | Hsbc Holdings Plc | 0 | -100,00 | 0 | |||||
| 2025-07-21 | 13F | Mirae Asset Global Investments Co., Ltd. | 13.500 | -27,03 | 536 | -35,46 | ||||
| 2025-08-12 | 13F | MAI Capital Management | 62 | -50,40 | 2 | -60,00 | ||||
| 2025-07-16 | 13F | St Germain D J Co Inc | 2.750 | 109 | ||||||
| 2025-07-29 | 13F | Robinson Value Management, Ltd. | 0 | -100,00 | 0 | |||||
| 2025-07-22 | 13F | CPR Investments Inc. | 195.389 | 3,31 | 7.753 | -8,00 | ||||
| 2025-08-13 | 13F | Renaissance Technologies Llc | 0 | -100,00 | 0 | |||||
| 2025-08-25 | NP | ADOIX - AXS Dynamic Opportunity Fund Class I Shares | 55.000 | 0,00 | 2.182 | -10,94 | ||||
| 2025-05-14 | 13F | Flow Traders U.s. Llc | 0 | -100,00 | 0 | |||||
| 2025-05-12 | 13F | Aveo Capital Partners, LLC | 0 | -100,00 | 0 | |||||
| 2025-07-10 | 13F | Kozak & Associates, Inc. | 115 | 0,88 | 5 | -20,00 | ||||
| 2025-05-15 | 13F | Virtue Capital Management, LLC | 0 | -100,00 | 0 | |||||
| 2025-08-14 | 13F | Guardian Wealth Advisors, Llc / Nc | 72.058 | 2.859 | ||||||
| 2025-08-06 | 13F | Wedbush Securities Inc | 38.836 | 7,13 | 2 | 0,00 | ||||
| 2025-07-22 | 13F | Belpointe Asset Management LLC | 11.292 | -4,37 | 448 | -14,83 | ||||
| 2025-08-11 | 13F | AXS Investments LLC | 55.000 | 0,00 | 2.182 | -10,94 | ||||
| 2025-08-13 | 13F | Jump Financial, LLC | 6.396 | -90,13 | 254 | -91,23 | ||||
| 2025-07-24 | 13F | Blair William & Co/il | 1.941 | -2,22 | 77 | -12,50 | ||||
| 2025-08-12 | 13F | Coston, McIsaac & Partners | 95 | 0,00 | 0 | |||||
| 2025-07-24 | 13F | Us Bancorp \de\ | 122 | 0,00 | 5 | -20,00 | ||||
| 2025-07-23 | 13F | RiverTree Advisors, LLC | 14.929 | 592 | ||||||
| 2025-07-16 | 13F | ORG Partners LLC | 28.310 | 1.129 | ||||||
| 2025-07-15 | 13F | Town & Country Bank & Trust CO dba First Bankers Trust CO | 8.085 | 55,48 | 321 | 38,53 | ||||
| 2025-04-30 | 13F | Sofos Investments, Inc. | 13 | 1 | ||||||
| 2025-08-19 | 13F | Advisory Services Network, LLC | 6.400 | -94,18 | 250 | -94,92 | ||||
| 2025-08-14 | 13F | Brasada Capital Management, Lp | 72.800 | 0,00 | 2.857 | -21,40 | ||||
| 2025-08-14 | 13F | Two Sigma Securities, Llc | 0 | -100,00 | 0 | |||||
| 2025-07-07 | 13F | Fox Hill Wealth Management | 9.054 | -0,11 | 359 | -10,92 | ||||
| 2025-08-14 | 13F | Toroso Investments, LLC | 91.445 | -40,32 | 3.629 | -46,86 | ||||
| 2025-07-07 | 13F | Discipline Wealth Solutions, LLC | 16.450 | -9,23 | 653 | -19,21 | ||||
| 2025-08-05 | 13F | Verity Asset Management, Inc. | 52.947 | 3,30 | 2.101 | -8,02 | ||||
| 2025-07-21 | 13F | J. Safra Sarasin Holding AG | 25.181 | 385,18 | 999 | 332,47 | ||||
| 2025-08-11 | 13F | HighTower Advisors, LLC | 0 | -100,00 | 0 | |||||
| 2025-08-13 | 13F | Quadrature Capital Ltd | 0 | -100,00 | 0 | |||||
| 2025-08-12 | 13F | Change Path, LLC | 0 | -100,00 | 0 | |||||
| 2025-07-25 | 13F | Stack Financial Management, Inc | 0 | -100,00 | 0 | |||||
| 2025-07-18 | 13F | Vigilare Wealth Management | 0 | -100,00 | 0 | |||||
| 2025-08-08 | 13F | Financial Gravity Companies, Inc. | 7 | -46,15 | 0 | |||||
| 2025-05-15 | 13F | Bank Of America Corp /de/ | 0 | -100,00 | 0 | |||||
| 2025-08-14 | 13F | Bnp Paribas Arbitrage, Sa | 5 | -99,62 | 0 | -100,00 | ||||
| 2025-08-14 | 13F | Citadel Advisors Llc | Call | 127.250 | -18,29 | 5.049 | -27,24 | |||
| 2025-08-14 | 13F | Citadel Advisors Llc | Put | 456.525 | 2.048,35 | 18.115 | 1.814,80 | |||
| 2025-08-14 | 13F | Bank Of America Corp /de/ | Call | 300 | 0,00 | 12 | -15,38 | |||
| 2025-07-25 | 13F | Commonwealth Financial Services, LLC | 57.642 | 2.287 | ||||||
| 2025-05-01 | 13F | Reyes Financial Architecture, Inc. | 0 | 0 | ||||||
| 2025-05-08 | 13F | Harbour Investments, Inc. | 0 | -100,00 | 0 | |||||
| 2025-08-06 | 13F | North Capital, Inc. | 3.678 | -0,27 | 146 | -11,59 | ||||
| 2025-08-12 | 13F | Putnam Fl Investment Management Co | 0 | -100,00 | 0 | |||||
| 2025-08-07 | 13F | Allworth Financial LP | 1.773 | 384,43 | 70 | 337,50 | ||||
| 2025-08-05 | 13F | Financial Sense Advisors, Inc. | 0 | -100,00 | 0 | |||||
| 2025-08-08 | 13F | SBI Securities Co., Ltd. | 961 | 49,46 | 38 | 35,71 | ||||
| 2025-08-08 | 13F/A | Sterling Capital Management LLC | 381 | -9,50 | 15 | -16,67 | ||||
| 2025-08-27 | 13F/A | Squarepoint Ops LLC | 113.523 | -41,75 | 4.505 | -48,13 | ||||
| 2025-07-30 | 13F | Sterling Investment Management, Inc. | 100.587 | 3.991 | ||||||
| 2025-08-14 | 13F | Jane Street Group, Llc | 139.240 | 47,92 | 5.525 | 31,74 | ||||
| 2025-08-15 | 13F | WFA of San Diego, LLC | 910 | 36 | ||||||
| 2025-08-12 | 13F | Global Retirement Partners, LLC | 0 | -100,00 | 0 | |||||
| 2025-07-15 | 13F | Ridgecrest Wealth Partners, Llc | 0 | -100,00 | 0 | |||||
| 2025-07-28 | 13F | Axxcess Wealth Management, Llc | 248.200 | 24,66 | 9.849 | 11,01 | ||||
| 2025-05-14 | 13F | Van Hulzen Asset Management, LLC | 0 | -100,00 | 0 | |||||
| 2025-08-08 | 13F | Avantax Advisory Services, Inc. | 0 | -100,00 | 0 | |||||
| 2025-08-14 | 13F | Colony Group, LLC | 392.342 | -0,71 | 15.568 | -11,58 | ||||
| 2025-07-29 | 13F | Stableford Capital Ii Llc | 0 | -100,00 | 0 | |||||
| 2025-08-05 | 13F | Intellectus Partners, LLC | 0 | -100,00 | 0 | |||||
| 2025-07-30 | 13F | Whittier Trust Co Of Nevada Inc | 2.500 | 0,00 | 99 | -10,81 | ||||
| 2025-07-29 | 13F | Oxbow Advisors, LLC | 7.047 | 0,00 | 280 | -11,15 | ||||
| 2025-08-13 | 13F | Per Stirling Capital Management, LLC. | 37.646 | 144,36 | 1.494 | 117,64 | ||||
| 2025-08-08 | 13F | Pnc Financial Services Group, Inc. | 5.309 | 17,59 | 211 | 4,48 | ||||
| 2025-08-13 | 13F | Sepio Capital, LP | 7.500 | 0,00 | 298 | -11,08 | ||||
| 2025-08-14 | 13F | Hilton Capital Management, LLC | 86.960 | 3.451 | ||||||
| 2025-08-15 | 13F | Morgan Stanley | 623.109 | 8,95 | 24.725 | -2,98 | ||||
| 2025-05-15 | 13F | Parallax Volatility Advisers, L.P. | Call | 0 | -100,00 | 0 | ||||
| 2025-07-17 | 13F | HCR Wealth Advisors | 0 | -100,00 | 0 | |||||
| 2025-07-25 | 13F | We Are One Seven, LLC | 9.987 | -1,66 | 396 | -12,39 | ||||
| 2025-09-04 | 13F/A | Advisor Group Holdings, Inc. | 102 | -5,56 | 4 | 0,00 | ||||
| 2025-08-12 | 13F | XTX Topco Ltd | 0 | -100,00 | 0 | |||||
| 2025-07-14 | 13F | U.S. Capital Wealth Advisors, LLC | 27.050 | -25,22 | 1.073 | -33,40 | ||||
| 2025-08-12 | 13F | Seeds Investor Llc | 0 | -100,00 | 0 | |||||
| 2025-08-08 | 13F | Citizens Financial Group Inc/ri | 23.097 | -28,98 | 926 | -36,53 | ||||
| 2025-08-14 | 13F | Susquehanna International Group, Llp | 243.951 | 1.815,90 | 9.680 | 1.607,05 | ||||
| 2025-08-18 | 13F | Wolverine Trading, Llc | Call | 10.000 | -45,05 | 399 | -51,17 | |||
| 2025-08-14 | 13F | Susquehanna International Group, Llp | Call | 342.000 | 29,69 | 13.571 | 15,49 | |||
| 2025-08-14 | 13F | Susquehanna International Group, Llp | Put | 358.600 | 536,94 | 14.229 | 467,34 | |||
| 2025-08-14 | 13F | Quantinno Capital Management LP | 15.000 | 595 | ||||||
| 2025-08-08 | 13F | Wealth Quarterback LLC | 0 | -100,00 | 0 | |||||
| 2025-07-10 | 13F | Oliver Lagore Vanvalin Investment Group | 1.730 | 77 | ||||||
| 2025-05-12 | 13F | RIA Advisory Group LLC | 0 | -100,00 | 0 | |||||
| 2025-04-24 | 13F | Mascoma Wealth Management LLC | 0 | -100,00 | 0 | -100,00 | ||||
| 2025-07-22 | 13F | Global Assets Advisory, LLC | 0 | -100,00 | 0 | |||||
| 2025-07-08 | 13F | Little House Capital Llc | 5.647 | -63,60 | 224 | -67,58 | ||||
| 2025-08-14 | 13F | Qube Research & Technologies Ltd | 0 | -100,00 | 0 | |||||
| 2025-08-14 | 13F | UBS Group AG | 612.418 | -21,26 | 24.301 | -29,88 | ||||
| 2025-08-14 | 13F | Citadel Advisors Llc | 0 | -100,00 | 0 | |||||
| 2025-08-04 | 13F | Kovack Advisors, Inc. | 13.171 | -86,07 | 523 | -87,60 | ||||
| 2025-08-14 | 13F | Comerica Bank | 8.754 | 0,52 | 347 | -10,57 | ||||
| 2025-07-18 | 13F | Consolidated Portfolio Review Corp | 0 | -100,00 | 0 | |||||
| 2025-08-14 | 13F | GWM Advisors LLC | 6.562 | 503,68 | 260 | 441,67 | ||||
| 2025-07-31 | 13F | West Michigan Advisors, Llc | 5.511 | 221 | ||||||
| 2025-08-05 | 13F | Aviance Capital Partners, LLC | 12.250 | 486 | ||||||
| 2025-08-14 | 13F | Harvest Investment Services, LLC | 48.292 | 12,31 | 1.916 | 0,00 | ||||
| 2025-07-11 | 13F | Farther Finance Advisors, LLC | 962 | 38 | ||||||
| 2025-06-12 | 13F | Sheets Smith Investment Management | 6.657 | 297 | ||||||
| 2025-07-30 | 13F | Rothschild Capital Partners, LLC | 437.736 | 79,13 | 17.369 | 59,52 | ||||
| 2025-08-13 | 13F | HAP Trading, LLC | Call | 0 | -100,00 | 0 | ||||
| 2025-08-14 | 13F | Summit Trail Advisors, Llc | 0 | -100,00 | 0 | |||||
| 2025-08-13 | 13F | Beacon Pointe Advisors, LLC | 35.204 | -41,45 | 1.397 | -47,89 | ||||
| 2025-07-23 | 13F | Lattice Capital Management, LLC | 55.000 | 2.182 | ||||||
| 2025-08-13 | 13F | Townsquare Capital Llc | 7.672 | -2,84 | 304 | -13,39 | ||||
| 2025-08-14 | 13F | CIBC World Markets Inc. | 87.379 | 54,16 | 3.467 | 37,31 | ||||
| 2025-08-14 | 13F | Ancora Advisors, LLC | 5.000 | 198 | ||||||
| 2025-08-06 | 13F | Capasso Planning Partners LLC | 10.780 | 428 | ||||||
| 2025-08-13 | 13F | M&t Bank Corp | 13.668 | 54,27 | 542 | 37,56 | ||||
| 2025-08-06 | 13F | Nicholas Hoffman & Company, LLC. | 16.722 | 0,00 | 664 | -11,01 | ||||
| 2025-07-24 | 13F | Advanced Asset Management Advisors Inc | 8.500 | 337 | ||||||
| 2025-08-18 | 13F | Geneos Wealth Management Inc. | 58 | 0,00 | 2 | 0,00 | ||||
| 2025-08-19 | 13F | National Asset Management, Inc. | 93.081 | 22,85 | 3.693 | 15,01 | ||||
| 2025-07-29 | 13F | Stratos Wealth Partners, LTD. | 22.794 | 904 | ||||||
| 2025-08-07 | 13F | Capital Wealth Planning, LLC | 66.751 | -8,00 | 2.649 | -18,09 | ||||
| 2025-08-05 | 13F | Wakefield Asset Management LLLP | 77.724 | 3,50 | 3.085 | -7,83 | ||||
| 2025-08-14 | 13F | Elkhorn Partners Limited Partnership | 7.000 | -10,26 | 278 | |||||
| 2025-07-09 | 13F | Dynamic Advisor Solutions LLC | 23.083 | 135,23 | 916 | 109,38 | ||||
| 2025-08-04 | 13F | Arkadios Wealth Advisors | 8.118 | 322 | ||||||
| 2025-08-11 | 13F | Strategic Wealth Partners, Ltd. | 90 | 4 | ||||||
| 2025-07-10 | 13F | Wealth Enhancement Advisory Services, Llc | 10.106 | -76,59 | 397 | -79,41 | ||||
| 2025-08-08 | 13F | Arcadia Investment Management Corp/mi | 0 | -100,00 | 0 | |||||
| 2025-08-12 | 13F | Integrated Advisors Network LLC | 18.395 | 12,95 | 730 | 0,55 | ||||
| 2025-08-14 | 13F | Group One Trading, L.p. | 431 | 17 | ||||||
| 2025-05-12 | 13F | National Bank Of Canada /fi/ | 0 | -100,00 | 0 | |||||
| 2025-07-31 | 13F | Cambridge Investment Research Advisors, Inc. | 30.664 | -4,78 | 1 | 0,00 | ||||
| 2025-08-15 | 13F | Sugar Maple Asset Management, LLC | 21.337 | 847 | ||||||
| 2025-08-13 | 13F | Transce3nd, LLC | 925 | -90,66 | 37 | -91,84 | ||||
| 2025-07-29 | 13F | JTC Employer Solutions Trusteee Ltd | 2.500 | 0,00 | 0 | |||||
| 2025-08-14 | 13F | Raymond James Financial Inc | 1.933 | 77 | ||||||
| 2025-08-04 | 13F | Creative Financial Designs Inc /adv | 174 | 0,00 | 7 | -14,29 | ||||
| 2025-08-14 | 13F | Jane Street Group, Llc | Put | 195.450 | 3.313,97 | 7.755 | 2.941,18 | |||
| 2025-07-15 | 13F | Financial Management Professionals, Inc. | 601 | 380,80 | 24 | 380,00 | ||||
| 2025-08-14 | 13F | Jane Street Group, Llc | Call | 74.575 | -3,99 | 2.959 | -14,50 | |||
| 2025-07-31 | 13F | Oppenheimer & Co Inc | 36.487 | 25,96 | 1.448 | 12,17 | ||||
| 2025-08-07 | 13F | David R. Rahn & Associates Inc. | 0 | -100,00 | 0 | -100,00 | ||||
| 2025-08-14 | 13F | Arete Wealth Advisors, LLC | 245.630 | -5,22 | 10 | -18,18 | ||||
| 2025-08-14 | 13F | Royal Bank Of Canada | 8 | 0,00 | 0 | |||||
| 2025-07-23 | 13F | Litman Gregory Asset Management LLC | 9.375 | 0,00 | 372 | -10,79 | ||||
| 2025-08-12 | 13F | Proequities, Inc. | 0 | 0 | ||||||
| 2025-08-18 | 13F | Wolverine Trading, Llc | 0 | -100,00 | 0 | -100,00 | ||||
| 2025-07-31 | 13F | Saybrook Capital /nc | 0 | -100,00 | 0 | |||||
| 2025-04-25 | NP | HROAX - FinTrust Income and Opportunity Fund Class A Shares | 20.000 | 25,00 | 845 | 26,16 | ||||
| 2025-04-30 | 13F | Pineridge Advisors LLC | 0 | -100,00 | 0 | |||||
| 2025-07-08 | 13F | Lowe Wealth Advisors, LLC | 451 | 0,00 | 18 | -15,00 | ||||
| 2025-07-18 | 13F | PFG Investments, LLC | 16.507 | 655 | ||||||
| 2025-06-04 | 13F | Pvg Asset Management Corp | 0 | -100,00 | 0 | -100,00 | ||||
| 2025-07-09 | 13F | Graves-Light Private Wealth Management, Inc. | 17.282 | 0,70 | 686 | -10,34 | ||||
| 2025-05-12 | 13F | Sandy Spring Bank | 500 | 22 | ||||||
| 2025-07-08 | 13F | Rise Advisors, LLC | 7 | 0,00 | 0 | |||||
| 2025-08-14 | 13F | Farringdon Capital, Ltd. | 10.074 | 12,32 | 400 | 0,00 | ||||
| 2025-08-14 | 13F | Hrt Financial Lp | 32.445 | 1 | ||||||
| 2025-07-29 | 13F | Stratos Wealth Advisors, LLC | 71.579 | -81,13 | 2.840 | -83,19 | ||||
| 2025-08-13 | 13F | Cresset Asset Management, LLC | 0 | -100,00 | 0 | |||||
| 2025-08-13 | 13F | Northwestern Mutual Wealth Management Co | 0 | -100,00 | 0 | |||||
| 2025-08-14 | 13F | DRW Securities, LLC | 8.224 | 326 | ||||||
| 2025-08-05 | 13F | Bank Of Montreal /can/ | 8.049 | 1.232,62 | 319 | 1.126,92 | ||||
| 2025-08-13 | 13F | RW Investment Management LLC | 11.565 | 0,00 | 459 | -11,07 | ||||
| 2025-07-23 | 13F | Clear Creek Financial Management, LLC | 56.394 | -4,81 | 2.238 | -15,23 | ||||
| 2025-08-15 | 13F | Tower Research Capital LLC (TRC) | 24.525 | 690,11 | 973 | 605,07 | ||||
| 2025-06-26 | NP | HF - DGA Absolute Return ETF | 127.110 | -24,70 | 5.642 | -19,45 | ||||
| 2025-07-08 | 13F | First National Corp /ma/ /adv | 309.613 | -25,09 | 12.285 | -33,30 | ||||
| 2025-08-06 | 13F | Golden State Wealth Management, LLC | 742 | 0,41 | 29 | -9,37 | ||||
| 2025-07-09 | 13F | Mirador Capital Partners LP | 0 | -100,00 | 0 | |||||
| 2025-08-14 | 13F | Headlands Technologies LLC | 0 | -100,00 | 0 | -100,00 | ||||
| 2025-08-01 | 13F | Solstein Capital, LLC | 0 | -100,00 | 0 | |||||
| 2025-05-16 | 13F | Laidlaw Wealth Management LLC | 0 | -100,00 | 0 | |||||
| 2025-08-01 | 13F | Envestnet Asset Management Inc | 31.312 | 1.242 | ||||||
| 2025-05-15 | 13F | Parallax Volatility Advisers, L.P. | 0 | -100,00 | 0 | |||||
| 2025-05-05 | 13F | Lindbrook Capital, Llc | 0 | -100,00 | 0 | |||||
| 2025-07-30 | 13F | Lionsbridge Wealth Management LLC | 0 | -100,00 | 0 | |||||
| 2025-08-14 | 13F | SWAN Capital LLC | 56 | 0,00 | 2 | 0,00 | ||||
| 2025-08-12 | 13F | CIBC Private Wealth Group, LLC | 0 | -100,00 | 0 | |||||
| 2025-07-25 | 13F | Cwm, Llc | 462 | -97,99 | 0 | -100,00 | ||||
| 2025-08-14 | 13F | Warren Averett Asset Management, LLC | 0 | -100,00 | 0 | |||||
| 2025-08-08 | 13F | Foundations Investment Advisors, LLC | 7.960 | 12,27 | 316 | 0,00 | ||||
| 2025-08-14 | 13F | Millennium Management Llc | 6.680 | 265 | ||||||
| 2025-07-11 | 13F | Kaydan Wealth Management, Inc. | 0 | -100,00 | 0 | |||||
| 2025-08-13 | 13F | Truvestments Capital Llc | 0 | -100,00 | 0 | |||||
| 2025-08-12 | 13F | Jpmorgan Chase & Co | 7.394 | 255,48 | 293 | 218,48 | ||||
| 2025-08-12 | 13F | LPL Financial LLC | 132.109 | -3,85 | 5.242 | -14,37 | ||||
| 2025-08-13 | 13F | Sumitomo Mitsui Financial Group, Inc. | 12.000 | 0,00 | 476 | -10,86 | ||||
| 2025-05-14 | 13F | Oarsman Capital, Inc. | 0 | -100,00 | 0 | -100,00 | ||||
| 2025-07-11 | 13F | Afg Fiduciary Services Limited Partnership | 68.420 | 2.717 | ||||||
| 2025-08-14 | 13F | Goldman Sachs Group Inc | 12.500 | 0,00 | 496 | -10,95 | ||||
| 2025-08-13 | 13F | Natixis | 192 | -14,67 | 8 | -30,00 | ||||
| 2025-05-14 | 13F | Brown Brothers Harriman & Co | 0 | -100,00 | 0 | |||||
| 2025-08-14 | 13F | Diversify Advisory Services, LLC | 0 | -100,00 | 0 | |||||
| 2025-08-11 | 13F | Private Advisor Group, LLC | 0 | -100,00 | 0 |
Other Listings
| GB:0KOK |