Grundlæggende statistik
| Institutionelle aktier (lange) | 358.752.687 - 90,79% (ex 13D/G) - change of -38,18MM shares -9,55% MRQ |
| Institutionel værdi (lang) | $ 468.728 USD ($1000) |
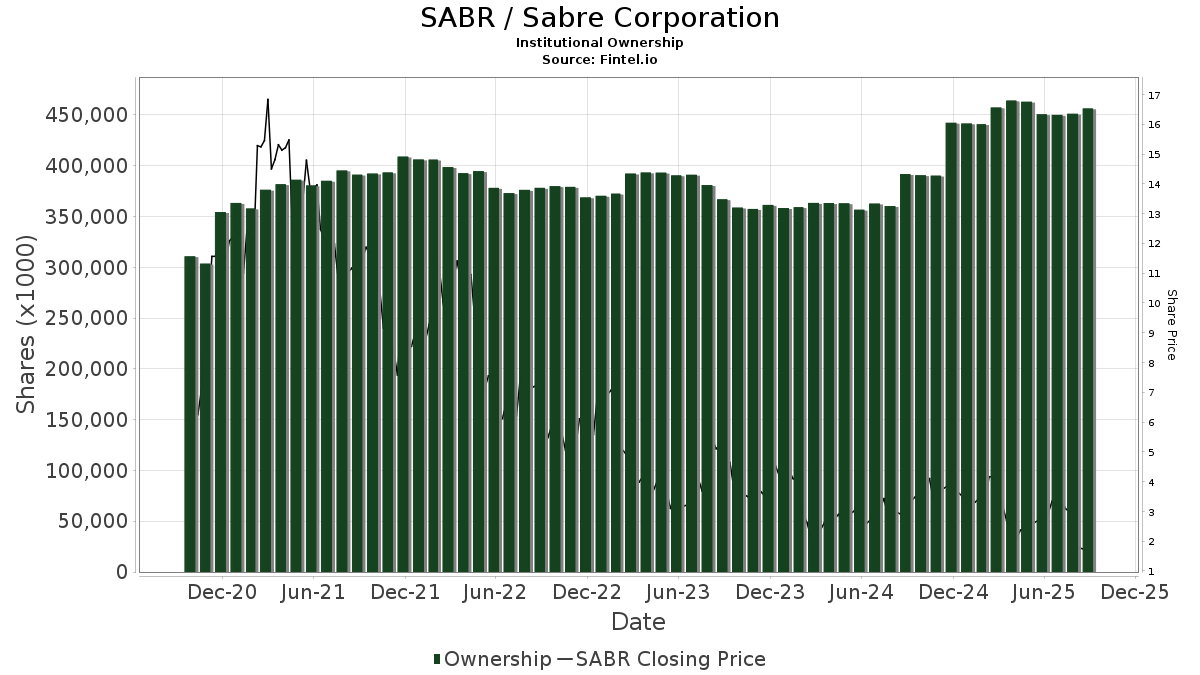
Institutionelt ejerskab og aktionærer
Sabre Corporation (US:SABR) har 260 institutionelle ejere og aktionærer, der har indsendt 13D/G- eller 13F-formularer til Securities Exchange Commission (SEC). Disse institutioner har i alt 358,752,687 aktier. Største aktionærer omfatter BlackRock, Inc., Discerene Group LP, Vanguard Group Inc, Earnest Partners Llc, Fundsmith LLP, State Street Corp, Apollo Management Holdings, L.P., Erste Asset Management GmbH, Oak Hill Advisors Lp, and Geode Capital Management, Llc .
Sabre Corporation (NasdaqGS:SABR) institutionel ejerskabsstruktur viser aktuelle positioner i virksomheden efter institutioner og fonde, samt seneste ændringer i positionsstørrelse. Større aktionærer kan omfatte individuelle investorer, investeringsforeninger, hedgefonde eller institutioner. Skema 13D angiver, at investoren besidder (eller besidder) mere end 5 % af virksomheden og har til hensigt (eller har til hensigt at) aktivt at forfølge en ændring i forretningsstrategi. Skema 13G indikerer en passiv investering på over 5%.
The share price as of April 30, 2026 is 1,83 / share. Previously, on May 2, 2025, the share price was 2,44 / share. This represents a decline of 25,00% over that period.
Fondens stemningsscore
Fund Sentiment Score (fka Ownership Accumulation Score) finder de aktier, der bliver mest købt af fonde. Det er resultatet af en sofistikeret, multi-faktor kvantitativ model, der identificerer virksomheder med de højeste niveauer af institutionel akkumulering. Scoringsmodellen bruger en kombination af den samlede stigning i oplyste ejere, ændringerne i porteføljeallokeringer i disse ejere og andre målinger. Tallet går fra 0 til 100, hvor højere tal indikerer et højere niveau af akkumulering for sine jævnaldrende, og 50 er gennemsnittet.
Opdateringsfrekvens: Dagligt
Se Ownership Explorer, som giver en liste over højest rangerende virksomheder.
AI+ Ask Fintel’s AI assistant about Sabre Corporation.
Select a question to share a public post with an AI-crafted answer.
Thinking of good questions…
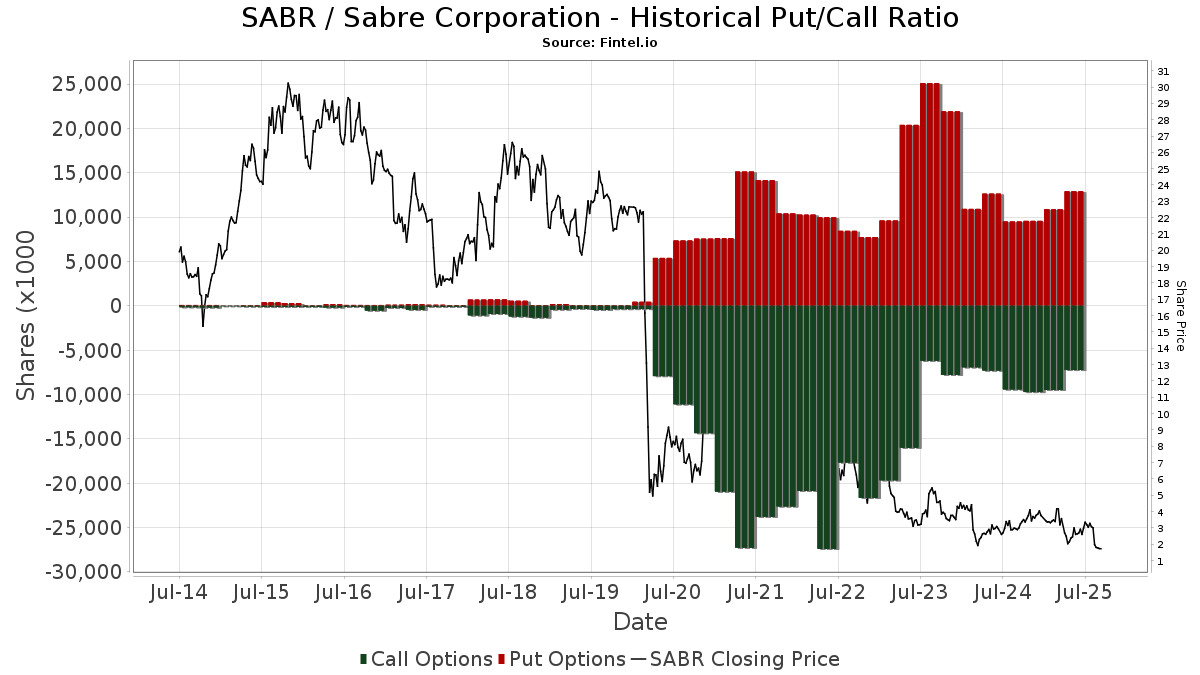
Institutionel Put/Call-forhold
Ud over at indberette standardaktie- og gældsudstedelser skal institutter med mere end 100 mill. aktiver under forvaltning også oplyse deres put- og call-optionsbeholdninger. Da salgsoptioner generelt indikerer negativ stemning, og købsoptioner indikerer positiv stemning, kan vi få en fornemmelse af den overordnede institutionelle stemning ved at plotte forholdet mellem put og kald. Diagrammet til højre viser det historiske put/call-forhold for dette instrument.
Brug af Put/Call Ratio som en indikator for investorernes stemning overvinder en af de vigtigste mangler ved at bruge totalt institutionelt ejerskab, som er, at en betydelig mængde af aktiver under forvaltning investeres passivt for at spore indekser. Passivt forvaltede fonde køber typisk ikke optioner, så indikatoren for put/call-forholdet følger mere nøje følelsen af aktivt forvaltede fonde.
13D/G-arkivering
Vi præsenterer 13D/G ansøgninger separat fra 13F ansøgninger på grund af den forskellige behandling af SEC. 13D/G-ansøgninger kan indgives af grupper af investorer (med én ledende), hvorimod 13F-ansøgninger ikke kan. Dette resulterer i situationer, hvor en investor kan indsende en 13D/G, der rapporterer én værdi for de samlede aktier (der repræsenterer alle de aktier, der ejes af investorgruppen), men derefter indsender en 13F, der rapporterer en anden værdi for de samlede aktier (der udelukkende repræsenterer deres egne) ejendomsret). Det betyder, at aktieejerskab af 13D/G-arkiver og 13F-arkiveringer ofte ikke er direkte sammenlignelige, så vi præsenterer dem separat.
Bemærk: Fra den 16. maj 2021 viser vi ikke længere ejere, der ikke har indsendt en 13D/G inden for det seneste år. Tidligere viste vi den fulde historie af 13D/G-arkiver. Generelt skal enheder, der er forpligtet til at indgive 13D/G-ansøgninger, indgive mindst årligt, før de indsender en afsluttende ansøgning. Dog forlader fonde nogle gange positioner uden at indsende en afsluttende ansøgning (dvs. de afvikler), så visning af den fulde historie resulterede nogle gange i forvirring om det nuværende ejerskab. For at undgå forvirring viser vi nu kun 'aktuelle' ejere - det vil sige - ejere, der har anmeldt inden for det seneste år.
Upgrade to unlock premium data.
| Fil dato | Form | Investor | Forrige Aktier |
Seneste Aktier |
Δ Aktier (Procent) |
Ejendomsret (Procent) |
Δ Ejerskab (Procent) |
|
|---|---|---|---|---|---|---|---|---|
| 2026-03-10 | Arini Captial Management Ltd | 19,814,968 | 5.01 | |||||
| 2026-03-05 | CONSTELLATION SOFTWARE INC | 50,157,523 | 12.70 | |||||
| 2026-01-30 | VANGUARD GROUP INC | 33,832,842 | 27,800,161 | -17.83 | 7.04 | -17.85 | ||
| 2026-01-23 | Discerene Group LP | 28,565,608 | 38,523,820 | 34.86 | 9.80 | 36.11 | ||
| 2025-11-14 | EARNEST PARTNERS LLC | 32,461,309 | 27,501,980 | -15.28 | 7.00 | -16.67 | ||
| 2025-07-17 | BlackRock, Inc. | 59,140,514 | 54,138,082 | -8.46 | 14.00 | -10.26 |
13F og NPORT arkivering
Detaljer om 13F-arkivering er gratis. Detaljer om NP-ansøgninger kræver et premium-medlemskab. Grønne rækker angiver nye positioner. Røde rækker angiver lukkede positioner. Klik på linket ikon for at se den fulde transaktionshistorik.
Opgrader
for at låse premium-data op og eksportere til Excel ![]() .
.
| Fil dato | Kilde | Investor | Type | Gennemsnitlig pris (Øst) |
Aktier | Δ Aktier (%) |
Rapporteret Værdi ($1000) |
Δ Værdi (%) |
Port Alloc (%) |
|
|---|---|---|---|---|---|---|---|---|---|---|
| 2026-02-17 | 13F | Russell Investments Group, Ltd. | 33.234 | 6,47 | 45 | -21,05 | ||||
| 2026-02-12 | 13F | CIBC Private Wealth Group, LLC | 100 | 0 | ||||||
| 2025-11-13 | 13F | Norges Bank | 0 | -100,00 | 0 | |||||
| 2026-02-13 | 13F | Colony Group, LLC | 11.007 | 12 | ||||||
| 2026-02-12 | 13F | Xponance, Inc. | 29.226 | 2,82 | 40 | -25,00 | ||||
| 2026-04-27 | 13F | Ethic Inc. | 17.894 | 26 | ||||||
| 2026-02-03 | 13F | Everence Capital Management Inc | 0 | -100,00 | 0 | |||||
| 2025-11-13 | 13F | Winton Capital Group Ltd | 0 | -100,00 | 0 | |||||
| 2025-11-14 | 13F | LMR Partners LLP | 0 | -100,00 | 0 | |||||
| 2026-02-11 | 13F | Cerity Partners LLC | 73.546 | 309,43 | 100 | 212,50 | ||||
| 2026-01-30 | 13F | Mitsubishi UFJ Trust & Banking Corp | 308.272 | 38,28 | 419 | 2,95 | ||||
| 2026-04-09 | 13F | Everhart Financial Group, Inc. | 11.056 | 16 | ||||||
| 2025-11-07 | 13F | Main Street Group, LTD | 0 | -100,00 | 0 | |||||
| 2026-04-16 | 13F | SG Americas Securities, LLC | 177.429 | -2,53 | 0 | |||||
| 2026-02-13 | 13F | Smartleaf Asset Management LLC | 2.000 | 3 | ||||||
| 2026-02-11 | 13F | Deutsche Bank Ag\ | 283.106 | 4,52 | 385 | -22,22 | ||||
| 2025-11-14 | 13F | Squarepoint Ops LLC | 0 | -100,00 | 0 | -100,00 | ||||
| 2026-02-13 | 13F | Wells Fargo & Company/mn | 1.157.394 | -20,54 | 1.574 | -40,94 | ||||
| 2026-02-26 | 13F/A | Sculptor Capital LP | Put | 0 | -100,00 | 0 | -100,00 | |||
| 2026-02-17 | 13F | Citadel Advisors Llc | Put | 172.200 | -89,87 | 234 | -92,48 | |||
| 2026-02-17 | 13F | Citadel Advisors Llc | Call | 286.300 | -67,93 | 389 | -76,18 | |||
| 2026-02-17 | 13F | Jump Financial, LLC | 52.622 | 335,90 | 72 | 222,73 | ||||
| 2026-04-13 | 13F | Mather Group, Llc. | 200 | 0 | ||||||
| 2026-04-07 | 13F | Signaturefd, Llc | 3.619 | 212,52 | 5 | 400,00 | ||||
| 2026-02-17 | 13F | Creative Planning | 34.903 | 37,60 | 47 | 2,17 | ||||
| 2026-02-13 | 13F | Public Sector Pension Investment Board | 1.372.497 | -11,11 | 1.867 | -33,95 | ||||
| 2026-02-13 | 13F | Neuberger Berman Group LLC | 12.991 | -16,46 | 18 | -39,29 | ||||
| 2025-11-10 | 13F | Axq Capital, Lp | 0 | -100,00 | 0 | -100,00 | ||||
| 2026-04-20 | 13F | Louisiana State Employees Retirement System | 175.100 | -3,21 | 254 | 2,85 | ||||
| 2026-02-17 | 13F | Two Sigma Securities, Llc | 88.518 | 651,62 | 120 | 471,43 | ||||
| 2026-02-13 | 13F | Barclays Plc | 578.245 | -0,17 | 786 | -25,85 | ||||
| 2026-04-30 | 13F | Nuveen, LLC | 790.736 | -41,73 | 1.147 | -37,89 | ||||
| 2025-11-14 | 13F | Beaconlight Capital, Llc | 0 | -100,00 | 0 | -100,00 | ||||
| 2026-04-28 | 13F | Bogart Wealth, LLC | 50 | 0 | ||||||
| 2026-02-13 | 13F | Brooklands Fund Management Ltd | 428.000 | 556 | ||||||
| 2026-02-12 | 13F | Dimensional Fund Advisors Lp | 4.377.810 | -6,79 | 5.953 | -30,73 | ||||
| 2026-02-06 | 13F | HighTower Advisors, LLC | 0 | -100,00 | 0 | |||||
| 2026-02-10 | 13F | Envestnet Asset Management Inc | 1.050.199 | -33,84 | 1.428 | -50,83 | ||||
| 2026-04-29 | 13F | Wesleyan Assurance Society | 0 | -100,00 | 0 | |||||
| 2026-02-11 | 13F | Erste Asset Management GmbH | 11.869.429 | 16.156 | ||||||
| 2026-01-29 | 13F | Comerica Bank | 84.963 | -20,43 | 116 | -41,03 | ||||
| 2026-02-06 | 13F | Mizuho Markets Americas Llc | 2.000.000 | 2.720 | ||||||
| 2026-02-13 | 13F | Brooklands Fund Management Ltd | Call | 0 | -100,00 | 0 | ||||
| 2026-02-17 | 13F | Parallax Volatility Advisers, L.P. | Call | 0 | -100,00 | 0 | ||||
| 2026-02-17 | 13F | Parallax Volatility Advisers, L.P. | Put | 0 | -100,00 | 0 | ||||
| 2026-04-13 | 13F | Massmutual Trust Co Fsb/adv | 0 | -100,00 | 0 | -100,00 | ||||
| 2025-11-12 | 13F | American Century Companies Inc | 0 | -100,00 | 0 | -100,00 | ||||
| 2026-02-23 | 13F | Beaird Harris Wealth Management, LLC | 35 | 0,00 | 0 | |||||
| 2026-02-17 | 13F | Fmr Llc | 794.963 | -1,38 | 1.081 | -26,71 | ||||
| 2026-02-09 | 13F | Hartland & Co., LLC | 0 | -100,00 | 0 | |||||
| 2026-01-30 | 13F | Us Bancorp \de\ | 545 | 0,00 | 1 | |||||
| 2025-11-14 | 13F | Prelude Capital Management, Llc | 0 | -100,00 | 0 | -100,00 | ||||
| 2026-04-15 | 13F | Atwood & Palmer Inc | 0 | -100,00 | 0 | -100,00 | ||||
| 2026-02-13 | 13F | Sei Investments Co | 24.111 | 0,00 | 33 | -27,27 | ||||
| 2026-02-17 | 13F | Atom Investors LP | 54.140 | 14,43 | 74 | -15,12 | ||||
| 2026-02-06 | 13F | Gsa Capital Partners Llp | 0 | -100,00 | 0 | |||||
| 2026-01-29 | 13F | UBS Group AG | Put | 336.000 | 0,00 | 457 | -25,73 | |||
| 2026-02-13 | 13F | Toroso Investments, LLC | 768.497 | -18,80 | 1.045 | -39,67 | ||||
| 2026-04-27 | 13F | New England Capital Financial Advisors LLC | 1.500 | 0,00 | 2 | 0,00 | ||||
| 2026-01-29 | 13F | UBS Group AG | Call | 240.000 | 0,00 | 326 | -25,74 | |||
| 2026-02-17 | 13F | Alliancebernstein L.p. | 373.923 | 0,00 | 509 | -25,73 | ||||
| 2026-01-29 | 13F | UBS Group AG | 3.234.964 | 44,99 | 4.400 | 7,74 | ||||
| 2026-02-17 | 13F | Jones Financial Companies Lllp | 22.836 | 20,15 | 31 | -6,06 | ||||
| 2026-02-04 | 13F | Legacy Financial Advisors, Inc. | 0 | -100,00 | 0 | |||||
| 2025-11-14 | 13F | Third Point LLC | 0 | -100,00 | 0 | -100,00 | ||||
| 2026-04-29 | 13F | Skopos Labs, Inc. | 132.259 | 192 | ||||||
| 2026-02-17 | 13F | Perry Creek Capital Lp | 1.629.120 | 0,00 | 2.216 | -25,70 | ||||
| 2026-01-29 | 13F | IMC-Chicago, LLC | Put | 321.000 | -43,43 | 437 | -58,00 | |||
| 2026-02-18 | 13F | DCM Advisors, LLC | 0 | -100,00 | 0 | |||||
| 2026-01-29 | 13F | IMC-Chicago, LLC | Call | 258.100 | 118,36 | 351 | 62,50 | |||
| 2026-02-13 | 13F | Discerene Group LP | 38.523.820 | 34,86 | 52.392 | 0,22 | ||||
| 2026-02-12 | 13F | Cibc World Markets Corp | 5.424.526 | 12.035,13 | 7.377 | 5.131,91 | ||||
| 2026-02-12 | 13F | Bank Of Montreal /can/ | 22.015 | -4,49 | 30 | -30,95 | ||||
| 2026-04-08 | 13F | Wealth Enhancement Advisory Services, Llc | 106.847 | 70,50 | 133 | 55,29 | ||||
| 2026-02-12 | 13F | Hrt Financial Lp | 147.700 | 0 | ||||||
| 2026-02-13 | 13F | State Street Corp | 14.813.630 | 2,37 | 20.147 | -23,92 | ||||
| 2025-11-14 | 13F | Algert Global Llc | 0 | -100,00 | 0 | -100,00 | ||||
| 2026-02-17 | 13F | Aquatic Capital Management LLC | 18.943 | 26 | ||||||
| 2025-11-12 | 13F | HAP Trading, LLC | Put | 148.000 | 88 | |||||
| 2025-11-14 | 13F | Wolverine Trading, Llc | Put | 520.800 | 9,83 | 958 | -36,43 | |||
| 2025-11-12 | 13F | HAP Trading, LLC | 156.222 | 286 | ||||||
| 2026-02-17 | 13F | Millennium Management Llc | Put | 100.000 | 136 | |||||
| 2026-02-17 | 13F | Millennium Management Llc | 173.134 | -95,92 | 235 | -96,98 | ||||
| 2026-04-23 | 13F | Oppenheimer Asset Management Inc. | 393.485 | 27,40 | 571 | 35,71 | ||||
| 2026-02-12 | 13F | Quadrant Capital Group Llc | 0 | -100,00 | 0 | |||||
| 2026-02-17 | 13F | Northern Trust Corp | 3.332.819 | -6,82 | 4.533 | -30,76 | ||||
| 2026-02-13 | 13F | Charles Schwab Investment Management Inc | 3.528.234 | -12,87 | 4.798 | -35,25 | ||||
| 2026-05-01 | 13F | International Assets Investment Management, Llc | 1.500 | 0,00 | 2 | 0,00 | ||||
| 2026-04-20 | 13F | State of Alaska, Department of Revenue | 197.640 | 0,00 | 0 | |||||
| 2026-04-21 | 13F | Ground Swell Capital, LLC | 0 | -100,00 | 0 | |||||
| 2026-02-13 | 13F | Manufacturers Life Insurance Company, The | 0 | -100,00 | 0 | |||||
| 2026-04-10 | 13F | Abound Wealth Management | 38 | 0,00 | 0 | |||||
| 2025-11-14 | 13F | Larson Financial Group LLC | 0 | -100,00 | 0 | |||||
| 2026-04-08 | 13F | NorthCrest Asset Manangement, LLC | 15.465 | 22 | ||||||
| 2026-02-10 | 13F | Acadian Asset Management Llc | 0 | -100,00 | 0 | |||||
| 2025-11-14 | 13F | Raymond James Financial Inc | 0 | -100,00 | 0 | -100,00 | ||||
| 2026-02-05 | 13F | Td Private Client Wealth Llc | 0 | -100,00 | 0 | |||||
| 2026-02-17 | 13F | MIRAE ASSET GLOBAL ETFS HOLDINGS Ltd. | 172.105 | 1,03 | 234 | -24,76 | ||||
| 2026-02-13 | 13F | Squarepoint Ops LLC | Call | 11.300 | 0,00 | 15 | -25,00 | |||
| 2025-11-04 | 13F | Convergence Investment Partners, LLC | 0 | -100,00 | 0 | -100,00 | ||||
| 2026-02-02 | 13F | Wolverine Asset Management Llc | Call | 950.000 | 1.292 | |||||
| 2026-04-10 | 13F | Perigon Wealth Management, LLC | 10.434 | -1,48 | 15 | 7,14 | ||||
| 2026-02-13 | 13F | Ubs Asset Management Americas Inc | 745.740 | -2,83 | 1.014 | -27,78 | ||||
| 2026-02-17 | 13F/A | RBF Capital, LLC | 600.313 | 0,00 | 816 | -25,68 | ||||
| 2026-02-06 | 13F | Global Retirement Partners, LLC | 1 | 0 | ||||||
| 2026-02-09 | 13F | Legal & General Group Plc | 955.562 | -7,50 | 1.300 | -31,27 | ||||
| 2026-02-02 | 13F | Wolverine Asset Management Llc | Put | 1.200 | 71,43 | 2 | 0,00 | |||
| 2026-04-15 | 13F | Journey Strategic Wealth Llc | 10.057 | 15 | ||||||
| 2025-11-12 | 13F | Headlands Technologies LLC | 0 | -100,00 | 0 | -100,00 | ||||
| 2025-11-14 | 13F | Mml Investors Services, Llc | 0 | -100,00 | 0 | |||||
| 2025-11-13 | 13F | Arrowstreet Capital, Limited Partnership | 0 | -100,00 | 0 | -100,00 | ||||
| 2026-02-17 | 13F | Capstone Investment Advisors, Llc | 0 | -100,00 | 0 | -100,00 | ||||
| 2025-11-13 | 13F | Rathbone Brothers plc | 0 | -100,00 | 0 | |||||
| 2025-11-13 | 13F | Quadrature Capital Ltd | 0 | -100,00 | 0 | |||||
| 2026-02-17 | 13F | Susquehanna International Group, Llp | 1.851.668 | 30,84 | 2.518 | -2,74 | ||||
| 2026-04-27 | 13F | Y-Intercept (Hong Kong) Ltd | 36.064 | 52 | ||||||
| 2026-02-17 | 13F | Susquehanna International Group, Llp | Put | 248.000 | -87,91 | 337 | -91,02 | |||
| 2026-02-17 | 13F | Susquehanna International Group, Llp | Call | 1.358.100 | -11,28 | 1.847 | -34,06 | |||
| 2026-02-10 | 13F | Bnp Paribas Arbitrage, Sa | 115.421 | 26,73 | 157 | -6,02 | ||||
| 2025-11-14 | 13F | Jain Global LLC | 0 | -100,00 | 0 | -100,00 | ||||
| 2026-02-17 | 13F | Fundsmith LLP | 21.499.095 | 0,00 | 29.239 | -25,68 | ||||
| 2026-02-17 | 13F | Warren Averett Asset Management, LLC | 11.127 | 2,91 | 15 | -21,05 | ||||
| 2026-02-10 | 13F/A | Northwestern Mutual Wealth Management Co | 21.194 | -11,10 | 29 | -34,88 | ||||
| 2026-02-13 | 13F | BNP Paribas Asset Management Holding S.A. | 6.265 | 48,07 | 0 | |||||
| 2026-02-17 | 13F | Bank Of America Corp /de/ | 1.027.817 | -39,09 | 1.398 | -54,76 | ||||
| 2026-02-10 | 13F | Goldman Sachs Group Inc | 2.752.280 | -12,37 | 3.743 | -34,87 | ||||
| 2026-01-29 | 13F | Simon Quick Advisors, Llc | 974.807 | 1.326 | ||||||
| 2026-01-23 | 13F | Diligent Investors, LLC | 0 | -100,00 | 0 | |||||
| 2026-02-06 | 13F | BOK Financial Private Wealth, Inc. | 0 | -100,00 | 0 | |||||
| 2026-02-13 | 13F | Rhumbline Advisers | 1.122.833 | 3,49 | 1.527 | -23,07 | ||||
| 2026-04-14 | 13F | Nbc Securities, Inc. | 4.320 | 137,36 | 6 | 200,00 | ||||
| 2026-02-17 | 13F | Schonfeld Strategic Advisors LLC | 0 | -100,00 | 0 | |||||
| 2026-01-29 | 13F | Vanguard Group Inc | 27.800.161 | -17,83 | 37.808 | -38,93 | ||||
| 2026-02-02 | 13F | Wolverine Asset Management Llc | 0 | -100,00 | 0 | -100,00 | ||||
| 2026-02-17 | 13F | Cetera Investment Advisers | 30.082 | 8,09 | 41 | -20,00 | ||||
| 2026-04-30 | 13F | Hsbc Holdings Plc | 35.394 | 0,00 | 51 | 6,25 | ||||
| 2026-04-30 | 13F | Clear Street Markets Llc | 0 | -100,00 | 0 | |||||
| 2026-04-10 | 13F | Briaud Financial Planning, Inc | 0 | -100,00 | 0 | |||||
| 2025-11-14 | 13F | Hughes Financial Services, LLC | 0 | -100,00 | 0 | |||||
| 2025-11-14 | 13F | Old Mission Capital Llc | 0 | -100,00 | 0 | -100,00 | ||||
| 2026-02-13 | 13F | Caitong International Asset Management Co., Ltd | 28.960 | 17,41 | 39 | -13,33 | ||||
| 2026-02-13 | 13F | National Bank Of Canada /fi/ | 2.359 | 227,18 | 3 | 200,00 | ||||
| 2026-02-17 | 13F | Saba Capital Management, L.P. | 8.879.182 | 46,75 | 12.076 | 9,06 | ||||
| 2026-02-06 | 13F | GPS Wealth Strategies Group, LLC | 1.200 | 0,00 | 2 | -50,00 | ||||
| 2026-02-17 | 13F | Sig Brokerage, Lp | Put | 20.000 | -90,44 | 27 | -92,95 | |||
| 2026-02-13 | 13F | Islay Capital Management, Llc | 200 | 0,00 | 0 | |||||
| 2026-03-31 | 13F/A | Barclays Plc | Call | 0 | -100,00 | 0 | -100,00 | |||
| 2026-02-12 | 13F | BlackRock, Inc. | Call | 2.750.000 | 161,90 | 3.740 | 94,69 | |||
| 2026-02-17 | 13F | Two Sigma Advisers, Lp | 0 | -100,00 | 0 | -100,00 | ||||
| 2026-02-12 | 13F | BlackRock, Inc. | 56.510.023 | 3,39 | 76.854 | -23,16 | ||||
| 2026-02-17 | 13F | Citadel Advisors Llc | 0 | -100,00 | 0 | -100,00 | ||||
| 2026-02-17 | 13F | California State Teachers Retirement System | 369.793 | 9,25 | 503 | -18,90 | ||||
| 2026-02-17 | 13F | Optiver Holding B.V. | 4.610 | 163,88 | 6 | 100,00 | ||||
| 2026-02-17 | 13F | Stonehill Capital Management Llc | 4.897.216 | 7 | ||||||
| 2025-11-13 | 13F | Prevatt Capital Ltd | 0 | -100,00 | 0 | -100,00 | ||||
| 2026-02-11 | 13F | Ing Groep Nv | 2.000.000 | 2.720 | ||||||
| 2026-02-17 | 13F | Royal Bank Of Canada | 15.722 | 77,37 | 22 | 37,50 | ||||
| 2025-11-14 | 13F | Par Capital Management Inc | 0 | -100,00 | 0 | |||||
| 2026-04-07 | 13F | Farther Finance Advisors, LLC | 2.193 | 430,99 | 3 | |||||
| 2026-02-11 | 13F | Ameritas Investment Partners, Inc. | 30.309 | 41 | ||||||
| 2026-04-20 | 13F/A | OP Asset Management Ltd | 0 | 0 | ||||||
| 2026-02-11 | 13F | Simplex Trading, Llc | Put | 9.500 | -91,67 | 13 | ||||
| 2026-02-11 | 13F | Simplex Trading, Llc | 90.760 | 85,00 | 123 | |||||
| 2026-02-13 | 13F | Ieq Capital, Llc | 57.802 | 457,02 | 79 | 333,33 | ||||
| 2026-04-28 | 13F | Abel Hall, LLC | 12.212 | 18 | ||||||
| 2026-02-17 | 13F | CastleKnight Management LP | 415.340 | 58,04 | 565 | 17,50 | ||||
| 2026-02-13 | 13F | Victory Capital Management Inc | 56.280 | 0,51 | 77 | -25,49 | ||||
| 2026-02-06 | 13F | Pnc Financial Services Group, Inc. | 21.255 | -44,85 | 29 | -60,00 | ||||
| 2026-02-11 | 13F | MCF Advisors LLC | 64.034 | 0,00 | 87 | -25,64 | ||||
| 2026-05-01 | 13F | Fifth Third Bancorp | 89.166 | 47.838,71 | 129 | |||||
| 2026-04-27 | 13F | New York State Teachers Retirement System | 311.607 | -14,19 | 0 | |||||
| 2026-02-12 | 13F | Sprott Inc. | 0 | -100,00 | 0 | -100,00 | ||||
| 2026-02-11 | 13F | LPL Financial LLC | 61.785 | -8,78 | 84 | -31,71 | ||||
| 2026-02-17 | 13F | Whitebox Advisors Llc | Call | 1.000.000 | 0,00 | 1.360 | -25,68 | |||
| 2026-02-17 | 13F | Guggenheim Capital Llc | 0 | -100,00 | 0 | |||||
| 2026-02-12 | 13F | Steward Partners Investment Advisory, Llc | 300 | -95,59 | 0 | -100,00 | ||||
| 2026-04-20 | 13F | Triangle Securities Wealth Management | 10.579 | 0,00 | 15 | 7,14 | ||||
| 2026-04-23 | 13F | SJS Investment Consulting Inc. | 91 | 0 | ||||||
| 2026-02-12 | 13F | EntryPoint Capital, LLC | 11.094 | 15 | ||||||
| 2026-02-09 | 13F | Atlantic Trust, LLC | 0 | -100,00 | 0 | |||||
| 2026-04-17 | 13F | Krilogy Financial LLC | 10.069 | 18 | ||||||
| 2026-02-09 | 13F | MTM Investment Management, LLC | 6.999 | 10 | ||||||
| 2026-02-17 | 13F | Lazard Asset Management Llc | 0 | -100,00 | 0 | -100,00 | ||||
| 2026-02-11 | 13F | Jpmorgan Chase & Co | 1.513.637 | 404,94 | 2.059 | 275,55 | ||||
| 2025-11-07 | 13F | Shell Asset Management Co | 13.411 | -60,44 | 0 | |||||
| 2026-02-17 | 13F | Shelton Capital Management | 13.395 | 18 | ||||||
| 2025-11-07 | 13F | 626 Financial, LLC | 0 | -100,00 | 0 | -100,00 | ||||
| 2026-04-29 | 13F | Connable Office Inc | 129.257 | 0,00 | 187 | 6,86 | ||||
| 2026-02-11 | 13F | Simplex Trading, Llc | Call | 289.400 | -8,62 | 394 | ||||
| 2026-04-03 | 13F | Investors Research Corp | 1.400 | 0,00 | 2 | 100,00 | ||||
| 2025-11-12 | 13F | Icon Advisers Inc/co | 0 | -100,00 | 0 | |||||
| 2026-02-18 | 13F | EP Wealth Advisors, Inc. | 83.094 | 0,94 | 113 | -56,54 | ||||
| 2026-02-17 | 13F | Equitec Proprietary Markets, Llc | 1.000 | 0,00 | 1 | 0,00 | ||||
| 2026-02-03 | 13F | Harel Insurance Investments & Financial Services Ltd. | 310 | -0,96 | 0 | |||||
| 2026-02-17 | 13F | Empyrean Capital Partners, LP | 0 | -100,00 | 0 | |||||
| 2026-02-13 | 13F | Centiva Capital, LP | 19.630 | 27 | ||||||
| 2026-02-06 | 13F | Bare Financial Services, Inc | 0 | -100,00 | 0 | |||||
| 2026-02-12 | 13F | MetLife Investment Management, LLC | 156.928 | -18,56 | 213 | -39,49 | ||||
| 2026-04-13 | 13F | True Wealth Design, LLC | 43 | -93,80 | 0 | |||||
| 2026-02-17 | 13F | Advisory Services Network, LLC | 0 | -100,00 | 0 | |||||
| 2026-02-13 | 13F | First Trust Advisors Lp | 0 | -100,00 | 0 | -100,00 | ||||
| 2026-04-29 | 13F | Oregon Public Employees Retirement Fund | 90.260 | -0,11 | 131 | 6,56 | ||||
| 2026-02-13 | 13F | Morgan Stanley | 5.095.875 | 83,94 | 6.930 | 36,71 | ||||
| 2026-01-27 | 13F | TD Waterhouse Canada Inc. | 1.500 | -31,82 | 2 | -50,00 | ||||
| 2025-11-10 | 13F | ANTIPODES PARTNERS Ltd | 0 | -100,00 | 0 | -100,00 | ||||
| 2026-02-10 | 13F | Rothschild Investment Llc | 625 | 20.733,33 | 1 | |||||
| 2026-02-10 | 13F | MUFG Securities EMEA plc | 1.000.000 | 0,00 | 1.360 | -25,68 | ||||
| 2026-02-17 | 13F | Brevan Howard Capital Management LP | 115.286 | -72,30 | 157 | -79,50 | ||||
| 2026-02-13 | 13F | Wells Fargo & Company/mn | Put | 0 | -100,00 | 0 | -100,00 | |||
| 2026-02-13 | 13F | Estabrook Capital Management | 0 | -100,00 | 0 | |||||
| 2025-11-06 | 13F | MQS Management LLC | 0 | -100,00 | 0 | |||||
| 2026-01-28 | 13F | Salomon & Ludwin, LLC | 3.951 | -0,18 | 5 | -28,57 | ||||
| 2026-01-26 | 13F | Cwm, Llc | 69.267 | -5,20 | 0 | |||||
| 2026-02-17 | 13F | Caption Management, LLC | 143.142 | 0,00 | 195 | -25,67 | ||||
| 2026-02-17 | 13F | Caption Management, LLC | Put | 240.000 | 0,00 | 326 | -25,74 | |||
| 2026-04-10 | 13F | Oxinas Partners Wealth Management LLC | 16.250 | -82,98 | 24 | -82,17 | ||||
| 2026-02-17 | 13F | State Of Wisconsin Investment Board | 22.257 | -39,72 | 30 | -55,22 | ||||
| 2026-01-05 | 13F | Park Avenue Securities Llc | 0 | -100,00 | 0 | |||||
| 2026-02-13 | 13F | Contrarian Capital Management, L.l.c. | 0 | -100,00 | 0 | |||||
| 2026-02-13 | 13F | Verition Fund Management LLC | 212.500 | 31,79 | 289 | -2,03 | ||||
| 2026-02-17 | 13F | Two Sigma Investments, Lp | 194.653 | -73,54 | 265 | -80,39 | ||||
| 2026-02-13 | 13F | Pathstone Holdings, LLC | 28.094 | 31,26 | 38 | -2,56 | ||||
| 2026-01-26 | 13F | AE Wealth Management LLC | 0 | -100,00 | 0 | |||||
| 2026-02-17 | 13F | Advisor Group Holdings, Inc. | 6.543 | -31,43 | 9 | -52,94 | ||||
| 2026-02-11 | 13F | IMA Wealth, Inc. | 361 | 0 | ||||||
| 2026-02-12 | 13F | Renaissance Technologies Llc | 114.549 | -79,62 | 156 | -84,92 | ||||
| 2025-11-21 | 13F | Nebula Research & Development LLC | 0 | -100,00 | 0 | |||||
| 2026-02-13 | 13F | Stifel Financial Corp | 34.022 | -23,47 | 46 | -43,21 | ||||
| 2026-02-17 | 13F | Ameriprise Financial Inc | 651.971 | -12,56 | 887 | -35,04 | ||||
| 2026-02-04 | 13F | Dynamic Wealth Strategies, LLC | 500 | 1 | ||||||
| 2026-04-24 | 13F | ProShare Advisors LLC | 57.940 | -19,71 | 84 | -14,29 | ||||
| 2026-02-09 | 13F | Catalyst Funds Management Pty Ltd | 16.072 | -47,99 | 22 | -62,50 | ||||
| 2026-01-26 | 13F | KBC Group NV | 16.271 | 0,00 | 0 | |||||
| 2026-02-10 | 13F | Bank of New York Mellon Corp | 2.105.836 | -19,86 | 2.864 | -40,45 | ||||
| 2026-01-29 | 13F | Dunhill Financial, LLC | 5 | 0 | ||||||
| 2026-02-09 | 13F | Annis Gardner Whiting Capital Advisors, LLC | 7 | 0,00 | 0 | |||||
| 2026-02-17 | 13F | Bank Of America Corp /de/ | Put | 0 | -100,00 | 0 | -100,00 | |||
| 2025-11-14 | 13F | Texas Permanent School Fund | 0 | -100,00 | 0 | -100,00 | ||||
| 2026-02-17 | 13F | Oak Hill Advisors Lp | 10.177.079 | 0,00 | 13.841 | -25,69 | ||||
| 2026-03-16 | 13F/A | Rockefeller Capital Management L.P. | 3.216 | 2,88 | 4 | -20,00 | ||||
| 2026-02-20 | 13F | Sunbelt Securities, Inc. | 23 | -85,89 | 0 | |||||
| 2026-02-17 | 13F | Apollo Management Holdings, L.P. | 14.400.819 | 0,00 | 19.585 | -25,68 | ||||
| 2026-02-17 | 13F | Gotham Asset Management, LLC | 139.167 | 15,24 | 189 | -14,48 | ||||
| 2026-04-15 | 13F | Merit Financial Group, LLC | 22.363 | 32 | ||||||
| 2026-02-09 | 13F | Huntington National Bank | 1 | 0,00 | 0 | |||||
| 2025-11-14 | 13F | Apis Capital Advisors, LLC | 0 | -100,00 | 0 | -100,00 | ||||
| 2026-02-11 | 13F | Parallel Advisors, LLC | 92 | 0 | ||||||
| 2026-04-10 | 13F | Oak Thistle LLC | 19.753 | -0,52 | 29 | 3,70 | ||||
| 2026-02-27 | 13F/A | Barclays Plc | Put | 0 | -100,00 | 0 | -100,00 | |||
| 2026-02-13 | 13F | Pinnacle Wealth Planning Services, Inc. | 11.670 | 16 | ||||||
| 2026-02-13 | 13F | Prudential Financial Inc | 372.356 | -6,48 | 506 | -30,49 | ||||
| 2026-02-12 | 13F | Jane Street Group, Llc | Call | 335.700 | 133,77 | 457 | 74,05 | |||
| 2026-02-13 | 13F | MAI Capital Management | 299 | -33,41 | 0 | |||||
| 2026-02-03 | 13F | Crossmark Global Holdings, Inc. | 26.004 | 0,00 | 35 | -25,53 | ||||
| 2026-02-12 | 13F | Jane Street Group, Llc | Put | 14.200 | -91,04 | 19 | -93,45 | |||
| 2026-02-12 | 13F | Jane Street Group, Llc | 574.635 | 15,86 | 782 | -13,89 | ||||
| 2026-02-17 | 13F | Parallax Volatility Advisers, L.P. | 10.084 | 14 | ||||||
| 2026-02-10 | 13F | CIBC Asset Management Inc | 38.134 | 214,09 | 52 | 131,82 | ||||
| 2026-04-30 | 13F | Nisa Investment Advisors, Llc | 7.431 | 11 | ||||||
| 2026-02-06 | 13F | Covestor Ltd | 4.957 | 12.292,50 | 0 | |||||
| 2026-02-17 | 13F | Susquehanna Fundamental Investments, Llc | 0 | -100,00 | 0 | |||||
| 2026-05-01 | 13F | U S Global Investors Inc | 7.534.906 | -25,94 | 10.926 | -21,04 | ||||
| 2025-12-09 | 13F/A | Tudor Investment Corp Et Al | 0 | -100,00 | 0 | -100,00 | ||||
| 2026-02-12 | 13F | Federation des caisses Desjardins du Quebec | 7.275 | -72,95 | 10 | -81,63 | ||||
| 2026-02-19 | 13F | Invesco Ltd. | 3.016.464 | -6,18 | 4.102 | -30,29 | ||||
| 2026-04-23 | 13F | Cornerstone Wealth Management, LLC | 15.000 | 0,00 | 22 | 5,00 | ||||
| 2026-02-17 | 13F | Wiley Bros.-aintree Capital, Llc | 27.207 | 5,30 | 36 | -25,53 | ||||
| 2026-02-17 | 13F | Lombard Odier Asset Management (USA) Corp | Call | 0 | -100,00 | 0 | -100,00 | |||
| 2026-02-17 | 13F | Nomura Holdings Inc | Put | 309.000 | 420 | |||||
| 2026-02-06 | 13F | Saranac Partners Ltd | 0 | -100,00 | 0 | |||||
| 2026-02-10 | 13F | Connor, Clark & Lunn Investment Management Ltd. | 3.586.209 | -9,58 | 4.877 | -32,80 | ||||
| 2026-02-17 | 13F | Nomura Holdings Inc | 6.019.485 | 3.762,04 | 8.186 | 2.772,28 | ||||
| 2026-02-12 | 13F | Voya Investment Management Llc | 230.311 | -44,23 | 313 | -58,54 | ||||
| 2026-02-12 | 13F | Earnest Partners Llc | 25.893.384 | -5,85 | 35.215 | -30,03 | ||||
| 2026-02-13 | 13F | Citigroup Inc | 101.291 | -67,43 | 138 | -75,92 | ||||
| 2026-04-15 | 13F | Fortitude Family Office, LLC | 422 | 1 | ||||||
| 2026-02-04 | 13F | Swiss Life Asset Management Ltd | 15.791 | 0,00 | 21 | -25,00 | ||||
| 2026-01-29 | 13F | Teachers Retirement System Of The State Of Kentucky | 98.016 | 0,00 | 0 | |||||
| 2026-02-12 | 13F | Swiss National Bank | 739.100 | 3,47 | 1.005 | -23,11 | ||||
| 2026-02-13 | 13F | Hill City Capital, LP | 4.667.000 | 0,00 | 6.347 | -25,68 | ||||
| 2026-02-04 | 13F | Versor Investments LP | 185.900 | 253 | ||||||
| 2026-02-12 | 13F | New York State Common Retirement Fund | 93.694 | 0,00 | 127 | -25,73 | ||||
| 2026-04-28 | 13F | Bfsg, Llc | 800 | 0,00 | 1 | 0,00 | ||||
| 2026-04-17 | 13F | Fifth Third Wealth Advisors LLC | 10.548 | 4,64 | 15 | 15,38 | ||||
| 2026-02-13 | 13F | Walleye Trading LLC | 53.928 | 73 | ||||||
| 2026-02-13 | 13F | Walleye Trading LLC | Put | 220.500 | 21.950,00 | 300 | 29.800,00 | |||
| 2026-02-13 | 13F | Walleye Trading LLC | Call | 81.800 | -40,94 | 111 | -56,13 | |||
| 2026-04-22 | 13F | Coston, McIsaac & Partners | 6.336 | -14,61 | 0 | |||||
| 2026-02-06 | 13F | EverSource Wealth Advisors, LLC | 1.752 | 236,92 | 2 | |||||
| 2025-11-12 | 13F | Cambridge Investment Research Advisors, Inc. | 0 | -100,00 | 0 | |||||
| 2026-01-27 | 13F | Zurcher Kantonalbank (Zurich Cantonalbank) | 109.185 | 0,00 | 148 | -25,63 | ||||
| 2026-01-28 | 13F | CAPROCK Group, Inc. | 22.895 | -4,67 | 31 | -26,19 | ||||
| 2026-05-01 | 13F | Thrivent Financial For Lutherans | 263.568 | -2,86 | 0 | |||||
| 2026-02-17 | 13F | XTX Topco Ltd | 190.088 | 196,17 | 259 | 120,51 | ||||
| 2026-02-13 | 13F | Walleye Capital LLC | 0 | -100,00 | 0 | |||||
| 2026-04-08 | 13F | Capital Advisors Wealth Management, LLC | 15.000 | 0,00 | 22 | 5,00 | ||||
| 2026-04-29 | 13F | Klp Kapitalforvaltning As | 0 | -100,00 | 0 | |||||
| 2026-01-28 | 13F | Universal- Beteiligungs- und Servicegesellschaft mbH | 35.027 | 0,00 | 48 | -26,56 | ||||
| 2026-02-13 | 13F | Walleye Capital LLC | Put | 0 | -100,00 | 0 | ||||
| 2026-02-17 | 13F | Susquehanna Portfolio Strategies, LLC | 0 | -100,00 | 0 | -100,00 | ||||
| 2026-02-13 | 13F | Walleye Capital LLC | Call | 0 | -100,00 | 0 | ||||
| 2026-02-11 | 13F | Los Angeles Capital Management Llc | 35.945 | -70,20 | 69 | -69,09 | ||||
| 2026-02-26 | 13F/A | Alpine Global Management, LLC | 129.496 | 176 | ||||||
| 2026-04-24 | 13F | Abacus Wealth Partners, LLC | 163.391 | 364,84 | 237 | 402,13 | ||||
| 2026-02-11 | 13F | 111 Capital | 11.760 | 16 | ||||||
| 2026-04-22 | 13F | Ampfield Management, L.P. | 5.175.945 | 8 | ||||||
| 2026-02-13 | 13F | Ubs Oconnor Llc | Put | 688.600 | 0,00 | 706 | 67,86 | |||
| 2026-02-17 | 13F | Canada Pension Plan Investment Board | 278.700 | 290,34 | 379 | 191,54 | ||||
| 2026-02-17 | 13F | Amundi | 49.857 | -21,29 | 68 | -42,74 | ||||
| 2026-04-24 | 13F | Yousif Capital Management, Llc | 105.451 | -0,14 | 153 | 12,59 | ||||
| 2026-02-13 | 13F | Ubs Oconnor Llc | 550.900 | 0,00 | 749 | -25,69 | ||||
| 2026-02-17 | 13F | Readystate Asset Management Lp | 0 | -100,00 | 0 | |||||
| 2026-04-27 | 13F | HB Wealth Management, LLC | 10.622 | 15 | ||||||
| 2026-04-28 | 13F | SBI Securities Co., Ltd. | 589 | 0,00 | 1 | |||||
| 2026-04-24 | 13F | Profund Advisors Llc | 21.287 | -55,47 | 31 | -53,85 | ||||
| 2026-02-17 | 13F | Quantessence Capital LLC | 0 | -100,00 | 0 | |||||
| 2026-02-13 | 13F | Cornerstone Financial Management LLC | 331 | 0 | ||||||
| 2026-02-13 | 13F | Public Employees Retirement Association Of Colorado | 42.303 | 0,00 | 0 | |||||
| 2025-11-14 | 13F | CI Private Wealth, LLC | 0 | -100,00 | 0 | |||||
| 2026-04-07 | 13F | Abacus Planning Group, Inc. | 0 | -100,00 | 0 | -100,00 | ||||
| 2025-11-13 | 13F | Simcoe Capital Management, LLC | 0 | -100,00 | 0 | |||||
| 2026-02-17 | 13F | D. E. Shaw & Co., Inc. | 387.233 | 0,42 | 527 | -25,39 | ||||
| 2026-02-17 | 13F | Balyasny Asset Management Llc | 1.455.933 | 144,23 | 1.980 | 81,65 | ||||
| 2025-11-14 | 13F | Wolverine Trading, Llc | 369.328 | 311,36 | 680 | 138,25 | ||||
| 2026-04-21 | 13F | Poehling Capital Management, LLC | 0 | -100,00 | 0 | |||||
| 2026-02-18 | 13F | NFP Retirement, Inc. | 0 | -100,00 | 0 | |||||
| 2025-11-14 | 13F | Wolverine Trading, Llc | Call | 65.200 | 8,13 | 120 | -37,70 | |||
| 2026-02-17 | 13F | Balyasny Asset Management Llc | Call | 625.000 | 850 | |||||
| 2026-02-17 | 13F | Balyasny Asset Management Llc | Put | 1.257.500 | 0,00 | 1.710 | -25,68 | |||
| 2026-02-12 | 13F | Ankerstar Wealth, LLC | 18 | 0 | ||||||
| 2026-02-10 | 13F | Intech Investment Management Llc | 151.113 | -39,08 | 206 | -54,75 | ||||
| 2026-02-02 | 13F | Principal Financial Group Inc | 1.882.712 | -1,07 | 2.560 | -26,48 | ||||
| 2026-02-17 | 13F | Mercer Global Advisors Inc /adv | 40.279 | -17,08 | 55 | -38,64 | ||||
| 2026-04-28 | 13F | DGS Capital Management, LLC | 17.011 | 25 | ||||||
| 2026-04-30 | 13F | Teacher Retirement System Of Texas | 0 | -100,00 | 0 | |||||
| 2026-04-29 | 13F | Police & Firemen's Retirement System of New Jersey | 100.430 | 0,00 | 146 | 6,62 | ||||
| 2026-02-02 | 13F | CM Management, LLC | 800.000 | 0,00 | 1.088 | -25,68 | ||||
| 2026-02-17 | 13F | Sig Brokerage, Lp | 0 | -100,00 | 0 | |||||
| 2026-04-21 | 13F | Pallas Capital Advisors LLC | 37.695 | 112,47 | 55 | 125,00 | ||||
| 2026-04-24 | 13F | Root Financial Partners, LLC | 1.629 | 2 | ||||||
| 2026-02-05 | 13F | Allworth Financial LP | 4.610 | 419,73 | 6 | 500,00 | ||||
| 2026-02-18 | 13F | Mackenzie Financial Corp | 22.695 | -66,50 | 30 | -75,61 | ||||
| 2026-03-03 | 13F/A | Integrated Investment Consultants, LLC | 79.191 | -0,05 | 108 | -25,69 | ||||
| 2026-04-24 | 13F | Ninety One UK Ltd | 0 | -100,00 | 0 | |||||
| 2026-02-17 | 13F | Price T Rowe Associates Inc /md/ | 294.020 | 7,39 | 0 | |||||
| 2026-02-18 | 13F | State of Tennessee, Treasury Department | 88.736 | -54,02 | 115 | -67,42 | ||||
| 2026-02-17 | 13F | Cooper Creek Partners Management Llc | 2.638.059 | 0,00 | 4 | -25,00 | ||||
| 2026-04-06 | 13F | GAMMA Investing LLC | 26.320 | 1.330,43 | 38 | 1.800,00 | ||||
| 2026-01-29 | 13F | IMC-Chicago, LLC | 0 | -100,00 | 0 | -100,00 | ||||
| 2026-05-01 | 13F | Commonwealth Of Pennsylvania Public School Empls Retrmt Sys | 97.653 | -0,11 | 142 | 6,82 | ||||
| 2026-04-21 | 13F | Gilpin Wealth Management, Llc | 0 | -100,00 | 0 | |||||
| 2026-04-28 | 13F | Harbor Capital Advisors, Inc. | 113.553 | 4.297,87 | 0 | |||||
| 2026-02-13 | 13F | Umb Bank N A/mo | 1.320 | 560,00 | 2 | |||||
| 2026-02-17 | 13F | Graham Capital Management, L.P. | 4.451.200 | 6.054 | ||||||
| 2026-02-11 | 13F | Vermillion Wealth Management, Inc. | 0 | -100,00 | 0 | |||||
| 2026-02-17 | 13F | Aqr Capital Management Llc | 1.649.059 | 6,02 | 2.243 | -21,22 | ||||
| 2026-02-11 | 13F | Group One Trading, L.p. | Call | 443.700 | 45,14 | 603 | 7,87 | |||
| 2026-02-11 | 13F | Group One Trading, L.p. | Put | 625.100 | -63,13 | 850 | -72,60 | |||
| 2026-02-17 | 13F | Tower Research Capital LLC (TRC) | 56.614 | 113,39 | 77 | 58,33 | ||||
| 2026-02-11 | 13F | Group One Trading, L.p. | 197.991 | -72,43 | 269 | -79,53 | ||||
| 2026-02-13 | 13F | Great West Life Assurance Co /can/ | 318.666 | -17,13 | 0 | |||||
| 2026-02-13 | 13F | SRS Capital Advisors, Inc. | 0 | -100,00 | 0 | |||||
| 2026-04-01 | 13F | Helen Stephens Group, LLC | 43.534 | 0,00 | 63 | 6,78 | ||||
| 2026-02-13 | 13F | Quarry LP | 1.464 | 39,69 | 2 | 0,00 | ||||
| 2026-02-17 | 13F | Point72 Asset Management, L.P. | Call | 100.000 | 0,00 | 136 | -25,68 | |||
| 2026-02-10 | 13F | Quantbot Technologies LP | 51.841 | 114,14 | 71 | 59,09 | ||||
| 2026-02-11 | 13F | Franklin Resources Inc | 498.646 | 107,03 | 678 | 54,09 | ||||
| 2026-02-12 | 13F | State Board Of Administration Of Florida Retirement System | 104.238 | 0,00 | 142 | -25,79 | ||||
| 2026-04-22 | 13F | Sterling Capital Management LLC | 9.679 | -40,91 | 14 | -36,36 | ||||
| 2026-04-23 | 13F | Farmers & Merchants Investments Inc | 237 | 0,00 | 0 | |||||
| 2026-04-13 | 13F | IFP Advisors, Inc | 690 | 51,65 | 1 | |||||
| 2025-11-21 | 13F/A | CIBC Bancorp USA Inc. | 38.673 | 71 | ||||||
| 2026-02-10 | 13F | Mutual Of America Capital Management Llc | 45.133 | 2,13 | 61 | -23,75 | ||||
| 2026-02-13 | 13F | Bank Of Nova Scotia | 0 | -100,00 | 0 | |||||
| 2026-02-06 | 13F | Prescott Group Capital Management, L.l.c. | 2.954.897 | 766,58 | 4.019 | 543,91 | ||||
| 2026-04-22 | 13F | Pictet Asset Management Holding SA | 0 | -100,00 | 0 | -100,00 | ||||
| 2026-02-12 | 13F | Commonwealth Equity Services, Llc | 67.000 | -0,04 | 91 | |||||
| 2026-02-13 | 13F | Mariner, LLC | 36.008 | -51,67 | 49 | -64,71 | ||||
| 2026-02-09 | 13F | Geode Capital Management, Llc | 9.273.047 | 2,18 | 12.614 | -24,06 | ||||
| 2026-05-01 | 13F | Arizona State Retirement System | 0 | -100,00 | 0 | |||||
| 2025-11-14 | 13F | Man Group plc | 0 | -100,00 | 0 | -100,00 | ||||
| 2026-02-17 | 13F | Glenmede Trust Co Na | 23.327 | 130,73 | 32 | 10,71 | ||||
| 2026-02-17 | 13F | Janus Henderson Group Plc | 161.972 | 0,00 | 221 | -25,59 | ||||
| 2026-02-17 | 13F | Maryland State Retirement & Pension System | 56.504 | 0,00 | 77 | -26,21 | ||||
| 2026-02-17 | 13F | Captrust Financial Advisors | 69.833 | 29,00 | 95 | -5,05 | ||||
| 2026-02-05 | 13F | Amalgamated Bank | 116.875 | 2,42 | 0 |
Other Listings
| DE:19S | 1,56 € |