Grundlæggende statistik
| Institutionelle ejere | 240 total, 240 long only, 0 short only, 0 long/short - change of 3,88% MRQ |
| Gennemsnitlig porteføljeallokering | 0.1686 % - change of -7,05% MRQ |
| Institutionelle aktier (lange) | 13.114.524 (ex 13D/G) - change of -1,41MM shares -9,70% MRQ |
| Institutionel værdi (lang) | $ 1.084.498 USD ($1000) |
Institutionelt ejerskab og aktionærer
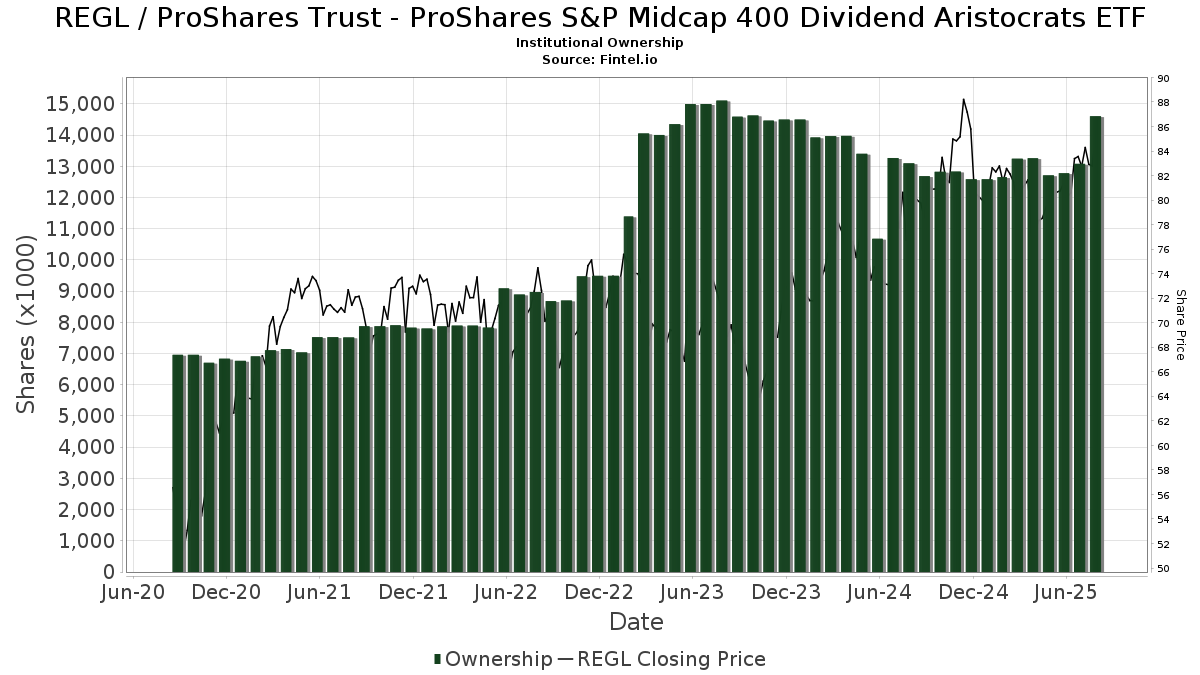
ProShares Trust - ProShares S&P Midcap 400 Dividend Aristocrats ETF (US:REGL) har 240 institutionelle ejere og aktionærer, der har indsendt 13D/G- eller 13F-formularer til Securities Exchange Commission (SEC). Disse institutioner har i alt 13,114,524 aktier. Største aktionærer omfatter Morgan Stanley, Coldstream Capital Management Inc, LPL Financial LLC, Raymond James Financial Inc, Northwestern Mutual Wealth Management Co, Bank Of America Corp /de/, Stifel Financial Corp, Benjamin Edwards Inc, Wells Fargo & Company/mn, and Baird Financial Group, Inc. .
ProShares Trust - ProShares S&P Midcap 400 Dividend Aristocrats ETF (BATS:REGL) institutionel ejerskabsstruktur viser aktuelle positioner i virksomheden efter institutioner og fonde, samt seneste ændringer i positionsstørrelse. Større aktionærer kan omfatte individuelle investorer, investeringsforeninger, hedgefonde eller institutioner. Skema 13D angiver, at investoren besidder (eller besidder) mere end 5 % af virksomheden og har til hensigt (eller har til hensigt at) aktivt at forfølge en ændring i forretningsstrategi. Skema 13G indikerer en passiv investering på over 5%.
The share price as of March 6, 2026 is 88,68 / share. Previously, on March 10, 2025, the share price was 80,74 / share. This represents an increase of 9,83% over that period.
Fondens stemningsscore
Fund Sentiment Score (fka Ownership Accumulation Score) finder de aktier, der bliver mest købt af fonde. Det er resultatet af en sofistikeret, multi-faktor kvantitativ model, der identificerer virksomheder med de højeste niveauer af institutionel akkumulering. Scoringsmodellen bruger en kombination af den samlede stigning i oplyste ejere, ændringerne i porteføljeallokeringer i disse ejere og andre målinger. Tallet går fra 0 til 100, hvor højere tal indikerer et højere niveau af akkumulering for sine jævnaldrende, og 50 er gennemsnittet.
Opdateringsfrekvens: Dagligt
Se Ownership Explorer, som giver en liste over højest rangerende virksomheder.
AI+ Ask Fintel’s AI assistant about ProShares Trust - ProShares S&P Midcap 400 Dividend Aristocrats ETF.
Select a question to share a public post with an AI-crafted answer.
Thinking of good questions…
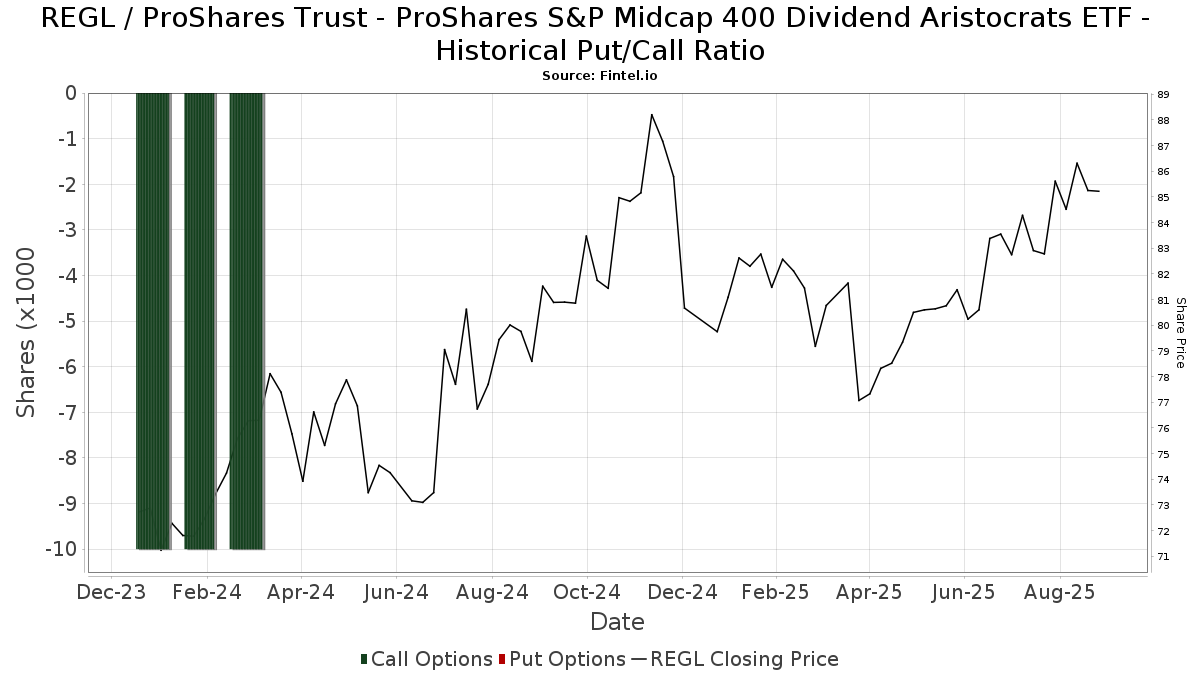
Institutionel Put/Call-forhold
Ud over at indberette standardaktie- og gældsudstedelser skal institutter med mere end 100 mill. aktiver under forvaltning også oplyse deres put- og call-optionsbeholdninger. Da salgsoptioner generelt indikerer negativ stemning, og købsoptioner indikerer positiv stemning, kan vi få en fornemmelse af den overordnede institutionelle stemning ved at plotte forholdet mellem put og kald. Diagrammet til højre viser det historiske put/call-forhold for dette instrument.
Brug af Put/Call Ratio som en indikator for investorernes stemning overvinder en af de vigtigste mangler ved at bruge totalt institutionelt ejerskab, som er, at en betydelig mængde af aktiver under forvaltning investeres passivt for at spore indekser. Passivt forvaltede fonde køber typisk ikke optioner, så indikatoren for put/call-forholdet følger mere nøje følelsen af aktivt forvaltede fonde.
13F og NPORT arkivering
Detaljer om 13F-arkivering er gratis. Detaljer om NP-ansøgninger kræver et premium-medlemskab. Grønne rækker angiver nye positioner. Røde rækker angiver lukkede positioner. Klik på linket ikon for at se den fulde transaktionshistorik.
Opgrader
for at låse premium-data op og eksportere til Excel ![]() .
.
| Fil dato | Kilde | Investor | Type | Gennemsnitlig pris (Øst) |
Aktier | Δ Aktier (%) |
Rapporteret Værdi ($1000) |
Δ Værdi (%) |
Port Alloc (%) |
|
|---|---|---|---|---|---|---|---|---|---|---|
| 2026-01-21 | 13F | Hartford Financial Management Inc. | 4.000 | 0,00 | 337 | -1,47 | ||||
| 2026-02-06 | 13F | Cascade Financial Partners, LLC | 54.765 | 5,62 | 4.612 | 4,23 | ||||
| 2026-01-07 | 13F | Harbor Investment Advisory, Llc | 4.440 | 0,00 | 374 | -1,32 | ||||
| 2026-02-04 | 13F | Dogwood Wealth Management LLC | 90.615 | 22,54 | 7.632 | 20,94 | ||||
| 2025-11-12 | 13F | Accredited Wealth Management, LLC | 565 | 1.030,00 | 4 | 0,00 | ||||
| 2026-02-06 | 13F | Pathway Financial Advisers, LLC | 5.182 | -0,12 | 436 | -1,13 | ||||
| 2026-02-17 | 13F | Core Wealth Advisors, Inc. | 14.655 | 15,48 | 1.234 | 13,94 | ||||
| 2026-01-30 | 13F | Financial Services Advisory Inc | 24.237 | -1,76 | 2.041 | -3,04 | ||||
| 2026-01-14 | 13F | Quad-Cities Investment Group, LLC | 13.884 | 7,20 | 1.169 | 5,79 | ||||
| 2026-02-24 | 13F | MidFirst Bank | 222 | 19 | ||||||
| 2026-01-28 | 13F | Chicago Partners Investment Group LLC | 3.200 | 0,00 | 282 | 6,02 | ||||
| 2026-02-12 | 13F | Wedbush Securities Inc | 15.390 | -5,16 | 1 | 0,00 | ||||
| 2026-02-02 | 13F | CENTRAL TRUST Co | 222 | 0,00 | 19 | 0,00 | ||||
| 2026-01-30 | 13F | Sigma Planning Corp | 0 | -100,00 | 0 | |||||
| 2026-01-23 | 13F | Meridian Financial, LLC | 2.631 | 0,15 | 222 | -1,34 | ||||
| 2026-01-23 | 13F | PMG Wealth Management, Inc. | 24.681 | 4,31 | 2.079 | 3,18 | ||||
| 2026-02-14 | 13F | Silver Grove Financial Group, Inc. | 4.211 | 0,21 | 355 | -1,12 | ||||
| 2026-02-06 | 13F | Larson Financial Group LLC | 842 | 0,00 | 71 | -1,41 | ||||
| 2026-02-12 | 13F | IFC & Insurance Marketing, Inc. | 44 | 0 | ||||||
| 2026-01-23 | 13F | Clear Creek Financial Management, LLC | 24.011 | -10,83 | 2.022 | -11,97 | ||||
| 2026-02-23 | 13F | Virtu Financial LLC | 6.605 | 1 | ||||||
| 2026-01-13 | 13F | CoreCap Advisors, LLC | 90 | 0,00 | 8 | 0,00 | ||||
| 2026-02-10 | 13F | IFG Advisory, LLC | 0 | -100,00 | 0 | |||||
| 2026-01-26 | 13F | United Advisor Group, LLC | 38.418 | -19,26 | 3.236 | -20,32 | ||||
| 2026-02-05 | 13F | Cambridge Investment Research Advisors, Inc. | 78.068 | -0,59 | 7 | 0,00 | ||||
| 2026-01-09 | 13F | Atlas Brown,Inc. | 14.852 | -8,15 | 1.251 | -9,35 | ||||
| 2026-01-16 | 13F | Empirical Financial Services, LLC d.b.a. Empirical Wealth Management | 2.571 | -31,93 | 217 | -32,92 | ||||
| 2026-02-17 | 13F | Citadel Advisors Llc | Call | 0 | -100,00 | 0 | ||||
| 2026-02-02 | 13F | Truist Financial Corp | 42.481 | -24,19 | 3.602 | -24,70 | ||||
| 2026-01-27 | 13F | PFG Advisors | 7.261 | -0,56 | 612 | -1,93 | ||||
| 2026-02-26 | 13F | Anchor Investment Management, LLC | 3.303 | 0,00 | 278 | -1,07 | ||||
| 2025-10-21 | 13F | Western Pacific Wealth Management, LP | 0 | -100,00 | 0 | |||||
| 2026-01-26 | 13F | Main Street Group, LTD | 0 | -100,00 | 0 | |||||
| 2026-01-14 | 13F | Clarus Wealth Advisors | 8.363 | 22,48 | 729 | 24,44 | ||||
| 2026-02-02 | 13F | KPP Advisory Services LLC | 4.310 | -3,36 | 363 | -4,47 | ||||
| 2026-02-11 | 13F | Janney Montgomery Scott LLC | 64.896 | 3,40 | 5 | 0,00 | ||||
| 2025-10-24 | 13F | Swmg, Llc | 0 | -100,00 | 0 | |||||
| 2026-02-17 | 13F | Aqr Capital Management Llc | 4.314 | 37,43 | 363 | 35,96 | ||||
| 2026-01-30 | 13F | Pure Portfolios Holdings Llc | 5.126 | 0,35 | 432 | -0,92 | ||||
| 2026-01-26 | 13F | Asset Dedication, LLC | 450 | 0,00 | 38 | -2,63 | ||||
| 2026-02-13 | 13F | Kestra Advisory Services, LLC | 0 | -100,00 | 0 | |||||
| 2026-01-06 | 13F | Martin Capital Partners, LLC | 3.430 | -2,42 | 0 | |||||
| 2026-02-06 | 13F | Global Retirement Partners, LLC | 1.439 | -0,96 | 121 | -1,63 | ||||
| 2026-02-11 | 13F | LPL Financial LLC | 704.149 | -5,22 | 59.303 | -6,47 | ||||
| 2026-01-23 | 13F | Smith, Moore & Co. | 76.296 | -2,13 | 6.426 | -3,41 | ||||
| 2026-02-17 | 13F | Qube Research & Technologies Ltd | 647 | -9,00 | 54 | -10,00 | ||||
| 2025-10-28 | 13F | BRYN MAWR TRUST Co | 0 | -100,00 | 0 | |||||
| 2026-02-13 | 13F | Avant Capital LLC | 44.950 | -1,38 | 3.786 | -2,67 | ||||
| 2026-01-26 | 13F | Cwm, Llc | 1.757 | 0,46 | 0 | |||||
| 2026-01-21 | 13F | Wealthbridge Capital Management, Llc | 4.114 | -30,25 | 346 | -31,21 | ||||
| 2026-02-10 | 13F | Goldman Sachs Group Inc | 3.728 | -1,22 | 314 | -2,80 | ||||
| 2026-02-12 | 13F | BlackRock, Inc. | 144 | 0,00 | 12 | 0,00 | ||||
| 2026-02-04 | 13F | Pensionmark Financial Group, Llc | 45.917 | 2,04 | 3.867 | 0,70 | ||||
| 2026-02-10 | 13F | Thoroughbred Financial Services, Llc | 2.503 | -1,46 | 0 | |||||
| 2026-01-23 | 13F | Assetmark, Inc | 191 | -61,02 | 16 | -60,98 | ||||
| 2026-01-06 | 13F | RDA Financial Network | 6.826 | 6,61 | 575 | 5,13 | ||||
| 2026-02-12 | 13F | Hollencrest Capital Management | 17.609 | 0,71 | 1.483 | -0,60 | ||||
| 2026-02-17 | 13F | Bank Of America Corp /de/ | 525.092 | -1,67 | 44.223 | -2,96 | ||||
| 2026-01-05 | 13F | Confluence Investment Management Llc | 136.371 | -49,41 | 11.485 | -50,07 | ||||
| 2026-01-28 | 13F | Retirement Planning Co of New England, Inc. | 5.018 | -2,90 | 423 | -4,31 | ||||
| 2026-02-02 | 13F | Essex Savings Bank | 3.976 | -9,14 | 335 | -10,46 | ||||
| 2026-02-12 | 13F | Commonwealth Equity Services, Llc | 176.499 | -28,65 | 14.865 | 70.680,95 | ||||
| 2026-01-22 | 13F | Bfsg, Llc | 351 | 0,00 | 30 | 0,00 | ||||
| 2026-02-13 | 13F | Aptus Capital Advisors, LLC | 4.156 | 0,73 | 350 | -0,57 | ||||
| 2026-02-06 | 13F | Pnc Financial Services Group, Inc. | 8.881 | 52,78 | 748 | 50,60 | ||||
| 2026-02-13 | 13F | Fortis Capital Management LLC | 2.566 | 216 | ||||||
| 2026-02-17 | 13F | Cape Investment Advisory, Inc. | 216 | -4,42 | 18 | -5,26 | ||||
| 2026-02-09 | 13F | Harbour Investments, Inc. | 34.308 | 0,46 | 2.889 | -0,86 | ||||
| 2026-02-11 | 13F | Vermillion Wealth Management, Inc. | 261 | 0,00 | 22 | -4,55 | ||||
| 2026-02-02 | 13F | Mission Hills Financial Advisory, LLC | 2.472 | 208 | ||||||
| 2026-01-29 | 13F | UBS Group AG | 264.346 | -27,69 | 22.263 | -28,63 | ||||
| 2026-02-13 | 13F | Intrepid Financial Planning Group LLC | 14.047 | 3,20 | 1.183 | 1,89 | ||||
| 2025-11-06 | 13F | Atria Investments Llc | 0 | -100,00 | 0 | |||||
| 2026-02-09 | 13F | Coldstream Capital Management Inc | 2.100.534 | -6,90 | 176.907 | -8,12 | ||||
| 2026-02-04 | 13F | Ameritas Advisory Services, LLC | 20.398 | -3,28 | 1.718 | -4,56 | ||||
| 2026-03-04 | 13F | SHP Wealth Management | 611 | 51 | ||||||
| 2026-02-06 | 13F | HighTower Advisors, LLC | 23.339 | -0,28 | 1.966 | -1,60 | ||||
| 2026-01-27 | 13F | TD Waterhouse Canada Inc. | 380 | 0,00 | 32 | 0,00 | ||||
| 2026-01-21 | 13F | Country Trust Bank | 130 | 0,00 | 11 | -9,09 | ||||
| 2026-01-16 | 13F | Tempus Wealth Planning, LLC | 11.184 | -3,86 | 942 | -5,14 | ||||
| 2026-02-13 | 13F | Pathstone Holdings, LLC | 72.739 | 0,00 | 6.126 | -1,30 | ||||
| 2026-01-27 | 13F | Keystone Financial Services, LLC | 4.553 | 2,82 | 383 | 1,59 | ||||
| 2026-02-17 | 13F | Blair William & Co/il | 8.271 | 204,42 | 697 | 201,30 | ||||
| 2026-02-10 | 13F | Verus Capital Partners, Llc | 22.147 | 1,10 | 1.865 | -0,21 | ||||
| 2026-01-23 | 13F | Aspect Partners, LLC | 468 | 0,65 | 39 | 0,00 | ||||
| 2026-01-27 | 13F | Jackson, Grant Investment Advisers, Inc. | 10.149 | 0,18 | 855 | -1,16 | ||||
| 2026-01-13 | 13F | Well Done, LLC | 4.194 | 0,00 | 353 | -1,12 | ||||
| 2026-01-21 | 13F | Flagship Harbor Advisors, Llc | 4.827 | -5,87 | 407 | -7,09 | ||||
| 2026-02-13 | 13F | QTR Family Wealth, LLC | 2.785 | -2,14 | 259 | 6,61 | ||||
| 2026-01-30 | 13F | Caldwell Securities, Inc | 3.479 | 0,23 | 293 | -1,01 | ||||
| 2026-02-12 | 13F | Great Valley Advisor Group, Inc. | 6.732 | 0,07 | 567 | -1,39 | ||||
| 2026-02-12 | 13F | Steward Partners Investment Advisory, Llc | 5.264 | 2,11 | 443 | 0,91 | ||||
| 2026-02-13 | 13F | Stifel Financial Corp | 485.483 | -44,50 | 40.888 | -45,23 | ||||
| 2026-01-28 | 13F | Geneos Wealth Management Inc. | 6.866 | -0,16 | 578 | -1,37 | ||||
| 2026-02-04 | 13F | Atlantic Union Bankshares Corp | 1.005 | 0,00 | 85 | -1,18 | ||||
| 2026-02-17 | 13F | Russell Investments Group, Ltd. | 817 | 0,00 | 69 | -1,45 | ||||
| 2026-02-10 | 13F | Envestnet Asset Management Inc | 135.483 | -3,61 | 11.410 | -4,88 | ||||
| 2026-02-13 | 13F | Foresight Global Investors, Inc. | 0 | -100,00 | 0 | |||||
| 2026-02-09 | 13F | Hartland & Co., LLC | 1.350 | 0,00 | 114 | -1,74 | ||||
| 2025-11-04 | 13F | L.m. Kohn & Company | 10.339 | 20,37 | 882 | 26,00 | ||||
| 2026-02-13 | 13F | Mlp3, Llc | 16.559 | 1.395 | ||||||
| 2026-02-17 | 13F | Tower Research Capital LLC (TRC) | 2.917 | 38,38 | 246 | 36,87 | ||||
| 2026-01-29 | 13F | Comerica Bank | 7.032 | -50,11 | 592 | -50,75 | ||||
| 2026-02-12 | 13F | CIBC Private Wealth Group, LLC | 328 | 0,00 | 28 | 0,00 | ||||
| 2026-02-06 | 13F | Copia Wealth Management | 167 | 0,00 | 14 | 0,00 | ||||
| 2026-02-17 | 13F | Royal Bank Of Canada | 288.903 | -1,83 | 24.332 | -3,12 | ||||
| 2026-02-14 | 13F | Howe & Rusling Inc | 1.840 | 2,97 | 155 | 1,32 | ||||
| 2026-02-17 | 13F | Raymond James Financial Inc | 701.556 | 3,87 | 59.085 | 2,51 | ||||
| 2026-01-09 | 13F | Dynamic Advisor Solutions LLC | 25.591 | -14,21 | 2.155 | -15,32 | ||||
| 2026-02-17 | 13F | Signature Equity Partners, LLC | 195 | 16 | ||||||
| 2026-02-05 | 13F | Allworth Financial LP | 0 | -100,00 | 0 | |||||
| 2026-01-14 | 13F | Nova Wealth Management, Inc. | 7.495 | 10,30 | 631 | 8,98 | ||||
| 2026-01-21 | 13F | Sound Income Strategies, LLC | 157 | 14 | ||||||
| 2026-02-05 | 13F | Bessemer Group Inc | 3.175 | -49,79 | 0 | |||||
| 2026-02-12 | 13F | Connecticut Wealth Management, LLC | 0 | -100,00 | 0 | |||||
| 2025-10-24 | 13F | MorganRosel Wealth Management, LLC | 0 | -100,00 | 0 | |||||
| 2025-12-15 | 13F | FNY Investment Advisers, LLC | 0 | -100,00 | 0 | |||||
| 2026-01-20 | 13F | Sovran Advisors, LLC | 2.269 | 202 | ||||||
| 2026-02-13 | 13F | Biondo Investment Advisors, LLC | 25.160 | 4,41 | 2.119 | 3,02 | ||||
| 2026-02-17 | 13F | Citadel Advisors Llc | 10.497 | -45,39 | 884 | -46,10 | ||||
| 2026-02-13 | 13F | Mariner, LLC | 5.734 | -81,79 | 483 | -82,06 | ||||
| 2026-01-14 | 13F | Spire Wealth Management | 1.159 | 0,78 | 98 | -1,02 | ||||
| 2026-01-22 | 13F | Pinnacle Bancorp, Inc. | 100 | 0,00 | 8 | 0,00 | ||||
| 2026-02-13 | 13F | Jacobi Capital Management LLC | 57.393 | -0,30 | 4.834 | -1,61 | ||||
| 2026-02-17 | 13F | Two Sigma Securities, Llc | 0 | -100,00 | 0 | |||||
| 2026-01-20 | 13F | Toth Financial Advisory Corp | 227.898 | 4,97 | 19.194 | 3,59 | ||||
| 2026-02-17 | 13F | IHT Wealth Management, LLC | 3.160 | 0,13 | 266 | -1,12 | ||||
| 2026-01-15 | 13F | SILVER OAK SECURITIES, Inc | 56.681 | -34,97 | 4.825 | -35,14 | ||||
| 2026-01-26 | 13F | Whittier Trust Co Of Nevada Inc | 1.037 | 410,84 | 89 | 423,53 | ||||
| 2026-01-21 | 13F | Sowell Financial Services LLC | 5.272 | 0,15 | 444 | -1,34 | ||||
| 2026-02-17 | 13F | Captrust Financial Advisors | 0 | -100,00 | 0 | |||||
| 2025-11-14 | 13F | Imprint Wealth LLC | 0 | -100,00 | 0 | |||||
| 2026-02-04 | 13F | Summit Wealth Group Llc / Co | 0 | -100,00 | 0 | -100,00 | ||||
| 2026-02-11 | 13F | Montis Financial, LLC | 3.152 | -16,39 | 265 | -17,45 | ||||
| 2026-01-21 | 13F | Kraematon Investment Advisors, Inc | 11.549 | 5,26 | 973 | 3,85 | ||||
| 2026-02-02 | 13F | Benjamin Edwards Inc | 403.558 | -45,41 | 33.987 | -46,13 | ||||
| 2026-02-03 | 13F | Wesbanco Bank Inc | 5.801 | 1,27 | 489 | 0,00 | ||||
| 2025-10-30 | 13F | Twin Peaks Wealth Advisors, LLC | 0 | -100,00 | 0 | -100,00 | ||||
| 2026-02-12 | 13F | Principal Securities, Inc. | 30.017 | 10,33 | 2.528 | 8,92 | ||||
| 2026-02-05 | 13F | Rossmore Private Capital | 3.425 | 0,00 | 288 | -1,37 | ||||
| 2026-02-02 | 13F | Signature Wealth Management Partners, LLC | 6.763 | 54,97 | 570 | 52,96 | ||||
| 2026-02-11 | 13F | Nemes Rush Group LLC | 177 | 0,00 | 15 | -6,67 | ||||
| 2026-02-17 | 13F | Creative Planning | 9.065 | -3,45 | 763 | -4,74 | ||||
| 2026-02-03 | 13F | McIlrath & Eck, LLC | 180 | 15 | ||||||
| 2026-02-13 | 13F | Smartleaf Asset Management LLC | 1.027 | 0,00 | 87 | 0,00 | ||||
| 2026-01-08 | 13F | Armstrong Advisory Group, Inc | 148 | 0,00 | 12 | 0,00 | ||||
| 2026-01-30 | 13F | Chapin Davis, Inc. | 2.390 | 0,00 | 201 | -0,99 | ||||
| 2026-02-06 | 13F | Cullen/frost Bankers, Inc. | 2.838 | 0,75 | 239 | -0,83 | ||||
| 2026-02-12 | 13F | WealthPLAN Partners, LLC | 4.049 | -2,29 | 341 | -3,68 | ||||
| 2026-02-18 | 13F | Financial Advisory Service, Inc. | 99.759 | 7,54 | 8.402 | 6,13 | ||||
| 2026-01-23 | 13F | Farther Finance Advisors, LLC | 399 | 9,32 | 34 | 6,45 | ||||
| 2026-02-05 | 13F | L & S Advisors Inc | 8.378 | -1,76 | 706 | -3,03 | ||||
| 2026-02-05 | 13F | WealthPlan Investment Management, LLC | 12.173 | -35,19 | 1.025 | -36,02 | ||||
| 2026-01-28 | 13F | Key Client Fiduciary Advisors, LLC | 4.205 | 12,49 | 354 | 11,32 | ||||
| 2026-02-06 | 13F | IFP Advisors, Inc | 402 | 0,00 | 34 | -2,94 | ||||
| 2026-02-17 | 13F | Gladstone Institutional Advisory LLC | 44.833 | 4,14 | 3.776 | 2,75 | ||||
| 2025-11-04 | 13F | Flaharty Asset Management, LLC | 0 | -100,00 | 0 | |||||
| 2026-02-11 | 13F | First Command Advisory Services, Inc. | 85 | 7 | ||||||
| 2026-01-26 | 13F | Private Trust Co Na | 2.349 | 0,00 | 198 | -1,50 | ||||
| 2026-02-17 | 13F | Wiley Bros.-aintree Capital, Llc | 264.577 | 0,75 | 22.286 | -0,56 | ||||
| 2026-01-23 | 13F | DHJJ Financial Advisors, Ltd. | 798 | 0,00 | 67 | -1,47 | ||||
| 2026-01-30 | 13F | Caldwell Trust Co | 111 | 0,00 | 9 | 0,00 | ||||
| 2026-02-02 | 13F | Headinvest, Llc | 5.717 | -1,72 | 481 | -3,02 | ||||
| 2026-02-14 | 13F | Rockefeller Capital Management L.P. | 38.559 | 1,76 | 3.247 | 0,43 | ||||
| 2026-01-26 | 13F | Merit Financial Group, LLC | 38.210 | 3.218 | ||||||
| 2026-02-10 | 13F | CFS Investment Advisory Services, LLC | 7.634 | -0,81 | 643 | -0,62 | ||||
| 2026-02-12 | 13F | Wealthspire Advisors, LLC | 0 | -100,00 | 0 | |||||
| 2026-02-17 | 13F | Harvest Investment Services, LLC | 8.582 | -14,32 | 723 | -15,46 | ||||
| 2026-01-29 | 13F | Kestra Private Wealth Services, Llc | 6.685 | 1,21 | 563 | 0,00 | ||||
| 2026-02-10 | 13F | Moors & Cabot, Inc. | 3.372 | 0,00 | 284 | -1,39 | ||||
| 2026-02-17 | 13F | Mercer Global Advisors Inc /adv | 12.834 | 0,39 | 1.081 | -1,01 | ||||
| 2026-01-26 | 13F | Parcion Private Wealth LLC | 8.345 | 0,00 | 703 | -1,40 | ||||
| 2026-02-13 | 13F | Citigroup Inc | 0 | -100,00 | 0 | |||||
| 2026-02-19 | 13F | CI Private Wealth, LLC | 3.644 | 8,97 | 307 | 7,37 | ||||
| 2026-01-21 | 13F | Westfuller Advisors, LLC | 6.412 | 0,72 | 540 | -0,55 | ||||
| 2026-02-13 | 13F | Integrated Wealth Concepts LLC | 0 | -100,00 | 0 | |||||
| 2026-01-22 | 13F | Premier Path Wealth Partners, LLC | 31.580 | -3,82 | 2.660 | -5,10 | ||||
| 2026-02-17 | 13F | Ameriprise Financial Inc | 215.444 | 4,18 | 18.145 | 2,80 | ||||
| 2026-02-09 | 13F | Kingsview Wealth Management, LLC | 3.893 | -2,01 | 328 | -3,54 | ||||
| 2026-02-11 | 13F | Jpmorgan Chase & Co | 4.458 | 66,41 | 375 | 64,47 | ||||
| 2026-02-13 | 13F | Wells Fargo & Company/mn | 398.562 | -14,18 | 33.567 | -15,30 | ||||
| 2026-02-17 | 13F | Fmr Llc | 7.916 | -5,91 | 667 | -7,11 | ||||
| 2026-02-13 | 13F | MAI Capital Management | 1.364 | 10,00 | 115 | 8,57 | ||||
| 2025-10-10 | 13F | Focus Financial Network, Inc. | 0 | -100,00 | 0 | |||||
| 2026-02-09 | 13F | Key FInancial Inc | 8.739 | -1,69 | 736 | -2,78 | ||||
| 2026-02-13 | 13F | Planwiser Financial, Llc | 8.389 | 707 | ||||||
| 2026-01-28 | 13F | Mystic Asset Management, Inc. | 5.945 | 0,00 | 501 | -1,38 | ||||
| 2025-11-12 | 13F | Park Square Financial Group, LLC | 0 | -100,00 | 0 | |||||
| 2026-02-18 | 13F | GWM Advisors LLC | 18.205 | -59,00 | 1.533 | -59,54 | ||||
| 2026-02-05 | 13F | Landmark Wealth Management, LLC | 31.903 | 4,18 | 2.687 | 2,79 | ||||
| 2026-02-20 | 13F | Sunbelt Securities, Inc. | 1.370 | 0,00 | 115 | -0,86 | ||||
| 2026-01-08 | 13F | Wealth Enhancement Advisory Services, Llc | 35.123 | 67,44 | 3.026 | 69,28 | ||||
| 2026-02-17 | 13F | Warren Averett Asset Management, LLC | 5.631 | 44,35 | 474 | 42,77 | ||||
| 2026-01-21 | 13F | Capital Advisors, Ltd. LLC | 53.591 | -0,89 | 5 | 0,00 | ||||
| 2026-01-16 | 13F | Tower Wealth Partners, Inc. | 16.629 | 13,38 | 1.400 | 11,91 | ||||
| 2026-02-17 | 13F | National Asset Management, Inc. | 3.870 | -4,91 | 326 | -6,34 | ||||
| 2026-02-12 | 13F | Empire Financial Management Company, LLC | 2.502 | 0,00 | 211 | -1,41 | ||||
| 2026-02-13 | 13F | Morgan Stanley | 2.249.203 | -2,80 | 189.428 | -4,07 | ||||
| 2026-01-26 | 13F | Roman Butler Fullerton & Co | 14.203 | -0,32 | 1.265 | 8,30 | ||||
| 2026-02-03 | 13F | NewEdge Wealth, LLC | 6.150 | 0,00 | 518 | 2,38 | ||||
| 2026-01-30 | 13F | Urban Wealth Management, LLC | 0 | -100,00 | 0 | -100,00 | ||||
| 2026-02-13 | 13F | Cozad Asset Management Inc | 11.762 | -2,24 | 991 | -3,51 | ||||
| 2026-01-23 | 13F | Patten Group, Inc. | 4.097 | -14,54 | 345 | -15,65 | ||||
| 2026-02-18 | 13F | EP Wealth Advisors, Inc. | 0 | -100,00 | 0 | |||||
| 2026-01-30 | 13F | Us Bancorp \de\ | 4.063 | 0,00 | 342 | -1,16 | ||||
| 2026-02-03 | 13F | Centerpoint Advisory Group | 2.998 | 0,00 | 252 | -1,18 | ||||
| 2026-01-27 | 13F | Ticino Wealth | 5.829 | 491 | ||||||
| 2026-02-17 | 13F | Advisor Group Holdings, Inc. | 119.366 | -0,19 | 10.074 | -1,43 | ||||
| 2026-02-11 | 13F | O'shaughnessy Asset Management, Llc | 7.969 | 91,79 | 671 | 89,55 | ||||
| 2026-03-03 | 13F | WMS Group LLC | 4.000 | 337 | ||||||
| 2026-02-10 | 13F | Bank of New York Mellon Corp | 0 | -100,00 | 0 | |||||
| 2025-10-28 | 13F | Live Oak Investment Partners | 47.859 | 3.194 | 0,54 | |||||
| 2026-02-10 | 13F/A | Northwestern Mutual Wealth Management Co | 575.895 | 2,81 | 48.502 | 1,46 | ||||
| 2026-02-12 | 13F | Azimuth Capital Investment Management LLC | 2.650 | 0,00 | 223 | -1,33 | ||||
| 2026-02-13 | 13F | Ubs Asset Management Americas Inc | 154 | 13 | ||||||
| 2026-02-13 | 13F | Baird Financial Group, Inc. | 297.298 | 2,83 | 25.038 | 1,48 | ||||
| 2026-01-22 | 13F | tru Independence LLC | 5.846 | -7,73 | 492 | -8,89 | ||||
| 2026-02-02 | 13F | Oppenheimer & Co Inc | 4.819 | -3,54 | 406 | -4,93 | ||||
| 2026-02-12 | 13F | Colonial Trust Co / SC | 2.500 | 0,00 | 211 | -1,41 | ||||
| 2026-02-11 | 13F | J.w. Cole Advisors, Inc. | 9.156 | -15,16 | 723 | -21,41 | ||||
| 2026-02-13 | 13F | Mml Investors Services, Llc | 16.603 | 17,10 | 1.398 | 15,63 | ||||
| 2026-02-17 | 13F | Royal Capital Wealth Management, LLC | 16.630 | -0,06 | 1.401 | -1,41 | ||||
| 2026-02-17 | 13F | Susquehanna International Group, Llp | 19.527 | 533,79 | 1.645 | 527,48 | ||||
| 2026-01-07 | 13F | Cyndeo Wealth Partners, LLC | 4.416 | 0,16 | 372 | -1,33 | ||||
| 2026-02-05 | 13F | Pinnacle Associates Ltd | 37.727 | -17,74 | 3.177 | -18,81 | ||||
| 2026-02-03 | 13F | International Assets Investment Management, Llc | 1.392 | 117 | ||||||
| 2026-02-10 | 13F | Acorn Wealth Advisors, LLC | 5.169 | -29,50 | 435 | -30,40 | ||||
| 2026-01-26 | 13F | Heritage Wealth Management, Inc. | 6.283 | -6,70 | 529 | -7,84 | ||||
| 2026-02-05 | 13F | Duncan Williams Asset Management, LLC | 2.939 | 269 | ||||||
| 2026-02-06 | 13F | GPS Wealth Strategies Group, LLC | 1.435 | -51,50 | 121 | -52,38 | ||||
| 2026-02-13 | 13F | Visionary Wealth Advisors | 30.813 | -59,07 | 2.595 | -59,60 | ||||
| 2026-02-13 | 13F | Ausdal Financial Partners, Inc. | 3.365 | -24,48 | 283 | -25,53 | ||||
| 2026-02-13 | 13F | Perspective Wealth Advisors Llc | 8.389 | 707 | ||||||
| 2026-01-26 | 13F | Nations Financial Group Inc, /ia/ /adv | 14.053 | 5,90 | 1.184 | 4,51 | ||||
| 2026-02-17 | 13F | Jones Financial Companies Lllp | 78.803 | 12,20 | 6.637 | 11,06 | ||||
| 2026-01-29 | 13F | S.A. Mason LLC | 5.759 | -0,52 | 485 | -1,82 | ||||
| 2026-02-17 | 13F | Ancora Advisors, LLC | 400 | 0,00 | 34 | -2,94 | ||||
| 2026-02-17 | 13F | Two Sigma Investments, Lp | 49.500 | 4.169 | ||||||
| 2025-11-10 | 13F | Dana Investment Advisors, Inc. | 0 | -100,00 | 0 | -100,00 | ||||
| 2026-01-23 | 13F | Kerntke Otto McGlone Wealth Management Group | 40.371 | 1,87 | 3.400 | 0,56 | ||||
| 2026-02-02 | 13F | LMG Wealth Partners, LLC | 39.246 | 1,90 | 3.305 | 0,58 | ||||
| 2026-02-10 | 13F | Essex Financial Services, Inc. | 39.442 | -10,81 | 3.322 | -11,98 | ||||
| 2026-01-13 | 13F | Capital Investment Advisors, LLC | 9.694 | 0,73 | 816 | -0,61 | ||||
| 2026-01-05 | 13F | GAMMA Investing LLC | 2.025 | 171 | ||||||
| 2026-02-10 | 13F | American Money Management, LLC | 3.326 | -0,75 | 280 | -1,75 | ||||
| 2026-02-11 | 13F | Sunrise Financial Services, LLC | 270 | 23 | ||||||
| 2026-02-12 | 13F | Jane Street Group, Llc | 0 | -100,00 | 0 | |||||
| 2026-02-03 | 13F | Coston, McIsaac & Partners | 7 | 0,00 | 0 | |||||
| 2026-02-04 | 13F | BEAM Asset Management, LLC | 0 | -100,00 | 0 | |||||
| 2026-02-09 | 13F | MSH Capital Advisors LLC | 12.529 | 1,76 | 1.055 | 0,48 | ||||
| 2026-02-09 | 13F | Prospera Financial Services Inc | 5.228 | 0,08 | 441 | -1,12 | ||||
| 2026-02-11 | 13F | Gilpin Wealth Management, Llc | 3.520 | 296 | ||||||
| 2026-02-04 | 13F | Anson Capital, Inc. | 10.581 | 40,72 | 891 | 39,00 | ||||
| 2026-01-05 | 13F | Rosenberg Matthew Hamilton | 192 | -56,95 | 16 | -57,89 | ||||
| 2026-02-17 | 13F | Advisory Services Network, LLC | 2.631 | 0,00 | 222 | -1,34 | ||||
| 2026-01-26 | 13F | PFG Investments, LLC | 21.291 | -0,28 | 1.793 | -1,59 | ||||
| 2026-01-27 | 13F | Summit Wealth Partners, LLC | 34.472 | -6,67 | 2.903 | -7,87 | ||||
| 2026-01-12 | 13F | DAVENPORT & Co LLC | 4.907 | -2,21 | 413 | -3,50 | ||||
| 2026-01-14 | 13F | Redhawk Wealth Advisors, Inc. | 5.970 | 1,50 | 503 | 0,20 | ||||
| 2026-01-27 | 13F | TriaGen Wealth Management LLC | 4.165 | 0,00 | 351 | -1,41 | ||||
| 2026-02-09 | 13F | Huntington National Bank | 272 | -1,45 | ||||||
| 2026-02-17 | 13F | Equitable Holdings, Inc. | 4.610 | -17,34 | 388 | -18,32 | ||||
| 2026-02-18 | 13F | Garton & Associates Financial Advisors LLC | 595 | 50 | ||||||
| 2026-02-17 | 13F | Cetera Investment Advisers | 38.534 | -56,12 | 3.245 | -56,70 | ||||
| 2026-02-17 | 13F | Private Advisor Group, LLC | 17.166 | -4,28 | 1.446 | -5,56 | ||||
| 2026-01-20 | 13F | Savvy Advisors, Inc. | 3.378 | 284 | ||||||
| 2026-01-26 | 13F | Northwest Financial Advisors | 8.819 | -11,26 | 743 | -12,50 | ||||
| 2026-01-27 | 13F | WealthCollab, LLC | 100 | 8 | ||||||
| 2026-01-29 | 13F | Sanctuary Advisors, LLC | 46.878 | -0,18 | 3.948 | -1,47 | ||||
| 2026-02-10 | 13F | Root Financial Partners, LLC | 54 | 0,00 | 5 | 0,00 | ||||
| 2026-02-17 | 13F | Modern Wealth Management, LLC | 96.194 | 24,59 | 8.101 | 22,97 | ||||
| 2025-11-12 | 13F | Integrated Advisors Network LLC | 0 | -100,00 | 0 | |||||
| 2026-02-09 | 13F | PSI Advisors, LLC | 5.026 | 0,00 | 423 | -1,17 |