Grundlæggende statistik
| Institutionelle ejere | 269 total, 264 long only, 0 short only, 5 long/short - change of 20,72% MRQ |
| Gennemsnitlig porteføljeallokering | 0.3096 % - change of 15,66% MRQ |
| Institutionelle aktier (lange) | 12.926.968 (ex 13D/G) - change of 3,47MM shares 36,88% MRQ |
| Institutionel værdi (lang) | $ 669.264 USD ($1000) |
Institutionelt ejerskab og aktionærer
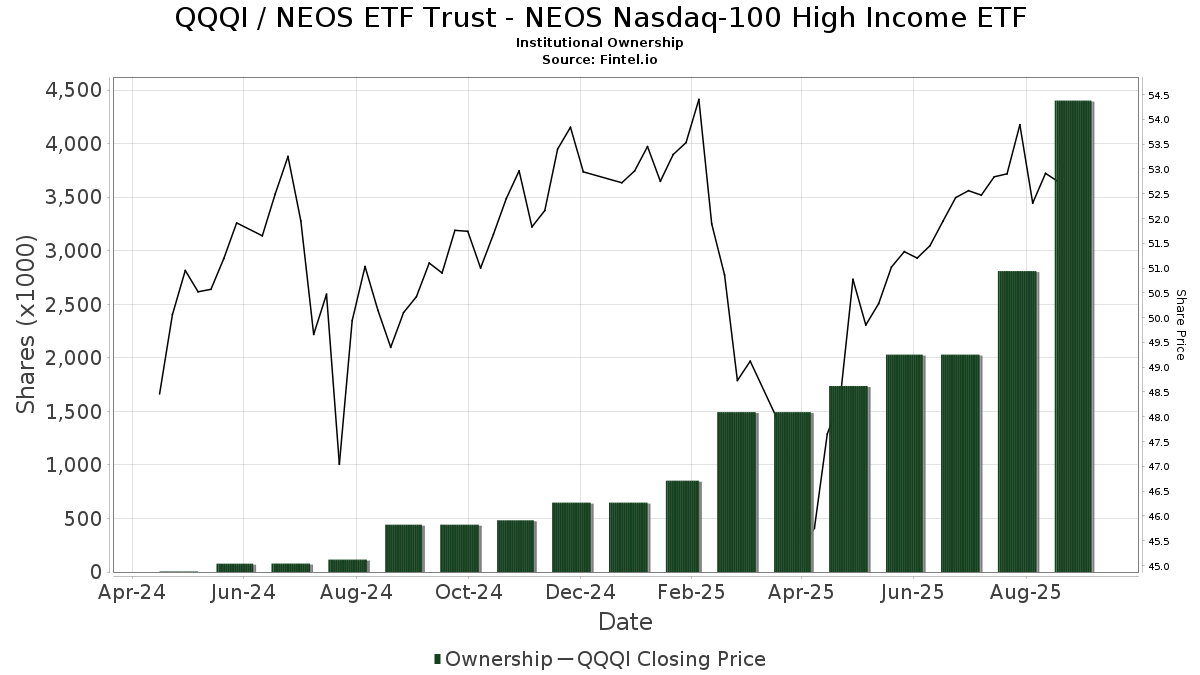
NEOS ETF Trust - NEOS Nasdaq-100 High Income ETF (US:QQQI) har 269 institutionelle ejere og aktionærer, der har indsendt 13D/G- eller 13F-formularer til Securities Exchange Commission (SEC). Disse institutioner har i alt 12,926,968 aktier. Største aktionærer omfatter LPL Financial LLC, UBS Group AG, Howard Capital Management Inc., Royal Bank Of Canada, Merit Financial Group, LLC, Susquehanna International Group, Llp, Second Half Financial Partners, LLC, Morgan Stanley, Susquehanna International Group, Llp, and Mml Investors Services, Llc .
NEOS ETF Trust - NEOS Nasdaq-100 High Income ETF (NasdaqGM:QQQI) institutionel ejerskabsstruktur viser aktuelle positioner i virksomheden efter institutioner og fonde, samt seneste ændringer i positionsstørrelse. Større aktionærer kan omfatte individuelle investorer, investeringsforeninger, hedgefonde eller institutioner. Skema 13D angiver, at investoren besidder (eller besidder) mere end 5 % af virksomheden og har til hensigt (eller har til hensigt at) aktivt at forfølge en ændring i forretningsstrategi. Skema 13G indikerer en passiv investering på over 5%.
The share price as of April 21, 2026 is 53,68 / share. Previously, on April 22, 2025, the share price was 45,32 / share. This represents an increase of 18,45% over that period.
Fondens stemningsscore
Fund Sentiment Score (fka Ownership Accumulation Score) finder de aktier, der bliver mest købt af fonde. Det er resultatet af en sofistikeret, multi-faktor kvantitativ model, der identificerer virksomheder med de højeste niveauer af institutionel akkumulering. Scoringsmodellen bruger en kombination af den samlede stigning i oplyste ejere, ændringerne i porteføljeallokeringer i disse ejere og andre målinger. Tallet går fra 0 til 100, hvor højere tal indikerer et højere niveau af akkumulering for sine jævnaldrende, og 50 er gennemsnittet.
Opdateringsfrekvens: Dagligt
Se Ownership Explorer, som giver en liste over højest rangerende virksomheder.
AI+ Ask Fintel’s AI assistant about NEOS ETF Trust - NEOS Nasdaq-100 High Income ETF.
Select a question to share a public post with an AI-crafted answer.
Thinking of good questions…
Institutionel Put/Call-forhold
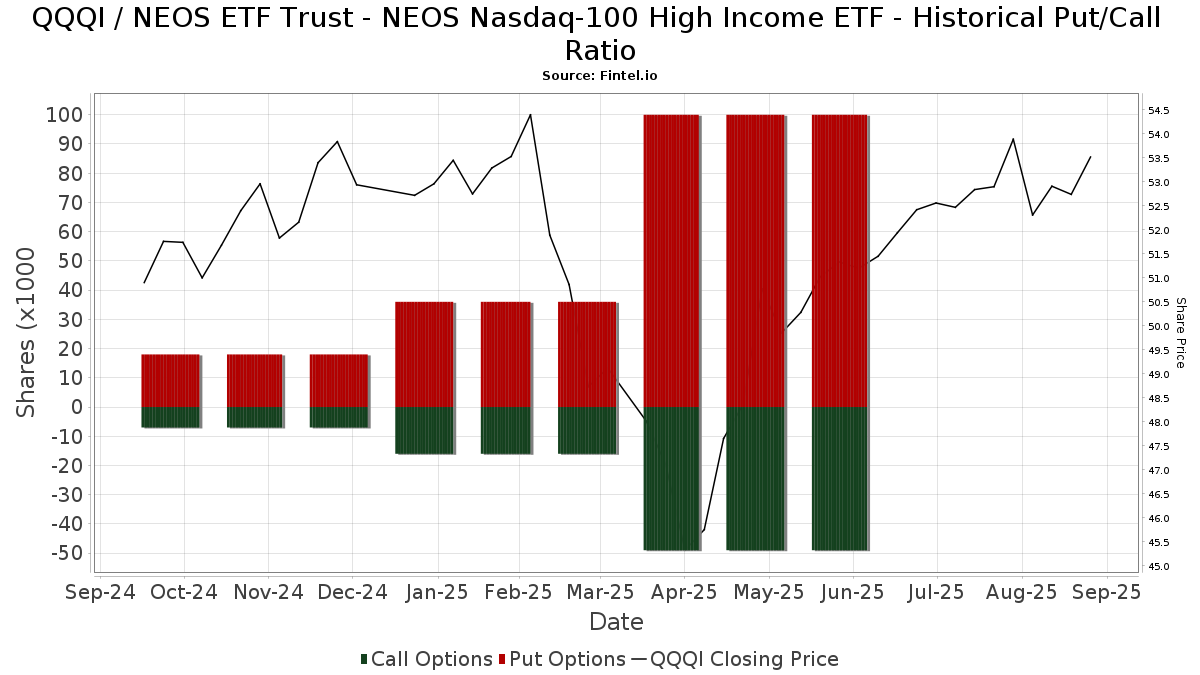
Ud over at indberette standardaktie- og gældsudstedelser skal institutter med mere end 100 mill. aktiver under forvaltning også oplyse deres put- og call-optionsbeholdninger. Da salgsoptioner generelt indikerer negativ stemning, og købsoptioner indikerer positiv stemning, kan vi få en fornemmelse af den overordnede institutionelle stemning ved at plotte forholdet mellem put og kald. Diagrammet til højre viser det historiske put/call-forhold for dette instrument.
Brug af Put/Call Ratio som en indikator for investorernes stemning overvinder en af de vigtigste mangler ved at bruge totalt institutionelt ejerskab, som er, at en betydelig mængde af aktiver under forvaltning investeres passivt for at spore indekser. Passivt forvaltede fonde køber typisk ikke optioner, så indikatoren for put/call-forholdet følger mere nøje følelsen af aktivt forvaltede fonde.
13F og NPORT arkivering
Detaljer om 13F-arkivering er gratis. Detaljer om NP-ansøgninger kræver et premium-medlemskab. Grønne rækker angiver nye positioner. Røde rækker angiver lukkede positioner. Klik på linket ikon for at se den fulde transaktionshistorik.
Opgrader
for at låse premium-data op og eksportere til Excel ![]() .
.
| Fil dato | Kilde | Investor | Type | Gennemsnitlig pris (Øst) |
Aktier | Δ Aktier (%) |
Rapporteret Værdi ($1000) |
Δ Værdi (%) |
Port Alloc (%) |
|
|---|---|---|---|---|---|---|---|---|---|---|
| 2026-01-05 | 13F | Foguth Wealth Management, LLC. | 119.898 | 6.446 | ||||||
| 2026-04-14 | 13F | Wealthcare Advisory Partners LLC | 5.433 | 28,81 | 270 | 18,50 | ||||
| 2026-02-23 | 13F | Monetary Solutions, Ltd | 9 | 0 | ||||||
| 2026-02-03 | 13F | Diversify Wealth Management, Llc | 17.232 | 8,60 | 942 | 6,57 | ||||
| 2026-01-29 | 13F | Comerica Bank | 7.899 | 0,45 | 425 | -0,23 | ||||
| 2026-04-07 | 13F | Estate Planners Group, LLC | 136.417 | 7.347 | ||||||
| 2026-02-09 | 13F | Strategic Financial Concepts, LLC | 0 | -100,00 | 0 | |||||
| 2025-11-14 | 13F | Summit Trail Advisors, Llc | 0 | -100,00 | 0 | |||||
| 2026-04-08 | 13F | Gainplan LLC | 19.108 | -27,61 | 949 | -33,22 | ||||
| 2026-02-12 | 13F | Insigneo Advisory Services, Llc | 5.199 | 18,67 | 280 | 18,14 | ||||
| 2026-01-20 | 13F | Independence Bank of Kentucky | 20 | 1 | ||||||
| 2026-02-02 | 13F | Avidian Wealth Solutions, LLC | 14.203 | 169,66 | 765 | 168,07 | ||||
| 2026-02-09 | 13F | Claudia M.p. Batlle, Crp (r) Llc | 6.346 | -42,74 | 342 | -43,17 | ||||
| 2025-10-28 | 13F | Nations Financial Group Inc, /ia/ /adv | 0 | -100,00 | 0 | |||||
| 2026-04-03 | 13F | Global Wealth Strategies & Associates | 2.024 | 101 | ||||||
| 2026-01-29 | 13F | Dunhill Financial, LLC | 100 | 0,00 | 5 | 0,00 | ||||
| 2026-02-12 | 13F | Commonwealth Equity Services, Llc | 86.663 | 38,53 | 4.668 | 155.466,67 | ||||
| 2026-02-12 | 13F | SWAN Capital LLC | 74 | 4 | ||||||
| 2026-02-13 | 13F | Change Path, LLC | 5.838 | 314 | ||||||
| 2026-02-03 | 13F | Anfield Capital Management, LLC | 1.856 | 0,00 | 100 | -1,00 | ||||
| 2026-04-22 | 13F | Genesee Capital Advisors, LLC | 4.164 | 207 | ||||||
| 2026-02-12 | 13F | Steward Partners Investment Advisory, Llc | 12.188 | 98,44 | 656 | 97,59 | ||||
| 2026-02-14 | 13F | Rockefeller Capital Management L.P. | 14.076 | 92,37 | 758 | 91,41 | ||||
| 2026-02-19 | 13F | CI Private Wealth, LLC | 60.642 | 0,70 | 3.266 | 0,09 | ||||
| 2026-02-03 | 13F | NewEdge Wealth, LLC | 12.573 | 3,27 | 677 | 0,89 | ||||
| 2026-04-07 | 13F | Signaturefd, Llc | 530 | 24,71 | 26 | 18,18 | ||||
| 2026-02-02 | 13F | Truist Financial Corp | 7.015 | 30,85 | 378 | 30,00 | ||||
| 2026-02-10 | 13F | Novak & Powell Financial Services, Inc. | 6.100 | 5,17 | 329 | 4,46 | ||||
| 2026-02-12 | 13F | Summit Financial, LLC | 155.897 | 85,12 | 8.397 | 83,96 | ||||
| 2026-04-13 | 13F | IFP Advisors, Inc | 8.856 | 43,19 | 440 | 32,13 | ||||
| 2026-02-06 | 13F | BlueStem Wealth Partners, LLC | 32.725 | 22,09 | 1.763 | 21,35 | ||||
| 2026-04-02 | 13F | Aspect Partners, LLC | 10 | 0 | ||||||
| 2026-01-12 | 13F | Abound Wealth Management | 0 | -100,00 | 0 | -100,00 | ||||
| 2025-11-13 | 13F | Fmr Llc | 0 | -100,00 | 0 | -100,00 | ||||
| 2026-02-04 | 13F | Ameritas Advisory Services, LLC | 31.421 | 8.726,12 | 1.692 | 8.805,26 | ||||
| 2026-02-09 | 13F | Harbour Investments, Inc. | 1.348 | -42,83 | 73 | -43,31 | ||||
| 2026-02-13 | 13F | Wealth Alliance | 9.460 | 0,00 | 510 | -0,59 | ||||
| 2026-04-09 | 13F | DHJJ Financial Advisors, Ltd. | 5 | 0,00 | 0 | |||||
| 2026-01-29 | 13F | D.a. Davidson & Co. | 4.970 | 268 | ||||||
| 2026-04-15 | 13F | Seacrest Wealth Management, Llc | 13.794 | -7,79 | 685 | -15,85 | ||||
| 2026-02-11 | 13F | MCF Advisors LLC | 1.275 | 34,64 | 69 | 33,33 | ||||
| 2026-04-20 | 13F | RiverTree Advisors, LLC | 93.270 | 16,50 | 4.635 | 7,47 | ||||
| 2026-02-13 | 13F | Wells Fargo & Company/mn | 1.984 | -58,68 | 107 | -59,23 | ||||
| 2026-02-05 | 13F | Allworth Financial LP | 10.091 | 109,97 | 543 | 108,85 | ||||
| 2026-02-13 | 13F | Mariner, LLC | 18.408 | 22,37 | 991 | 21,60 | ||||
| 2026-02-13 | 13F | Horizon Investment Services, LLC | 4.430 | 3,55 | 239 | 3,03 | ||||
| 2026-01-26 | 13F | AE Wealth Management LLC | 4.955 | 170,03 | 267 | 168,69 | ||||
| 2026-01-28 | 13F | Chicago Partners Investment Group LLC | 6.800 | 0,00 | 366 | -3,17 | ||||
| 2026-04-17 | 13F | PMG Family Office LLC | 19.649 | 109,79 | 976 | 93,65 | ||||
| 2026-04-16 | 13F | SG Americas Securities, LLC | 75.000 | 4 | ||||||
| 2025-11-04 | 13F | Jones Financial Companies Lllp | 0 | -100,00 | 0 | |||||
| 2026-02-17 | 13F | Snowden Capital Advisors LLC | 6.909 | 7,62 | 372 | 7,20 | ||||
| 2026-01-21 | 13F | MBL Wealth, LLC | 251.528 | 20,41 | 13.547 | 19,66 | ||||
| 2026-02-12 | 13F | Bank Of Montreal /can/ | 970 | 53 | ||||||
| 2026-02-02 | 13F | Grantvest Financial Group LLC | 46.078 | 5,42 | 2.482 | 4,73 | ||||
| 2026-04-06 | 13F | CX Institutional | 0 | -100,00 | 0 | |||||
| 2026-01-21 | 13F | Prime Capital Investment Advisors, LLC | 7.209 | 388 | ||||||
| 2026-02-05 | 13F | BG Investment Services, Inc. | 11.753 | 98,46 | 633 | 97,81 | ||||
| 2026-02-13 | 13F | Lifeworks Advisors, LLC | 49.191 | 2.649 | ||||||
| 2026-01-27 | 13F | Belpointe Asset Management LLC | 34.847 | 1.877 | ||||||
| 2026-01-28 | 13F | Palacios Wealth Management, LLC | 71.344 | -20,90 | 3.843 | -21,40 | ||||
| 2026-02-12 | 13F | Betterment LLC | 8.448 | 0 | ||||||
| 2026-02-24 | 13F | Astoria Portfolio Advisors LLC. | 53.734 | 2.789 | ||||||
| 2026-01-30 | 13F | Bogart Wealth, LLC | 686 | 36,38 | 37 | 33,33 | ||||
| 2026-01-28 | 13F | Kingswood Wealth Advisors, Llc | 8.943 | 19,93 | 482 | 19,06 | ||||
| 2026-02-17 | 13F | Russell Investments Group, Ltd. | 709 | 66,82 | 38 | 65,22 | ||||
| 2026-04-22 | 13F | Ridgecrest Wealth Partners, Llc | 0 | -100,00 | 0 | |||||
| 2026-01-27 | 13F | Latitude Advisors, LLC | 13.089 | 221,60 | 705 | 220,00 | ||||
| 2026-04-13 | 13F | Waycross Investment Management Co | 0 | -100,00 | 0 | |||||
| 2026-04-16 | 13F | Balboa Wealth Partners | 5.632 | -5,85 | 280 | -13,35 | ||||
| 2026-02-05 | 13F | Stephens Inc /ar/ | 24.045 | -1,64 | 1.295 | -2,19 | ||||
| 2026-04-14 | 13F | Prospera Financial Services Inc | 8.961 | 445 | ||||||
| 2026-02-04 | 13F | Cascade Wealth Advisors, Inc | 191.075 | 20,81 | 10.414 | 19,32 | ||||
| 2026-02-13 | 13F | Integrated Wealth Concepts LLC | 5.826 | -39,98 | 314 | -40,49 | ||||
| 2026-01-15 | 13F | Capital Advisors Inc/ok | 4.750 | 256 | ||||||
| 2026-02-11 | 13F | Capital Analysts, Inc. | 356 | -4,81 | 0 | |||||
| 2026-04-07 | 13F | Park Avenue Securities Llc | 51.329 | 30,00 | 3 | 0,00 | ||||
| 2026-02-12 | 13F | Federation des caisses Desjardins du Quebec | 700 | 75,00 | 38 | 76,19 | ||||
| 2025-12-31 | 13F | Pvg Asset Management Corp | 0 | -100,00 | 0 | |||||
| 2026-04-20 | 13F | CWA Asset Management Group, LLC | 10.445 | 11,05 | 519 | 2,57 | ||||
| 2025-11-13 | 13F | Quadrature Capital Ltd | 0 | -100,00 | 0 | -100,00 | ||||
| 2026-02-09 | 13F | Cary Street Partners Financial Llc | 4.610 | 248 | ||||||
| 2026-02-12 | 13F | BlackRock, Inc. | 1.212 | -32,37 | 65 | -32,99 | ||||
| 2026-01-29 | 13F | UBS Group AG | 704.001 | 230,75 | 37.917 | 228,68 | ||||
| 2026-01-20 | 13F | Stratos Wealth Advisors, LLC | 15.269 | -6,03 | 822 | -6,59 | ||||
| 2026-02-04 | 13F | Independent Advisor Alliance | 23.468 | -3,53 | 1.264 | -4,17 | ||||
| 2026-02-17 | 13F | Eddie Patel Inc | 106.805 | 5.753 | ||||||
| 2026-01-29 | 13F | Sanctuary Advisors, LLC | 25.215 | -4,67 | 1.358 | -5,23 | ||||
| 2026-01-23 | 13F | Optima Capital Llc | 739 | 40 | ||||||
| 2026-02-03 | 13F | Winch Advisory Services, LLC | 199 | 3,65 | 11 | 0,00 | ||||
| 2026-02-13 | 13F | Kestra Advisory Services, LLC | 0 | -100,00 | 0 | |||||
| 2026-04-08 | 13F | Wealth Enhancement Advisory Services, Llc | 6.194 | -70,19 | 311 | -72,48 | ||||
| 2026-04-17 | 13F | Brown, Lisle/cummings, Inc. | 3.525 | 0,00 | 175 | -7,41 | ||||
| 2026-04-15 | 13F | Milestone Asset Management, Llc | 34.565 | 214,83 | 1.718 | 190,52 | ||||
| 2026-02-10 | 13F | Lido Advisors, LLC | 15.875 | 0,00 | 860 | 0,00 | ||||
| 2026-01-12 | 13F | Traynor Capital Management, Inc. | 4.656 | 251 | ||||||
| 2025-11-14 | 13F | Wolverine Trading, Llc | Put | 24.600 | 1.331 | |||||
| 2025-11-14 | 13F | Wolverine Trading, Llc | Call | 19.300 | 1.044 | |||||
| 2026-02-13 | 13F | Morgan Stanley | 416.793 | 9.247,23 | 22.448 | 9.214,52 | ||||
| 2026-04-02 | 13F | Ares Financial Consulting, LLC | 102 | 5 | ||||||
| 2026-04-09 | 13F | Teamwork Financial Advisors, LLC | 131.273 | -21,71 | 6.523 | -27,78 | ||||
| 2026-02-13 | 13F | Brown Advisory Inc | 9.740 | 0,00 | 525 | -0,57 | ||||
| 2026-02-13 | 13F | Ieq Capital, Llc | 89.560 | 3,01 | 4.824 | 2,36 | ||||
| 2026-02-11 | 13F | LPL Financial LLC | 1.922.479 | 42,83 | 103.545 | 41,93 | ||||
| 2026-01-07 | 13F | Puff Wealth Management, Llc | 11.244 | 604 | ||||||
| 2026-02-02 | 13F | Chung Wu Investment Group, LLC | 114.456 | 15,01 | 6.165 | 14,30 | ||||
| 2026-02-13 | 13F | SRS Capital Advisors, Inc. | 1.869 | 101 | ||||||
| 2026-02-13 | 13F | Stifel Financial Corp | 127.342 | 15,74 | 6.859 | 15,01 | ||||
| 2026-01-26 | 13F | Private Trust Co Na | 6.915 | 0,35 | 372 | -0,27 | ||||
| 2026-02-17 | 13F | Cresset Asset Management, LLC | 16.340 | -2,01 | 880 | -2,55 | ||||
| 2026-02-10 | 13F | Goldman Sachs Group Inc | 170.337 | 9.174 | ||||||
| 2026-02-17 | 13F | Advisory Services Network, LLC | 4.491 | 17.864,00 | 242 | 24.000,00 | ||||
| 2026-04-07 | 13F | Farther Finance Advisors, LLC | 80.673 | 595,94 | 4.049 | 548,72 | ||||
| 2026-02-18 | 13F | GWM Advisors LLC | 67.271 | 27,20 | 3.623 | 26,41 | ||||
| 2026-02-12 | 13F | StoneX Group Inc. | 22.879 | 99,17 | 1.232 | 98,07 | ||||
| 2026-02-18 | 13F | Beacon Pointe Advisors, LLC | 16.667 | 9,49 | 898 | 8,73 | ||||
| 2026-02-12 | 13F | Founders Financial Alliance, LLC | 7.020 | 87,00 | 378 | 86,21 | ||||
| 2026-02-10 | 13F | Envestnet Asset Management Inc | 192.661 | 22,04 | 10.377 | 21,27 | ||||
| 2026-04-08 | 13F | Ccg Wealth Management, Llc | 28.271 | 36,83 | 1.405 | 26,26 | ||||
| 2026-01-30 | 13F | Delta Investment Management, LLC | 11.330 | 95,08 | 610 | 94,27 | ||||
| 2026-02-04 | 13F | MADDEN SECURITIES Corp | 289.499 | 25,38 | 15.592 | 24,59 | ||||
| 2026-02-12 | 13F | WealthPLAN Partners, LLC | 0 | -100,00 | 0 | |||||
| 2026-02-13 | 13F | Mml Investors Services, Llc | 372.234 | 15,51 | 20.049 | 14,78 | ||||
| 2026-01-29 | 13F | RMG Wealth Management LLC | 0 | -100,00 | 0 | |||||
| 2026-04-21 | 13F | Claro Advisors LLC | 5.477 | 2,66 | 272 | -5,23 | ||||
| 2026-02-09 | 13F | Keating Financial Advisory Services, Inc. | 5.108 | 275 | ||||||
| 2026-02-02 | 13F | Oppenheimer & Co Inc | 16.905 | 1,49 | 911 | 0,89 | ||||
| 2026-02-10 | 13F | Foundations Investment Advisors, LLC | 34.861 | 17,65 | 1.878 | 16,87 | ||||
| 2026-04-16 | 13F | Roble, Belko & Company, Inc | 331 | 10,33 | 0 | |||||
| 2026-01-21 | 13F | New Wave Wealth Advisors Llc | 0 | -100,00 | 0 | -100,00 | ||||
| 2026-01-21 | 13F | Capital Investment Advisory Services, LLC | 258.407 | 53,73 | 13.918 | 52,77 | ||||
| 2026-02-03 | 13F | SBI Securities Co., Ltd. | 37.988 | 2.046 | ||||||
| 2026-02-17 | 13F | Advisor Group Holdings, Inc. | 13.692 | 30,66 | 738 | 29,98 | ||||
| 2026-02-03 | 13F | International Assets Investment Management, Llc | 8.099 | 46,64 | 436 | 52,98 | ||||
| 2025-11-12 | 13F | Park Square Financial Group, LLC | 0 | -100,00 | 0 | |||||
| 2026-04-20 | 13F | Kestra Private Wealth Services, Llc | 65.926 | -0,26 | 3.276 | -8,01 | ||||
| 2026-02-17 | 13F | Creative Planning | 10.749 | 188,33 | 579 | 186,14 | ||||
| 2026-02-02 | 13F | Montag A & Associates Inc | 4.214 | -38,75 | 227 | -39,25 | ||||
| 2026-02-03 | 13F | Falcon Wealth Planning | 0 | -100,00 | 0 | |||||
| 2026-02-19 | 13F | Atomi Financial Group, Inc. | 3.942 | 212 | ||||||
| 2026-01-30 | 13F | Oakworth Capital, Inc. | 7.200 | 388 | ||||||
| 2026-02-05 | 13F | 626 Financial, LLC | 5.620 | 0,00 | 303 | -0,66 | ||||
| 2026-02-13 | 13F | Luminist Capital LLC | 3.659 | 197 | ||||||
| 2026-02-10 | 13F | Alpha Financial Partners, LLC | 10.564 | -68,87 | 569 | -69,11 | ||||
| 2026-02-13 | 13F | Resources Investment Advisors, LLC. | 4.648 | 250 | ||||||
| 2026-04-15 | 13F | Redhawk Wealth Advisors, Inc. | 5.778 | 1,98 | 287 | -5,90 | ||||
| 2026-04-22 | 13F | Kapstone Financial Advisors LLC | 4.069 | 0,00 | 202 | -7,76 | ||||
| 2026-02-13 | 13F | Bay Colony Advisory Group, Inc d/b/a Bay Colony Advisors | 0 | -100,00 | 0 | |||||
| 2026-02-13 | 13F | Arete Wealth Advisors, LLC | 47.093 | 8,56 | 3 | 0,00 | ||||
| 2026-04-10 | 13F | Armstrong Advisory Group, Inc | 3.818 | 2,99 | 190 | -5,03 | ||||
| 2026-04-20 | 13F | Independence Wealth Advisors, LLC | 85.652 | 17,13 | 4.256 | 8,08 | ||||
| 2026-02-17 | 13F | Private Advisor Group, LLC | 167.381 | -13,35 | 9.015 | -13,90 | ||||
| 2026-02-17 | 13F | Safe Harbor Fiduciary, LLC | 7.412 | 399 | ||||||
| 2026-02-17 | 13F | URS Advisory LLC | 190.874 | 10.280 | ||||||
| 2026-02-06 | 13F | EverSource Wealth Advisors, LLC | 4 | 33,33 | 0 | |||||
| 2026-04-07 | 13F | U.S. Capital Wealth Advisors, LLC | 35.342 | 10,00 | 1.756 | 1,50 | ||||
| 2026-02-03 | 13F | Red Crane Wealth Management, Llc | 6.751 | 12,80 | 364 | 12,04 | ||||
| 2026-01-21 | 13F | Kaizen Financial Strategies | 34.707 | 2,83 | 1.869 | 2,13 | ||||
| 2026-04-20 | 13F | City State Bank | 2.000 | 0,00 | 99 | -7,48 | ||||
| 2026-01-23 | 13F | Howard Capital Management Inc. | 606.307 | 8,57 | 32.656 | 7,89 | ||||
| 2026-02-12 | 13F | Empower Advisory Group, LLC | 0 | -100,00 | 0 | |||||
| 2026-04-13 | 13F | Salem Investment Counselors Inc | 1.025 | 51 | ||||||
| 2026-02-11 | 13F | J.w. Cole Advisors, Inc. | 17.609 | 57,22 | 217 | -64,42 | ||||
| 2026-04-21 | 13F | GHP Investment Advisors, Inc. | 337 | 316,05 | 17 | 300,00 | ||||
| 2026-01-15 | 13F | Jaffetilchin Investment Partners, LLC | 4.305 | 232 | ||||||
| 2026-01-12 | 13F | World Equity Group, Inc. | 14.614 | 30,17 | 787 | 29,44 | ||||
| 2026-01-23 | 13F | Capital Planning LLC | 9.322 | 52,25 | 501 | 51,36 | ||||
| 2026-04-21 | 13F | PDS Planning, Inc | 10.488 | 521 | ||||||
| 2026-04-14 | 13F | Grant Private Wealth Management Inc | 28.995 | 1.441 | ||||||
| 2026-02-17 | 13F | Raymond James Financial Inc | 4.543 | -9,57 | 245 | -10,29 | ||||
| 2026-01-27 | 13F | Forum Financial Management, LP | 5.558 | 0,00 | 299 | -0,66 | ||||
| 2026-01-27 | 13F | Davies Financial Advisors, Inc. | 0 | -100,00 | 0 | |||||
| 2026-02-04 | 13F | Pensionmark Financial Group, Llc | 0 | -100,00 | 0 | |||||
| 2026-02-05 | 13F | Atria Investments Llc | 7.564 | 0,93 | 407 | 0,25 | ||||
| 2026-01-05 | 13F | Catherine Avery Investment Management LLC | 0 | -100,00 | 0 | -100,00 | ||||
| 2026-04-17 | 13F | RFG Advisory, LLC | 112.483 | 7,54 | 5.589 | -0,78 | ||||
| 2026-01-20 | 13F | SOA Wealth Advisors, LLC. | 1.251 | 24,98 | 67 | 24,07 | ||||
| 2026-04-22 | 13F | Coston, McIsaac & Partners | 46 | 0,00 | 0 | |||||
| 2026-04-16 | 13F | Triad Wealth Partners, LLC | 8.159 | 3,19 | 405 | -4,71 | ||||
| 2026-02-13 | 13F | Pin Oak Investment Advisors Inc | 553 | 22,08 | 0 | -100,00 | ||||
| 2026-02-13 | 13F | Aptus Capital Advisors, LLC | 1.283 | 1.503,75 | 69 | 1.625,00 | ||||
| 2026-01-30 | 13F | Strategic Blueprint, LLC | 7.925 | 427 | ||||||
| 2026-02-17 | 13F | Cape Investment Advisory, Inc. | 312 | 17 | ||||||
| 2026-04-22 | 13F | Midwest Financial Group LLC | 4.600 | 4,55 | 229 | -3,39 | ||||
| 2026-02-05 | 13F | Owen LaRue, LLC | 46.040 | 48,43 | 2.480 | 47,47 | ||||
| 2026-02-13 | 13F | MAI Capital Management | 1.031 | 56 | ||||||
| 2026-02-04 | 13F | Meridian Wealth Management, LLC | 18.687 | 1.006 | ||||||
| 2026-01-29 | 13F | Aprio Wealth Management, LLC | 6.575 | 354 | ||||||
| 2026-02-04 | 13F | ELCO Management Co., LLC | 10.200 | 92,45 | 549 | 91,29 | ||||
| 2026-02-02 | 13F | Fifth Third Bancorp | 946 | 51 | ||||||
| 2026-02-06 | 13F | Larson Financial Group LLC | 1.521 | -78,55 | 82 | -78,91 | ||||
| 2026-02-12 | 13F | Hibernia Wealth Partners, LLC | 11.599 | 100,02 | 625 | 98,73 | ||||
| 2026-02-17 | 13F | Susquehanna International Group, Llp | 0 | -100,00 | 0 | |||||
| 2026-01-30 | 13F | Us Bancorp \de\ | 2.990 | 180,22 | 161 | 182,46 | ||||
| 2026-04-13 | 13F | Mather Group, Llc. | 347 | 17 | ||||||
| 2025-11-14 | 13F | Great Valley Advisor Group, Inc. | 0 | -100,00 | 0 | -100,00 | ||||
| 2026-01-26 | 13F | Second Half Financial Partners, LLC | 499.503 | 0,00 | 26.903 | -0,63 | ||||
| 2026-02-04 | 13F | CAP Partners, LLC | 29.823 | 11,99 | 1.606 | 11,30 | ||||
| 2026-02-12 | 13F | Jane Street Group, Llc | Call | 64.200 | 96,33 | 3.458 | 95,09 | |||
| 2026-02-17 | 13F | Garden State Investment Advisory Services LLC | 26.998 | 12,25 | 1.454 | 11,59 | ||||
| 2026-04-16 | 13F | Brookstone Capital Management | 53.940 | 2,59 | 2.680 | -5,33 | ||||
| 2026-02-12 | 13F | Jane Street Group, Llc | 16.537 | -88,27 | 891 | -88,35 | ||||
| 2026-02-12 | 13F | Jane Street Group, Llc | Put | 32.100 | 87,72 | 1.729 | 86,61 | |||
| 2026-02-09 | 13F | IPG Investment Advisors LLC | 6.175 | 333 | ||||||
| 2026-01-21 | 13F | Sound Income Strategies, LLC | 12.366 | 672 | ||||||
| 2026-02-17 | 13F | Bank Of America Corp /de/ | 3.500 | 0,00 | 189 | -0,53 | ||||
| 2026-04-21 | 13F | Sunpointe, LLC | 6.901 | 343 | ||||||
| 2026-01-26 | 13F | Cwm, Llc | 11.991 | 93,31 | 1 | |||||
| 2026-02-20 | 13F/A | Prestige Wealth Management Group LLC | 0 | -100,00 | 0 | |||||
| 2026-01-29 | 13F | Concurrent Investment Advisors, LLC | 36.959 | 13,63 | 1.991 | 12,94 | ||||
| 2026-02-10 | 13F | KERR FINANCIAL PLANNING Corp | 4.809 | 53.333,33 | 251 | |||||
| 2026-02-06 | 13F | Fortis Group Advisors, LLC | 25.241 | 26,03 | 1.359 | 22,23 | ||||
| 2026-02-17 | 13F | Captrust Financial Advisors | 6.388 | 14,15 | 344 | 13,53 | ||||
| 2026-02-09 | 13F | Frazier Financial Advisors, LLC | 0 | -100,00 | 0 | -100,00 | ||||
| 2026-04-15 | 13F | Journey Strategic Wealth Llc | 5.368 | 14,26 | 267 | 5,14 | ||||
| 2026-04-07 | 13F | Oasis Advisors, LLC | 18.054 | 972 | ||||||
| 2026-02-04 | 13F | Atlantic Union Bankshares Corp | 208 | 11 | ||||||
| 2026-02-06 | 13F | Prevail Innovative Wealth Advisors, Llc | 25.530 | 1.375 | ||||||
| 2025-11-06 | 13F | Assetmark, Inc | 0 | -100,00 | 0 | |||||
| 2026-02-02 | 13F | Mutual Advisors, LLC | 5.446 | 19,12 | 293 | 18,15 | ||||
| 2026-01-30 | 13F | Sigma Planning Corp | 9.250 | 27,76 | 498 | 27,04 | ||||
| 2026-02-23 | 13F | Sonoma Allocations LLC | 4.657 | 0,00 | 252 | 0,00 | ||||
| 2026-04-15 | 13F | Financial Management Professionals, Inc. | 175 | 4,79 | 9 | 0,00 | ||||
| 2026-02-05 | 13F | Tucker Asset Management Llc | 145 | 8 | ||||||
| 2026-02-06 | 13F | VSM Wealth Advisory, LLC | 41 | 2 | ||||||
| 2026-04-17 | 13F | AdvisorNet Financial, Inc | 5.976 | -18,22 | 297 | -24,68 | ||||
| 2026-04-16 | 13F | Tactive Advisors, LLC | 28.224 | 4,04 | 1.402 | -4,04 | ||||
| 2026-02-13 | 13F | Colony Group, LLC | 69.689 | 0,29 | 3.776 | 0,27 | ||||
| 2026-02-17 | 13F | Gladstone Institutional Advisory LLC | 26.329 | 8,37 | 1.418 | 7,75 | ||||
| 2026-02-17 | 13F | Citadel Advisors Llc | Put | 51.000 | -29,75 | 2.747 | -30,20 | |||
| 2026-01-07 | 13F | Aventura Private Wealth, LLC | 24.612 | 477,20 | 1.326 | 473,59 | ||||
| 2026-02-17 | 13F | Citadel Advisors Llc | 111.105 | 65,23 | 5.984 | 64,22 | ||||
| 2026-02-17 | 13F | Citadel Advisors Llc | Call | 72.700 | 56,34 | 3.916 | 55,36 | |||
| 2026-02-03 | 13F | Sequoia Financial Advisors, LLC | 11.824 | 3,87 | 637 | 3,08 | ||||
| 2026-04-17 | 13F | High Net Worth Advisory Group LLC | 23.600 | 5,94 | 1.173 | -2,25 | ||||
| 2026-01-23 | 13F | HBW Advisory Services LLC | 5.826 | 0,60 | 314 | 0,00 | ||||
| 2026-02-02 | 13F | FSA Advisors, Inc. | 55.410 | 80,54 | 2.984 | 79,43 | ||||
| 2026-04-10 | 13F | Novem Group | 6.215 | 1,74 | 309 | -6,38 | ||||
| 2026-02-10 | 13F/A | Northwestern Mutual Wealth Management Co | 3.424 | 1.750,81 | 184 | 1.740,00 | ||||
| 2026-01-28 | 13F | Geneos Wealth Management Inc. | 583 | 3,55 | 31 | 3,33 | ||||
| 2026-02-10 | 13F | IFG Advisory, LLC | 16.482 | 888 | ||||||
| 2026-02-17 | 13F | Gotham Asset Management, LLC | 58.250 | 18,27 | 3.137 | 17,53 | ||||
| 2026-02-09 | 13F | Kingsview Wealth Management, LLC | 91.783 | 40,14 | 4.943 | 39,28 | ||||
| 2026-04-15 | 13F | Norden Group Llc | 38.984 | 189,65 | 1.937 | 167,54 | ||||
| 2026-04-16 | 13F | Capital Investment Advisors, LLC | 18.113 | 70,56 | 900 | 57,62 | ||||
| 2026-02-11 | 13F | Parallel Advisors, LLC | 374 | 20 | ||||||
| 2026-02-19 | 13F | Mcguire Capital Advisors Inc | 15 | 1 | ||||||
| 2026-04-06 | 13F | IFS Advisors, LLC | 100 | 0,00 | 5 | -20,00 | ||||
| 2026-02-06 | 13F | Rockport Wealth LLC | 9.064 | 488 | ||||||
| 2026-02-05 | 13F | Td Private Client Wealth Llc | 19 | 1 | ||||||
| 2026-02-11 | 13F | Gateway Wealth Partners, LLC | 4.282 | 231 | ||||||
| 2026-04-22 | 13F | Apollon Wealth Management, LLC | 257.478 | 23,34 | 12.794 | 13,80 | ||||
| 2025-11-12 | 13F | Commerce Bank | 0 | -100,00 | 0 | |||||
| 2026-02-06 | 13F | Keystone Financial Group | 14.580 | 0,00 | 785 | -0,63 | ||||
| 2026-04-15 | 13F | Activest Wealth Management | 1.016 | 50 | ||||||
| 2026-04-20 | 13F | Sowell Financial Services LLC | 40.393 | 10,91 | 2.007 | 2,35 | ||||
| 2026-01-20 | 13F | Stratos Wealth Partners, LTD. | 82.547 | 16,00 | 4.446 | 15,30 | ||||
| 2026-01-26 | 13F | Mountain Hill Investment Partners Corp. | 5 | 0,00 | 0 | |||||
| 2026-02-20 | 13F | Sunbelt Securities, Inc. | 8.056 | 79,50 | 434 | 78,19 | ||||
| 2026-02-12 | 13F | Hollencrest Capital Management | 518 | 28 | ||||||
| 2026-01-26 | 13F | PFG Investments, LLC | 73.781 | 19,01 | 3.974 | 18,24 | ||||
| 2026-02-13 | 13F | Pathstone Holdings, LLC | 4.190 | 0,43 | 226 | -0,44 | ||||
| 2026-02-17 | 13F | IHT Wealth Management, LLC | 6.257 | 337 | ||||||
| 2026-04-21 | 13F | Unique Wealth, Llc | 10.220 | 5,84 | 508 | -2,50 | ||||
| 2026-04-10 | 13F | Magnus Financial Group LLC | 5.844 | -0,39 | 290 | -7,94 | ||||
| 2026-02-13 | 13F | Fortitude Advisory Group L.L.C. | 5.087 | 5,10 | 274 | 4,20 | ||||
| 2026-04-22 | 13F | Janney Montgomery Scott LLC | 15.800 | 61,04 | 1 | |||||
| 2026-02-12 | 13F | Renaissance Technologies Llc | 0 | -100,00 | 0 | |||||
| 2026-04-13 | 13F | Creative Financial Designs Inc /adv | 2.360 | 0,00 | 117 | -7,87 | ||||
| 2026-02-17 | 13F | Camarda Financial Advisors, LLC | 6.968 | -4,46 | 375 | -5,06 | ||||
| 2026-02-05 | 13F | Cambridge Investment Research Advisors, Inc. | 100.854 | 20,88 | 5 | 25,00 | ||||
| 2026-04-02 | 13F/A | Soltis Investment Advisors LLC | 3.738 | 201 | ||||||
| 2025-11-12 | 13F | TCG Advisory Services, LLC | 0 | -100,00 | 0 | |||||
| 2026-04-16 | 13F | Financial Management Network Inc | 16.800 | 338,87 | 872 | 324,88 | ||||
| 2026-02-09 | 13F | Atticus Wealth Management, Llc | 4.369 | 1,51 | 235 | 0,86 | ||||
| 2026-02-17 | 13F | Susquehanna International Group, Llp | Call | 509.000 | 280,13 | 27.415 | 277,76 | |||
| 2026-02-10 | 13F | Root Financial Partners, LLC | 5 | 0 | ||||||
| 2026-02-11 | 13F | Lifestyle Asset Management, Inc. | 0 | -100,00 | 0 | |||||
| 2026-02-06 | 13F | Pnc Financial Services Group, Inc. | 980 | 131,13 | 53 | 136,36 | ||||
| 2026-02-09 | 13F | PSI Advisors, LLC | 68.777 | 48,92 | 3.704 | 47,98 | ||||
| 2026-02-17 | 13F | Susquehanna International Group, Llp | Put | 397.700 | 60,82 | 21.420 | 59,81 | |||
| 2026-01-21 | 13F | Newbridge Financial Services Group, Inc. | 61.708 | 37,17 | 3.324 | 36,30 | ||||
| 2026-04-08 | 13F | Dynamic Advisor Solutions LLC | 20.285 | 24,55 | 1.008 | 14,82 | ||||
| 2026-02-12 | 13F | Brinker Capital Investments, LLC | 72.493 | 286,53 | 3.904 | 284,25 | ||||
| 2026-02-17 | 13F | Cetera Investment Advisers | Put | 500 | 0 | |||||
| 2026-04-07 | 13F | CoreCap Advisors, LLC | 22.033 | 57,55 | 1.095 | 45,29 | ||||
| 2026-02-17 | 13F | Cetera Investment Advisers | 42.302 | -3,79 | 2.278 | -4,41 | ||||
| 2026-04-16 | 13F | Quotient Wealth Partners, LLC | 8.698 | 432 | ||||||
| 2026-02-09 | 13F | Hantz Financial Services, Inc. | 3 | 0 | ||||||
| 2026-02-13 | 13F | Arkadios Wealth Advisors | 8.941 | 21,28 | 482 | 20,55 | ||||
| 2026-02-17 | 13F/A | Uniplan Investment Counsel, Inc. | 32.746 | 1.764 | ||||||
| 2026-02-17 | 13F | Old Mission Capital Llc | 67.942 | 174,20 | 3.659 | 172,65 | ||||
| 2026-02-11 | 13F | Jpmorgan Chase & Co | 41 | 0,00 | 2 | 0,00 | ||||
| 2026-02-17 | 13F | Royal Bank Of Canada | 590.450 | 73,95 | 31.801 | 72,86 | ||||
| 2026-02-17 | 13F | Equitable Holdings, Inc. | 16.712 | 20,03 | 900 | 19,36 | ||||
| 2026-04-15 | 13F | Merit Financial Group, LLC | 553.773 | 9,54 | 27.517 | 1,05 | ||||
| 2026-02-03 | 13F | We Are One Seven, LLC | 0 | -100,00 | 0 | |||||
| 2026-02-06 | 13F | Global Retirement Partners, LLC | 8.985 | 50,18 | 484 | 49,07 | ||||
| 2026-04-08 | 13F | Dover Advisors, Llc | 9.465 | 0,00 | 470 | -7,66 | ||||
| 2026-04-14 | 13F | Nbc Securities, Inc. | 3.576 | 41,68 | 178 | 31,11 | ||||
| 2026-02-06 | 13F | HighTower Advisors, LLC | 30.687 | 14,18 | 1.653 | 13,46 | ||||
| 2026-02-18 | 13F/A | Virtue Capital Management, LLC | 29.837 | 3.948,44 | 1.604 | 625,79 | ||||
| 2026-04-21 | 13F | October Effect Ltd | 13.949 | 1,23 | 693 | -6,60 | ||||
| 2026-02-13 | 13F | Golden State Wealth Management, LLC | 0 | -100,00 | 0 | |||||
| 2026-02-09 | 13F | Hartland & Co., LLC | 23.214 | 20,82 | 1.250 | 20,08 | ||||
| 2026-04-08 | 13F | StoneCrest Wealth Management, Inc. | 101.292 | -4,27 | 5.033 | -11,69 | ||||
| 2026-02-02 | 13F | Ellis Investment Partners, LLC | 13.337 | 130,11 | 718 | 128,66 | ||||
| 2026-02-12 | 13F | Kovack Advisors, Inc. | 37.938 | 217,18 | 1.358 | 109,57 | ||||
| 2026-01-21 | 13F | Walkner Condon Financial Advisors LLC | 3.873 | 0,00 | 209 | -0,48 |