Grundlæggende statistik
| Institutionelle ejere | 201 total, 200 long only, 0 short only, 1 long/short - change of 0,49% MRQ |
| Gennemsnitlig porteføljeallokering | 0.2652 % - change of 45,24% MRQ |
| Institutionelle aktier (lange) | 6.137.940 (ex 13D/G) - change of -0,13MM shares -2,14% MRQ |
| Institutionel værdi (lang) | $ 609.876 USD ($1000) |
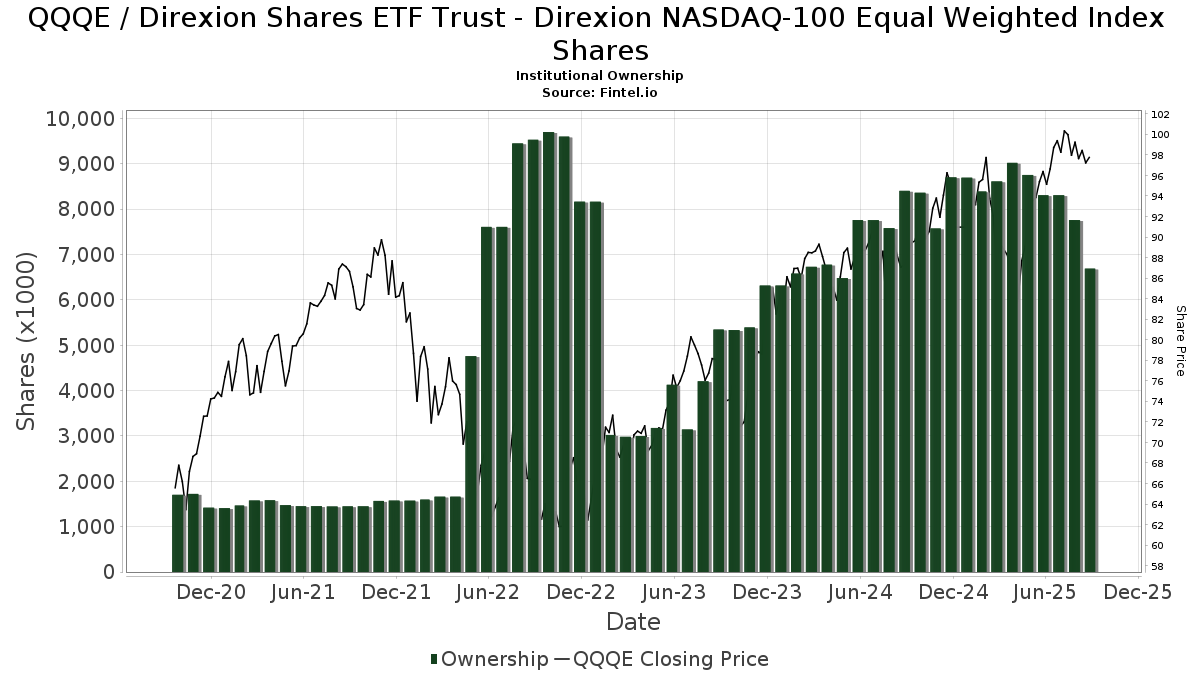
Institutionelt ejerskab og aktionærer
Direxion Shares ETF Trust - NASDAQ-100 Equal Weighted Index ETF (US:QQQE) har 201 institutionelle ejere og aktionærer, der har indsendt 13D/G- eller 13F-formularer til Securities Exchange Commission (SEC). Disse institutioner har i alt 6,137,940 aktier. Største aktionærer omfatter Morgan Stanley, Bank Of America Corp /de/, Steel Peak Wealth Management LLC, Waddell & Associates, Llc, LPL Financial LLC, Endurance Services Ltd, UBS Group AG, Goldman Sachs Group Inc, Frisch Financial Group, Inc., and Bnp Paribas Arbitrage, Sa .
Direxion Shares ETF Trust - NASDAQ-100 Equal Weighted Index ETF (NasdaqGM:QQQE) institutionel ejerskabsstruktur viser aktuelle positioner i virksomheden efter institutioner og fonde, samt seneste ændringer i positionsstørrelse. Større aktionærer kan omfatte individuelle investorer, investeringsforeninger, hedgefonde eller institutioner. Skema 13D angiver, at investoren besidder (eller besidder) mere end 5 % af virksomheden og har til hensigt (eller har til hensigt at) aktivt at forfølge en ændring i forretningsstrategi. Skema 13G indikerer en passiv investering på over 5%.
The share price as of March 26, 2026 is 98,29 / share. Previously, on March 27, 2025, the share price was 89,23 / share. This represents an increase of 10,15% over that period.
Fondens stemningsscore
Fund Sentiment Score (fka Ownership Accumulation Score) finder de aktier, der bliver mest købt af fonde. Det er resultatet af en sofistikeret, multi-faktor kvantitativ model, der identificerer virksomheder med de højeste niveauer af institutionel akkumulering. Scoringsmodellen bruger en kombination af den samlede stigning i oplyste ejere, ændringerne i porteføljeallokeringer i disse ejere og andre målinger. Tallet går fra 0 til 100, hvor højere tal indikerer et højere niveau af akkumulering for sine jævnaldrende, og 50 er gennemsnittet.
Opdateringsfrekvens: Dagligt
Se Ownership Explorer, som giver en liste over højest rangerende virksomheder.
AI+ Ask Fintel’s AI assistant about Direxion Shares ETF Trust - NASDAQ-100 Equal Weighted Index ETF.
Select a question to share a public post with an AI-crafted answer.
Thinking of good questions…
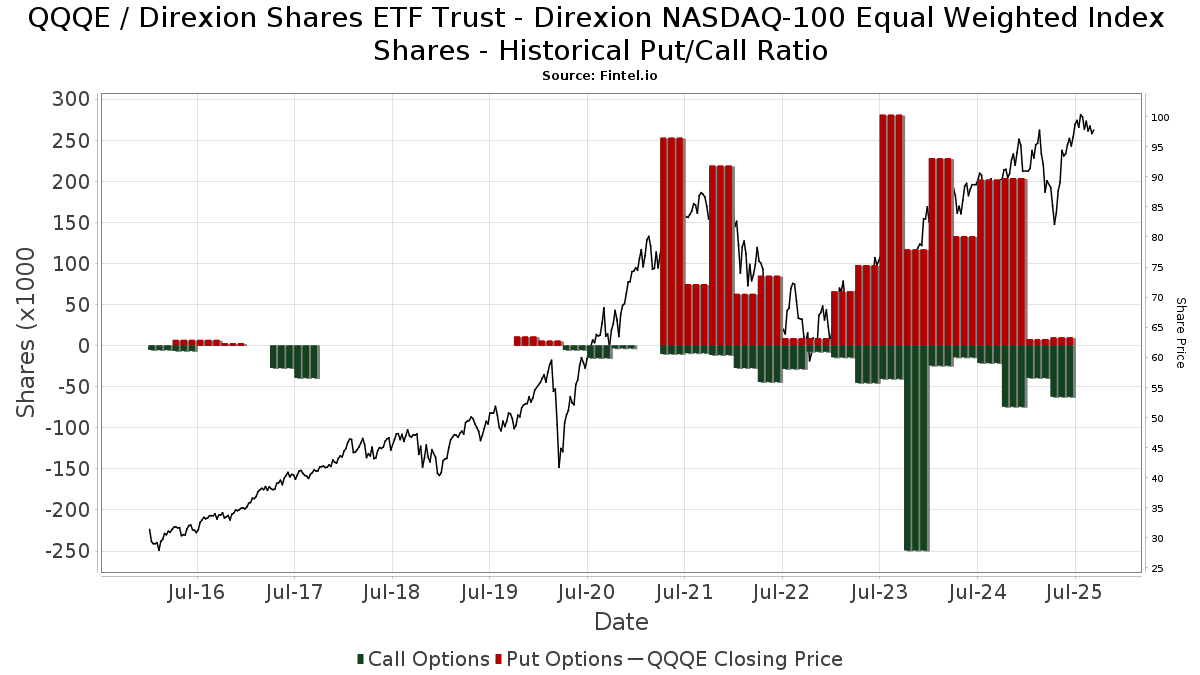
Institutionel Put/Call-forhold
Ud over at indberette standardaktie- og gældsudstedelser skal institutter med mere end 100 mill. aktiver under forvaltning også oplyse deres put- og call-optionsbeholdninger. Da salgsoptioner generelt indikerer negativ stemning, og købsoptioner indikerer positiv stemning, kan vi få en fornemmelse af den overordnede institutionelle stemning ved at plotte forholdet mellem put og kald. Diagrammet til højre viser det historiske put/call-forhold for dette instrument.
Brug af Put/Call Ratio som en indikator for investorernes stemning overvinder en af de vigtigste mangler ved at bruge totalt institutionelt ejerskab, som er, at en betydelig mængde af aktiver under forvaltning investeres passivt for at spore indekser. Passivt forvaltede fonde køber typisk ikke optioner, så indikatoren for put/call-forholdet følger mere nøje følelsen af aktivt forvaltede fonde.
13F og NPORT arkivering
Detaljer om 13F-arkivering er gratis. Detaljer om NP-ansøgninger kræver et premium-medlemskab. Grønne rækker angiver nye positioner. Røde rækker angiver lukkede positioner. Klik på linket ikon for at se den fulde transaktionshistorik.
Opgrader
for at låse premium-data op og eksportere til Excel ![]() .
.
| Fil dato | Kilde | Investor | Type | Gennemsnitlig pris (Øst) |
Aktier | Δ Aktier (%) |
Rapporteret Værdi ($1000) |
Δ Værdi (%) |
Port Alloc (%) |
|
|---|---|---|---|---|---|---|---|---|---|---|
| 2026-02-05 | 13F | Allworth Financial LP | 0 | 0 | ||||||
| 2026-02-13 | 13F | First Trust Advisors Lp | 4.198 | 63,22 | 430 | 64,37 | ||||
| 2026-01-29 | 13F | UBS Group AG | 225.759 | 14,68 | 23.097 | 15,47 | ||||
| 2026-02-12 | 13F | Hudock, Inc. | 2.205 | 0,14 | 226 | 0,90 | ||||
| 2026-02-10 | 13F | Goldman Sachs Group Inc | 216.059 | -69,22 | 22.105 | -69,01 | ||||
| 2026-02-13 | 13F | Mml Investors Services, Llc | 2.903 | -1,12 | 297 | -0,34 | ||||
| 2026-02-17 | 13F | Citadel Advisors Llc | 29.751 | 3.044 | ||||||
| 2026-02-10 | 13F/A | Northwestern Mutual Wealth Management Co | 53.062 | -2,45 | 5.429 | -1,77 | ||||
| 2026-02-17 | 13F | Citadel Advisors Llc | Call | 2.800 | 16,67 | 286 | 17,70 | |||
| 2026-01-21 | 13F | Sowell Financial Services LLC | 6.728 | -1,13 | 688 | -0,43 | ||||
| 2026-01-12 | 13F | DAVENPORT & Co LLC | 12.856 | 8,75 | 1.315 | 9,49 | ||||
| 2026-01-15 | 13F | Gleason Group, Inc. | 308 | 0,33 | 31 | 0,00 | ||||
| 2026-02-11 | 13F | LPL Financial LLC | 406.331 | 3,36 | 41.572 | 4,07 | ||||
| 2026-02-12 | 13F | Hrt Financial Lp | 0 | -100,00 | 0 | |||||
| 2026-02-05 | 13F | Mission Wealth Management, Lp | 2.174 | 0,00 | 222 | 0,91 | ||||
| 2026-02-06 | 13F | Mach-1 Financial Group, Inc. | 0 | -100,00 | 0 | |||||
| 2026-02-12 | 13F | Jane Street Group, Llc | Call | 0 | -100,00 | 0 | ||||
| 2026-02-09 | 13F | Key FInancial Inc | 4.649 | 0,00 | 476 | 0,00 | ||||
| 2025-11-13 | 13F | Helium Advisors LLC | 0 | -100,00 | 0 | |||||
| 2026-02-13 | 13F | Flow Traders U.s. Llc | 6.368 | 1 | ||||||
| 2026-02-17 | 13F | Ameriprise Financial Inc | 62.779 | -90,08 | 6.423 | -90,02 | ||||
| 2025-11-13 | 13F | Baird Financial Group, Inc. | 0 | -100,00 | 0 | -100,00 | ||||
| 2025-11-07 | 13F | Calton & Associates, Inc. | 0 | -100,00 | 0 | |||||
| 2026-01-14 | 13F | Spire Wealth Management | 464 | -13,43 | 47 | -12,96 | ||||
| 2026-02-11 | 13F | Cerity Partners LLC | 3.601 | 0,00 | 368 | 0,82 | ||||
| 2026-02-13 | 13F | Change Path, LLC | 0 | -100,00 | 0 | |||||
| 2026-02-17 | 13F | Integrated Advisors Network LLC | 2.106 | -10,46 | 215 | -9,66 | ||||
| 2026-02-10 | 13F | Envestnet Asset Management Inc | 52.412 | 4,06 | 5.362 | 4,79 | ||||
| 2026-02-17 | 13F | Susquehanna International Group, Llp | 9.438 | 966 | ||||||
| 2026-02-17 | 13F | Susquehanna International Group, Llp | Call | 10.800 | -10,74 | 1.105 | -10,17 | |||
| 2026-02-17 | 13F | Warren Averett Asset Management, LLC | 10.889 | -10,45 | 1.114 | -9,80 | ||||
| 2026-02-10 | 13F | Thoroughbred Financial Services, Llc | 2.222 | 0,00 | 0 | |||||
| 2026-01-29 | 13F | D.a. Davidson & Co. | 7.306 | 3,66 | 747 | 4,33 | ||||
| 2026-02-06 | 13F | IFP Advisors, Inc | 2.176 | 0,09 | 223 | 0,91 | ||||
| 2026-02-13 | 13F | B&D White Capital Company, LLC | 4.202 | -82,02 | 430 | -81,94 | ||||
| 2025-11-14 | 13F | Capstone Investment Advisors, Llc | 2.206 | -75,61 | 224 | -74,80 | ||||
| 2026-01-30 | 13F | American Capital Advisory, LLC | 1.496 | 15,52 | 153 | 16,79 | ||||
| 2026-02-10 | 13F | Avestar Capital, LLC | 82.535 | 0,81 | 8.444 | 1,51 | ||||
| 2026-01-09 | 13F | Spence Asset Management | 2.152 | 0 | ||||||
| 2026-01-27 | 13F | TD Waterhouse Canada Inc. | 4.800 | 0,00 | 491 | 0,00 | ||||
| 2026-01-14 | 13F | Wealthcare Advisory Partners LLC | 2.109 | -3,52 | 216 | -3,15 | ||||
| 2026-02-04 | 13F | Anson Capital, Inc. | 0 | -100,00 | 0 | |||||
| 2026-02-17 | 13F | Ancora Advisors, LLC | 480 | 2,13 | 49 | 4,26 | ||||
| 2026-02-13 | 13F | Kcm Investment Advisors Llc | 2.210 | 0,00 | 226 | 0,89 | ||||
| 2026-02-17 | 13F | D. E. Shaw & Co., Inc. | 5.183 | -11,90 | 530 | -11,22 | ||||
| 2025-10-29 | 13F | LJI Wealth Management, LLC | 0 | -100,00 | 0 | |||||
| 2025-10-31 | 13F | Shoker Investment Counsel, Inc. | 0 | -100,00 | 0 | |||||
| 2026-02-03 | 13F | Total Investment Management Inc | 4.389 | -12,15 | 449 | -11,44 | ||||
| 2026-02-12 | 13F | Wedbush Securities Inc | 2.163 | 0 | ||||||
| 2026-02-13 | 13F | Element Wealth, LLC | 3.966 | 0,00 | 406 | 0,75 | ||||
| 2026-01-12 | 13F | Tilia Fiduciary Partners, Inc. | 3.343 | -10,78 | 342 | -10,00 | ||||
| 2026-02-06 | 13F | Kingdom Financial Group LLC. | 3.003 | 307 | ||||||
| 2026-02-17 | 13F | Regal Investment Advisors LLC | 23.401 | 1,30 | 2.394 | 2,00 | ||||
| 2026-02-12 | 13F | Hollencrest Capital Management | 987 | 0,10 | 101 | 1,00 | ||||
| 2026-02-17 | 13F | Advisor Group Holdings, Inc. | 32.237 | -10,14 | 3.301 | -8,69 | ||||
| 2026-01-30 | 13F | Caldwell Trust Co | 0 | -100,00 | 0 | |||||
| 2026-01-09 | 13F | Marshall Financial Group LLC | 9.420 | -12,57 | 964 | -11,97 | ||||
| 2026-01-16 | 13F | FNY Investment Advisers, LLC | 220 | 0,00 | 0 | |||||
| 2026-01-29 | 13F | Comerica Bank | 12.798 | -7,82 | 1.309 | -7,16 | ||||
| 2026-01-12 | 13F | Seacrest Wealth Management, Llc | 6.419 | 0,00 | 673 | 1,20 | ||||
| 2026-01-13 | 13F | Signature Securities Group Corporation | 14.060 | 0,63 | 1.438 | 1,34 | ||||
| 2026-02-17 | 13F | Two Sigma Investments, Lp | 0 | -100,00 | 0 | |||||
| 2026-02-17 | 13F | Tower Research Capital LLC (TRC) | 3.190 | 326 | ||||||
| 2026-01-15 | 13F | Brady Martz Wealth Solutions, LLC | 2.369 | 0,13 | 242 | 0,83 | ||||
| 2026-02-04 | 13F | Cascade Wealth Advisors, Inc | 2.555 | 0,00 | 271 | 3,83 | ||||
| 2025-11-14 | 13F | Wolverine Trading, Llc | 51.943 | 127,85 | 5.283 | 137,76 | ||||
| 2026-02-11 | 13F | Tradition Wealth Management, LLC | 15.964 | -3,52 | 1.633 | -2,86 | ||||
| 2025-11-14 | 13F | Imprint Wealth LLC | 0 | -100,00 | 0 | |||||
| 2026-02-10 | 13F | DT Investment Partners, LLC | 1.051 | 0,00 | 108 | 0,94 | ||||
| 2026-01-12 | 13F | Focus Financial Network, Inc. | 5.676 | -0,77 | 581 | -0,17 | ||||
| 2026-01-28 | 13F | Retirement Planning Co of New England, Inc. | 8.249 | -0,58 | 844 | 0,00 | ||||
| 2026-01-23 | 13F | Clear Creek Financial Management, LLC | 2.353 | -2,73 | 241 | -2,04 | ||||
| 2026-02-12 | 13F | Promethium Advisors,llc | 3.507 | 0,00 | 359 | 0,56 | ||||
| 2026-01-12 | 13F | Howard Financial Services, Ltd. | 3.771 | 0,16 | 386 | 0,79 | ||||
| 2026-01-26 | 13F | LifeWealth Investments, LLC | 18.928 | 14,47 | 1.937 | 15,24 | ||||
| 2026-02-17 | 13F | Mercer Global Advisors Inc /adv | 4.962 | 508 | ||||||
| 2026-01-08 | 13F | Wealth Enhancement Advisory Services, Llc | 3.234 | 6,84 | 340 | 9,68 | ||||
| 2026-02-11 | 13F | IMA Wealth, Inc. | 63 | 0,00 | 6 | 0,00 | ||||
| 2026-01-23 | 13F | Galvin, Gaustad & Stein, LLC | 2.295 | 0,00 | 235 | 0,43 | ||||
| 2026-02-12 | 13F | Renaissance Technologies Llc | 3.300 | 338 | ||||||
| 2026-02-04 | 13F | Ballast Rock Private Wealth LLC | 5.614 | 574 | ||||||
| 2026-01-20 | 13F | Global Trust Asset Management, LLC | 423 | 0,00 | 43 | 2,38 | ||||
| 2026-01-12 | 13F | Abound Wealth Management | 92 | 0,00 | 9 | 0,00 | ||||
| 2026-02-03 | 13F | SBI Securities Co., Ltd. | 38 | -22,45 | 4 | -25,00 | ||||
| 2026-01-14 | 13F | Kmg Fiduciary Partners, Llc | 6.142 | -0,32 | 628 | 0,32 | ||||
| 2026-01-26 | 13F | Cwm, Llc | 22.316 | -12,61 | 2 | 0,00 | ||||
| 2026-02-03 | 13F | International Assets Investment Management, Llc | 2.685 | 3,87 | 275 | 7,87 | ||||
| 2025-11-12 | 13F | Simplex Trading, Llc | 0 | -100,00 | 0 | |||||
| 2026-01-27 | 13F | Berkshire Money Management, Inc. | 55.368 | -1,68 | 5.665 | -1,00 | ||||
| 2026-02-13 | 13F | Beck Capital Management, Llc | 15.724 | 0,88 | 1.609 | 1,58 | ||||
| 2026-01-05 | 13F | Miller Global Investments, LLC | 559 | 57 | ||||||
| 2026-02-13 | 13F | Citigroup Inc | 100.158 | 12.341,99 | 10.247 | 12.550,62 | ||||
| 2026-02-10 | 13F | Bank of New York Mellon Corp | 6.112 | 4,51 | 625 | 5,22 | ||||
| 2026-02-23 | 13F | Virtu Financial LLC | 23.515 | 2 | ||||||
| 2026-02-17 | 13F | Gladstone Institutional Advisory LLC | 3.613 | -20,10 | 370 | -19,61 | ||||
| 2026-01-23 | 13F | Assetmark, Inc | 620 | 63 | ||||||
| 2026-01-12 | 13F | Sax Wealth Advisors, Llc | 6.854 | 0,00 | 701 | 0,72 | ||||
| 2026-02-17 | 13F | Qube Research & Technologies Ltd | 828 | -93,73 | 85 | -93,74 | ||||
| 2026-01-29 | 13F | Sanctuary Advisors, LLC | 3.767 | 3,35 | 385 | 4,05 | ||||
| 2025-11-04 | 13F | Pineridge Advisors LLC | 29 | 0,00 | 3 | 0,00 | ||||
| 2026-02-09 | 13F | Integrity Advisory Solutions, LLC | 3.492 | 16,17 | 357 | 17,05 | ||||
| 2026-02-17 | 13F | Creative Planning | 45.386 | -8,31 | 4.643 | -7,68 | ||||
| 2026-02-17 | 13F | Bank Of America Corp /de/ | 637.358 | -1,69 | 65.208 | -1,01 | ||||
| 2026-02-12 | 13F | Steward Partners Investment Advisory, Llc | 5.245 | 14,20 | 537 | 15,02 | ||||
| 2026-02-13 | 13F | Wilkerson Advisory Group LLC | 0 | 0 | ||||||
| 2026-02-11 | 13F | Gateway Wealth Partners, LLC | 27.452 | 4,61 | 2.809 | 5,33 | ||||
| 2026-01-27 | 13F | Traphagen Investment Advisors Llc | 4.898 | 16,34 | 501 | 17,33 | ||||
| 2026-02-09 | 13F | Blue Bell Private Wealth Management, Llc | 366 | 0,83 | 37 | 2,78 | ||||
| 2026-02-02 | 13F | Mutual Advisors, LLC | 11.099 | 2,16 | 1.136 | 0,98 | ||||
| 2026-01-15 | 13F | Presidio Capital Management, LLC | 0 | -100,00 | 0 | |||||
| 2026-02-13 | 13F | Arkadios Wealth Advisors | 4.965 | 10,68 | 508 | 11,43 | ||||
| 2025-11-07 | 13F | Beacon Capital Management, LLC | 0 | -100,00 | 0 | |||||
| 2026-01-20 | 13F | Steel Peak Wealth Management LLC | 556.321 | 56.917 | ||||||
| 2025-11-14 | 13F | Raymond James Financial Inc | Put | 0 | -100,00 | 0 | -100,00 | |||
| 2026-02-13 | 13F | Healthcare Of Ontario Pension Plan Trust Fund | 43.000 | 0,00 | 4.399 | 0,69 | ||||
| 2026-01-29 | 13F | Nbc Securities, Inc. | 87 | 0,00 | 9 | 0,00 | ||||
| 2026-02-13 | 13F | Peak Planning Group, LLC | 5.151 | 527 | ||||||
| 2026-02-11 | 13F | Jpmorgan Chase & Co | 2.034 | -89,65 | 208 | -89,58 | ||||
| 2026-02-17 | 13F | Cape Investment Advisory, Inc. | 106 | 0,00 | 11 | 0,00 | ||||
| 2026-02-06 | 13F | Frisch Financial Group, Inc. | 179.620 | -0,49 | 18.377 | 0,19 | ||||
| 2026-03-13 | 13F/A | Pensionmark Financial Group, Llc | 3.222 | 330 | ||||||
| 2026-01-28 | 13F | Migdal Insurance & Financial Holdings Ltd. | 6.117 | -14,46 | 1 | |||||
| 2026-01-08 | 13F | Fulton Bank, N.a. | 9.627 | 8,14 | 985 | 8,85 | ||||
| 2026-02-11 | 13F | Waddell & Associates, Llc | 412.249 | 1,07 | 42.177 | 1,76 | ||||
| 2026-02-17 | 13F | Private Advisor Group, LLC | 4.065 | 62,67 | 416 | 64,03 | ||||
| 2026-01-27 | 13F | Purus Wealth Management, LLC | 2.918 | 0,00 | 299 | 0,68 | ||||
| 2026-01-27 | 13F | Evergreen Capital Management Llc | 3.542 | 0,00 | 362 | 0,84 | ||||
| 2026-02-02 | 13F | Total Clarity Wealth Management, Inc. | 0 | -100,00 | 0 | |||||
| 2026-02-13 | 13F | Integrated Wealth Concepts LLC | 0 | -100,00 | 0 | |||||
| 2026-02-17 | 13F | Susquehanna International Group, Llp | Put | 0 | -100,00 | 0 | ||||
| 2026-02-12 | 13F | CIBC Private Wealth Group, LLC | 250 | 0,00 | 26 | 0,00 | ||||
| 2026-02-14 | 13F | Militia Capital Partners, LP | 27.800 | 2.844 | ||||||
| 2026-02-13 | 13F | RFP Financial Group LLC | 0 | -100,00 | 0 | |||||
| 2026-01-21 | 13F | Kaizen Financial Strategies | 2.479 | 0,20 | 254 | 1,20 | ||||
| 2026-02-17 | 13F | Toronto Dominion Bank | 4 | 0 | ||||||
| 2026-02-04 | 13F | CAP Partners, LLC | 12.683 | -0,72 | 1.298 | -0,08 | ||||
| 2026-02-18 | 13F | Beacon Pointe Advisors, LLC | 53.780 | 5,48 | 5.502 | 6,22 | ||||
| 2026-01-27 | 13F | Paul Damon & Associates, Inc. | 2.816 | 0,00 | 288 | 0,70 | ||||
| 2026-01-30 | 13F | Archer Investment Corp | 32 | 0,00 | 3 | 0,00 | ||||
| 2026-02-13 | 13F | Mariner, LLC | 11.822 | 10,01 | 1.210 | 10,82 | ||||
| 2026-02-14 | 13F | Rockefeller Capital Management L.P. | 12.466 | 0,87 | 1.275 | 1,59 | ||||
| 2026-01-16 | 13F | Crewe Advisors LLC | 1.380 | 0,00 | 141 | 0,71 | ||||
| 2026-01-26 | 13F | Nations Financial Group Inc, /ia/ /adv | 37.085 | -14,55 | 3.794 | -13,97 | ||||
| 2026-02-17 | 13F | Private Capital Management, LLC | 13.856 | 1,65 | 1.418 | 2,31 | ||||
| 2026-02-13 | 13F | Wells Fargo & Company/mn | 1.677 | 383,29 | 172 | 388,57 | ||||
| 2026-02-10 | 13F | Ritter Daniher Financial Advisory LLC / DE | 1.769 | 181 | ||||||
| 2026-02-13 | 13F | QTR Family Wealth, LLC | 10.940 | -13,11 | 1.126 | -12,04 | ||||
| 2026-01-09 | 13F | Carr Financial Group Corp | 9.188 | -26,71 | 940 | -26,16 | ||||
| 2025-10-27 | 13F | Janney Montgomery Scott LLC | 0 | -100,00 | 0 | |||||
| 2026-02-13 | 13F | Parkside Financial Bank & Trust | 434 | 0,00 | 44 | 0,00 | ||||
| 2026-02-11 | 13F | Ameritas Investment Partners, Inc. | 11.450 | 1.171 | ||||||
| 2025-10-29 | 13F | Harel Insurance Investments & Financial Services Ltd. | 0 | -100,00 | 0 | |||||
| 2025-11-14 | 13F | Jane Street Group, Llc | 0 | -100,00 | 0 | -100,00 | ||||
| 2025-11-07 | 13F | Mmbg Investment Advisors Co. | 0 | -100,00 | 0 | |||||
| 2026-02-13 | 13F | Kestra Advisory Services, LLC | 0 | -100,00 | 0 | |||||
| 2026-02-17 | 13F | Optiver Holding B.V. | 0 | -100,00 | 0 | |||||
| 2026-02-13 | 13F | Stifel Financial Corp | 2.865 | 14,55 | 293 | 15,35 | ||||
| 2026-03-24 | 13F | Armis Advisers, LLC | 3.000 | -2,28 | 297 | -6,92 | ||||
| 2026-02-26 | 13F | TD Capital Management LLC | 342 | 0,29 | 35 | 0,00 | ||||
| 2025-11-13 | 13F | Jefferies Financial Group Inc. | 0 | -100,00 | 0 | |||||
| 2026-01-20 | 13F | AdvisorNet Financial, Inc | 724 | 0,00 | 74 | 1,37 | ||||
| 2026-02-06 | 13F | Global Retirement Partners, LLC | 2.616 | 0,11 | 268 | 0,75 | ||||
| 2026-01-29 | 13F | Camelot Portfolios, LLC | 50 | 5 | ||||||
| 2026-02-12 | 13F | Commonwealth Equity Services, Llc | 48.667 | -12,25 | 4.979 | 99.480,00 | ||||
| 2026-02-13 | 13F | Mill Creek Capital Advisors, LLC | 4.522 | 0,00 | 463 | 0,65 | ||||
| 2026-01-14 | 13F | Eastern Bank | 253 | 0,00 | 26 | 0,00 | ||||
| 2025-10-27 | 13F | PKO Investment Management Joint-Stock Co | 0 | -100,00 | 0 | |||||
| 2026-02-17 | 13F | Royal Bank Of Canada | 92.468 | -24,27 | 9.460 | -23,76 | ||||
| 2026-02-09 | 13F | MTM Investment Management, LLC | 6.616 | 9,17 | 677 | 9,92 | ||||
| 2026-02-17 | 13F | Watershed Asset Management, L.L.C. | 116.700 | 11.940 | ||||||
| 2026-01-21 | 13F | Rocky Mountain Advisers, Llc | 203 | 0,00 | 21 | 0,00 | ||||
| 2026-02-12 | 13F | Brinker Capital Investments, LLC | 3.971 | -3,31 | 406 | -2,64 | ||||
| 2026-01-30 | 13F | SOL Capital Management CO | 39.951 | -2,92 | 4 | 0,00 | ||||
| 2026-02-13 | 13F | Ubs Asset Management Americas Inc | 4.075 | 417 | ||||||
| 2025-10-20 | 13F | Quest 10 Wealth Builders, Inc. | 0 | -100,00 | 0 | |||||
| 2026-01-16 | 13F | Morris Retirement Advisors, LLC | 124.104 | 4,16 | 12.697 | 4,87 | ||||
| 2026-01-28 | 13F | Old National Bancorp /in/ | 3.400 | 0,00 | 348 | 0,58 | ||||
| 2026-01-16 | 13F | BridgePort Financial Solutions, LLC | 2.262 | 0,18 | 231 | 0,87 | ||||
| 2026-02-05 | 13F | Paulson Wealth Management Inc. | 10.186 | -6,76 | 1.042 | -6,04 | ||||
| 2026-02-05 | 13F | Western Wealth Management, LLC | 4.103 | -9,84 | 420 | -9,31 | ||||
| 2026-02-17 | 13F | North Capital, Inc. | 0 | -100,00 | 0 | |||||
| 2026-02-02 | 13F | Aurora Private Wealth, Inc. | 2.318 | 0,39 | 0 | |||||
| 2025-11-14 | 13F | Gts Securities Llc | 0 | -100,00 | 0 | -100,00 | ||||
| 2026-01-15 | 13F | Victory Financial Group, Llc | 3.074 | 1,69 | 315 | 2,28 | ||||
| 2026-02-18 | 13F | GWM Advisors LLC | 240 | 0,00 | 25 | 0,00 | ||||
| 2026-02-12 | 13F | Colonial Trust Co / SC | 3.181 | 0,00 | 325 | 0,62 | ||||
| 2026-02-12 | 13F | Front Row Advisors LLC | 164 | 0,00 | 17 | 0,00 | ||||
| 2026-02-13 | 13F | National Bank Of Canada /fi/ | 1.329 | 0,00 | 136 | 0,00 | ||||
| 2026-02-11 | 13F | Buckingham Strategic Partners | 2.369 | 0,13 | 242 | 0,83 | ||||
| 2026-02-04 | 13F | Cascades Capital Asset Management, LLC | 5.228 | -40,05 | 535 | -39,73 | ||||
| 2026-02-05 | 13F | Sound Portfolio Advisors, LLC | 2.099 | 215 | ||||||
| 2026-02-13 | 13F | Morgan Stanley | 695.869 | 40,38 | 71.195 | 41,35 | ||||
| 2026-02-17 | 13F | Raymond James Financial Inc | 27.998 | -6,14 | 2.865 | -5,51 | ||||
| 2026-01-23 | 13F | Prism Advisors, Inc. | 8.246 | -23,63 | 844 | -23,15 | ||||
| 2026-01-06 | 13F | Investors Research Corp | 57 | 0,00 | 6 | 0,00 | ||||
| 2026-02-17 | 13F | Old Mission Capital Llc | 0 | -100,00 | 0 | |||||
| 2026-01-26 | 13F | BCS Wealth Management | 4.042 | 100,00 | 413 | 101,46 | ||||
| 2026-01-12 | 13F | Kaydan Wealth Management, Inc. | 2.405 | 0,33 | 246 | 1,23 | ||||
| 2025-11-10 | 13F | Dana Investment Advisors, Inc. | 0 | -100,00 | 0 | -100,00 | ||||
| 2026-02-12 | 13F | Stonegate Management LLC | 0 | -100,00 | 0 | |||||
| 2026-01-15 | 13F | LeConte Wealth Management, LLC | 73.909 | -11,82 | 7.562 | -11,21 | ||||
| 2026-01-15 | 13F | Cannon Advisors, Inc. | 26.355 | -4,97 | 2.749 | -4,25 | ||||
| 2026-02-04 | 13F | Ameritas Advisory Services, LLC | 7.364 | 19,90 | 753 | 20,67 | ||||
| 2025-11-10 | 13F | Sigma Planning Corp | 0 | -100,00 | 0 | |||||
| 2026-01-28 | 13F | Mystic Asset Management, Inc. | 13.416 | -0,36 | 1.373 | 0,29 | ||||
| 2026-01-29 | 13F | St. Johns Investment Management Company, LLC | 30 | 0,00 | 3 | 0,00 | ||||
| 2026-01-23 | 13F | DHJJ Financial Advisors, Ltd. | 3.944 | 0,64 | 404 | 1,26 | ||||
| 2026-02-11 | 13F | Parallel Advisors, LLC | 5.126 | 0,00 | 524 | 0,77 | ||||
| 2026-02-05 | 13F | Thayer Partners, LLC / MA | 10.277 | 1.051 | ||||||
| 2026-01-09 | 13F | First Heartland Consultants, Inc. | 2.808 | -0,11 | 287 | 0,70 | ||||
| 2026-02-17 | 13F | Jones Financial Companies Lllp | 64.111 | 27,41 | 6.559 | 29,04 | ||||
| 2026-01-28 | 13F | Key Client Fiduciary Advisors, LLC | 2.010 | 0,00 | 206 | 0,49 | ||||
| 2026-01-21 | 13F | Warner Financial, Inc | 15.486 | 0,12 | 2 | 0,00 | ||||
| 2026-01-28 | 13F | HB Wealth Management, LLC | 11.033 | -31,68 | 1.129 | -31,26 | ||||
| 2025-10-21 | 13F | Optimum Investment Advisors | 25 | 0,00 | 3 | 0,00 | ||||
| 2026-02-17 | 13F | Fmr Llc | 3.499 | 5,97 | 358 | 6,57 | ||||
| 2025-10-21 | 13F | Amplius Wealth Advisors, LLC | 0 | -100,00 | 0 | |||||
| 2026-02-17 | 13F | IHT Wealth Management, LLC | 0 | -100,00 | 0 | |||||
| 2026-02-02 | 13F | Truist Financial Corp | 50.932 | 3,82 | 5.211 | 4,53 | ||||
| 2026-02-06 | 13F | HighTower Advisors, LLC | 79.060 | -3,02 | 8.089 | -2,35 | ||||
| 2026-02-11 | 13F | Goodman Advisory Group, LLC | 270 | -10,00 | 28 | -10,00 | ||||
| 2026-01-16 | 13F | Ronald Blue Trust, Inc. | 54 | -51,79 | 6 | -54,55 | ||||
| 2026-02-17 | 13F | Jump Financial, LLC | 21.949 | 2.246 | ||||||
| 2025-10-20 | 13F | Merit Financial Group, LLC | 0 | -100,00 | 0 | |||||
| 2026-02-02 | 13F | Sachetta, LLC | 115 | 0,00 | 12 | 0,00 | ||||
| 2026-02-11 | 13F | Modus Advisors, LLC | 21 | 2 | ||||||
| 2026-02-17 | 13F | Cetera Investment Advisers | 38.155 | 3,92 | 3.904 | 4,64 | ||||
| 2026-02-11 | 13F | Endurance Services Ltd | 347.500 | 0,00 | 35.553 | 0,69 | ||||
| 2025-11-13 | 13F | Quadrature Capital Ltd | 0 | -100,00 | 0 | |||||
| 2026-02-10 | 13F | Bnp Paribas Arbitrage, Sa | 132.914 | 25,07 | 13.598 | 25,93 | ||||
| 2026-02-17 | 13F | Advisory Services Network, LLC | 6.359 | -1,18 | 651 | -0,46 | ||||
| 2026-02-12 | 13F | Bank Of Montreal /can/ | 1.313 | -27,94 | 134 | -27,57 | ||||
| 2026-02-24 | 13F | Astoria Portfolio Advisors LLC. | 0 | -100,00 | 0 | |||||
| 2025-10-07 | 13F | Nova Wealth Management, Inc. | 0 | -100,00 | 0 | |||||
| 2026-01-23 | 13F | Farther Finance Advisors, LLC | 162 | 0,62 | 17 | 0,00 | ||||
| 2025-11-13 | 13F | Riggs Asset Managment Co. Inc. | 0 | -100,00 | 0 | -100,00 | ||||
| 2026-02-23 | 13F | Beaird Harris Wealth Management, LLC | 624 | 0,00 | 64 | 0,00 | ||||
| 2026-01-26 | 13F | Oxinas Partners Wealth Management LLC | 5.228 | -23,66 | 535 | -23,17 | ||||
| 2026-02-10 | 13F | Florida Financial Advisors, Llc | 2.578 | -30,55 | 264 | -30,24 | ||||
| 2026-02-12 | 13F | BlackRock, Inc. | 0 | -100,00 | 0 | |||||
| 2026-02-17 | 13F | Citadel Advisors Llc | Put | 3.400 | 30,77 | 348 | 31,44 | |||
| 2026-01-29 | 13F | Calamos Advisors LLC | Call | 71.800 | -0,83 | 7.296 | 2,50 | |||
| 2026-02-13 | 13F | STAR Financial Bank | 4.336 | 0,00 | 444 | 0,68 | ||||
| 2026-02-05 | 13F | Cambridge Investment Research Advisors, Inc. | 19.135 | 15,10 | 2 | 0,00 | ||||
| 2026-02-09 | 13F | Kingsview Wealth Management, LLC | 3.076 | 4,55 | 315 | 5,37 | ||||
| 2026-02-12 | 13F | Principal Securities, Inc. | 0 | -100,00 | 0 | |||||
| 2026-01-28 | 13F | White Pine Investment CO | 34.649 | 2,63 | 4 | 0,00 | ||||
| 2026-02-26 | 13F | Anchor Investment Management, LLC | 3 | 0,00 | 0 | |||||
| 2026-01-26 | 13F | Harbor Asset Planning, Inc. | 632 | 0,16 | 65 | 0,00 | ||||
| 2026-01-28 | 13F | Geneos Wealth Management Inc. | 429 | 0,00 | 44 | 0,00 | ||||
| 2026-02-02 | 13F | Pittenger & Anderson Inc | 735 | 75 |