Grundlæggende statistik
| Institutionelle aktier (lange) | 41.807.649 - 58,69% (ex 13D/G) - change of -4,66MM shares -10,03% MRQ |
| Institutionel værdi (lang) | $ 860.645 USD ($1000) |
Institutionelt ejerskab og aktionærer
Pagaya Technologies Ltd. (US:PGY) har 246 institutionelle ejere og aktionærer, der har indsendt 13D/G- eller 13F-formularer til Securities Exchange Commission (SEC). Disse institutioner har i alt 41,807,649 aktier. Største aktionærer omfatter BlackRock, Inc., Vanguard Group Inc, Millennium Management Llc, American Century Companies Inc, Goldman Sachs Group Inc, Renaissance Technologies Llc, Susquehanna International Group, Llp, Morgan Stanley, Nuveen, LLC, and Two Sigma Investments, Lp .
Pagaya Technologies Ltd. (NasdaqCM:PGY) institutionel ejerskabsstruktur viser aktuelle positioner i virksomheden efter institutioner og fonde, samt seneste ændringer i positionsstørrelse. Større aktionærer kan omfatte individuelle investorer, investeringsforeninger, hedgefonde eller institutioner. Skema 13D angiver, at investoren besidder (eller besidder) mere end 5 % af virksomheden og har til hensigt (eller har til hensigt at) aktivt at forfølge en ændring i forretningsstrategi. Skema 13G indikerer en passiv investering på over 5%.
The share price as of April 8, 2026 is 12,39 / share. Previously, on April 9, 2025, the share price was 10,14 / share. This represents an increase of 22,19% over that period.

Fondens stemningsscore
Fund Sentiment Score (fka Ownership Accumulation Score) finder de aktier, der bliver mest købt af fonde. Det er resultatet af en sofistikeret, multi-faktor kvantitativ model, der identificerer virksomheder med de højeste niveauer af institutionel akkumulering. Scoringsmodellen bruger en kombination af den samlede stigning i oplyste ejere, ændringerne i porteføljeallokeringer i disse ejere og andre målinger. Tallet går fra 0 til 100, hvor højere tal indikerer et højere niveau af akkumulering for sine jævnaldrende, og 50 er gennemsnittet.
Opdateringsfrekvens: Dagligt
Se Ownership Explorer, som giver en liste over højest rangerende virksomheder.
AI+ Ask Fintel’s AI assistant about Pagaya Technologies Ltd..
Select a question to share a public post with an AI-crafted answer.
Thinking of good questions…
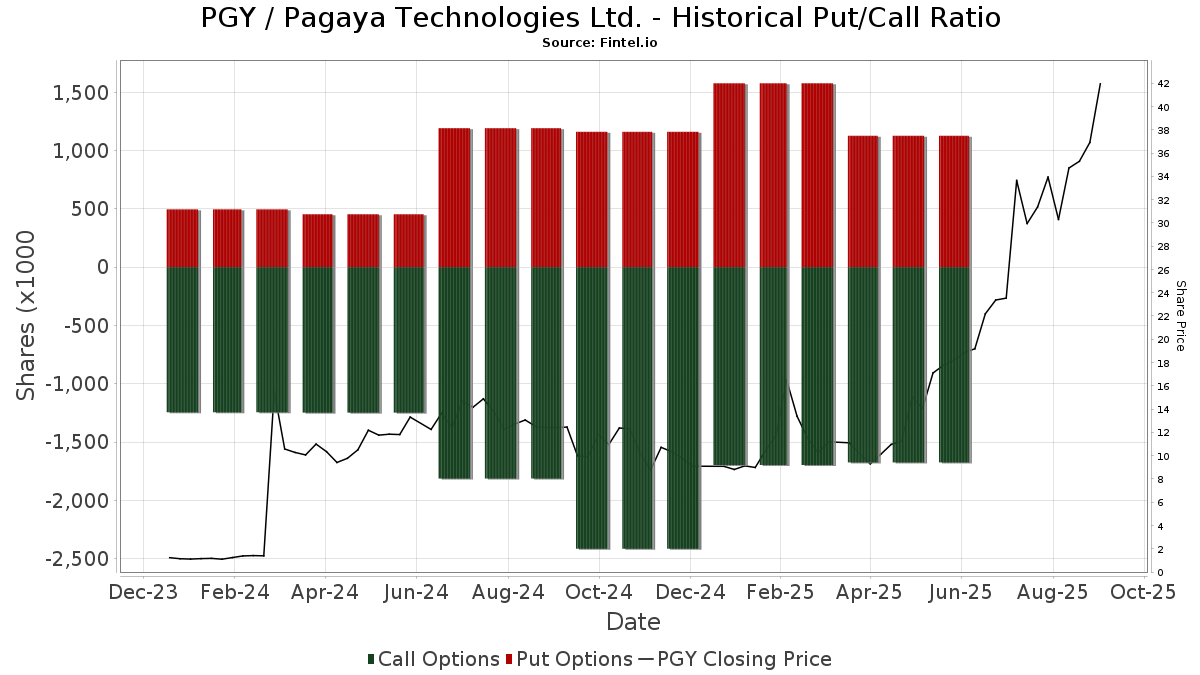
Institutionel Put/Call-forhold
Ud over at indberette standardaktie- og gældsudstedelser skal institutter med mere end 100 mill. aktiver under forvaltning også oplyse deres put- og call-optionsbeholdninger. Da salgsoptioner generelt indikerer negativ stemning, og købsoptioner indikerer positiv stemning, kan vi få en fornemmelse af den overordnede institutionelle stemning ved at plotte forholdet mellem put og kald. Diagrammet til højre viser det historiske put/call-forhold for dette instrument.
Brug af Put/Call Ratio som en indikator for investorernes stemning overvinder en af de vigtigste mangler ved at bruge totalt institutionelt ejerskab, som er, at en betydelig mængde af aktiver under forvaltning investeres passivt for at spore indekser. Passivt forvaltede fonde køber typisk ikke optioner, så indikatoren for put/call-forholdet følger mere nøje følelsen af aktivt forvaltede fonde.
13D/G-arkivering
Vi præsenterer 13D/G ansøgninger separat fra 13F ansøgninger på grund af den forskellige behandling af SEC. 13D/G-ansøgninger kan indgives af grupper af investorer (med én ledende), hvorimod 13F-ansøgninger ikke kan. Dette resulterer i situationer, hvor en investor kan indsende en 13D/G, der rapporterer én værdi for de samlede aktier (der repræsenterer alle de aktier, der ejes af investorgruppen), men derefter indsender en 13F, der rapporterer en anden værdi for de samlede aktier (der udelukkende repræsenterer deres egne) ejendomsret). Det betyder, at aktieejerskab af 13D/G-arkiver og 13F-arkiveringer ofte ikke er direkte sammenlignelige, så vi præsenterer dem separat.
Bemærk: Fra den 16. maj 2021 viser vi ikke længere ejere, der ikke har indsendt en 13D/G inden for det seneste år. Tidligere viste vi den fulde historie af 13D/G-arkiver. Generelt skal enheder, der er forpligtet til at indgive 13D/G-ansøgninger, indgive mindst årligt, før de indsender en afsluttende ansøgning. Dog forlader fonde nogle gange positioner uden at indsende en afsluttende ansøgning (dvs. de afvikler), så visning af den fulde historie resulterede nogle gange i forvirring om det nuværende ejerskab. For at undgå forvirring viser vi nu kun 'aktuelle' ejere - det vil sige - ejere, der har anmeldt inden for det seneste år.
Upgrade to unlock premium data.
| Fil dato | Form | Investor | Forrige Aktier |
Seneste Aktier |
Δ Aktier (Procent) |
Ejendomsret (Procent) |
Δ Ejerskab (Procent) |
|
|---|---|---|---|---|---|---|---|---|
| 2025-11-13 | Viola Ventures V.C. Management 4 Ltd. | 6,364,797 | 499,227 | -92.16 | 0.80 | -91.84 | ||
| 2025-09-22 | OAK HC/FT PARTNERS II, L.P. | 126,490,534 | 4,215,672 | -96.67 | 6.00 | -68.75 | ||
| 2025-08-14 | FRONTIER CAPITAL MANAGEMENT CO LLC | 4,059,930 | 2,574,395 | -36.59 | 4.08 | -37.04 | ||
| 2025-07-02 | GIC Private Ltd | 4,042,526 | 386,834 | -90.43 | 0.61 | -90.73 | ||
| 2025-04-24 | BlackRock, Inc. | 3,203,156 | 2,253,363 | -29.65 | 3.60 | -32.08 |
13F og NPORT arkivering
Detaljer om 13F-arkivering er gratis. Detaljer om NP-ansøgninger kræver et premium-medlemskab. Grønne rækker angiver nye positioner. Røde rækker angiver lukkede positioner. Klik på linket ikon for at se den fulde transaktionshistorik.
Opgrader
for at låse premium-data op og eksportere til Excel ![]() .
.
| Fil dato | Kilde | Investor | Type | Gennemsnitlig pris (Øst) |
Aktier | Δ Aktier (%) |
Rapporteret Værdi ($1000) |
Δ Værdi (%) |
Port Alloc (%) |
|
|---|---|---|---|---|---|---|---|---|---|---|
| 2026-02-12 | 13F | Federation des caisses Desjardins du Quebec | 0 | -100,00 | 0 | -100,00 | ||||
| 2025-10-30 | 13F | Twin Peaks Wealth Advisors, LLC | 0 | -100,00 | 0 | -100,00 | ||||
| 2025-11-14 | 13F | Cubist Systematic Strategies, LLC | Call | 15.500 | 460 | |||||
| 2026-02-02 | 13F | Hussman Strategic Advisors, Inc. | 0 | -100,00 | 0 | |||||
| 2026-02-10 | 13F | Root Financial Partners, LLC | 1.314 | 27 | ||||||
| 2026-02-13 | 13F | Ubs Asset Management Americas Inc | 75.617 | 1.580 | ||||||
| 2026-02-13 | 13F | Brown Advisory Inc | 16.518 | 0,00 | 345 | -29,59 | ||||
| 2026-02-23 | 13F | Virtu Financial LLC | 51.898 | 60,25 | 1 | |||||
| 2026-02-13 | 13F | MAI Capital Management | 10 | 0 | ||||||
| 2026-02-09 | 13F | Legal & General Group Plc | 110.545 | 165,86 | 2.310 | 87,20 | ||||
| 2026-02-20 | 13F | Sunbelt Securities, Inc. | 29 | 0,00 | 1 | |||||
| 2025-11-14 | 13F | Wolverine Trading, Llc | Put | 66.300 | 245,31 | 2.106 | 413,41 | |||
| 2026-02-17 | 13F | Symmetry Peak Management Llc | Call | 0 | -100,00 | 0 | -100,00 | |||
| 2026-02-13 | 13F | Landscape Capital Management, L.l.c. | 87.260 | 1.824 | ||||||
| 2026-01-26 | 13F | Cwm, Llc | 8.848 | 4,93 | 0 | |||||
| 2026-02-13 | 13F | Sterling Capital Management LLC | 14.383 | 12.741,96 | 301 | 9.900,00 | ||||
| 2025-11-14 | 13F | Wolverine Trading, Llc | 42.974 | 65,27 | 1.365 | 145,32 | ||||
| 2026-01-15 | 13F | Nisa Investment Advisors, Llc | 5.510 | -17,47 | 115 | -41,92 | ||||
| 2026-02-12 | 13F | Scotia Capital Inc. | 0 | -100,00 | 0 | -100,00 | ||||
| 2025-11-14 | 13F | Wolverine Trading, Llc | Call | 306.400 | 173,08 | 9.731 | 305,63 | |||
| 2026-02-12 | 13F | Polen Capital Management Llc | 63.497 | -16,31 | 1.327 | -41,07 | ||||
| 2026-02-02 | 13F | Wolverine Asset Management Llc | 403 | 0,00 | 8 | -27,27 | ||||
| 2026-02-03 | 13F | Pilgrim Partners Asia Pte Ltd | 3.300 | 0,00 | 69 | -29,90 | ||||
| 2026-02-05 | 13F | Cambridge Investment Research Advisors, Inc. | 12.221 | 41,84 | 0 | |||||
| 2026-02-17 | 13F | Ameriprise Financial Inc | 151.761 | 60,19 | 3.172 | 12,77 | ||||
| 2026-02-17 | 13F | Engineers Gate Manager LP | 104.578 | -35,96 | 2.186 | -54,93 | ||||
| 2026-02-17 | 13F | Lazard Asset Management Llc | Put | 80.000 | 220,00 | 1.672 | 125,34 | |||
| 2026-02-17 | 13F | Lazard Asset Management Llc | 14.428 | -25,38 | 302 | -47,56 | ||||
| 2026-02-13 | 13F | Barclays Plc | 91.008 | 1.902 | ||||||
| 2026-02-13 | 13F | Charles Schwab Investment Management Inc | 127.692 | 12,10 | 2.669 | -21,11 | ||||
| 2026-02-17 | 13F | Lazard Asset Management Llc | Call | 100.000 | 2.090 | |||||
| 2026-02-12 | 13F | New York State Common Retirement Fund | 35.263 | -40,17 | 737 | -57,92 | ||||
| 2026-02-13 | 13F | FORA Capital, LLC | 42.751 | 893 | ||||||
| 2026-02-13 | 13F | Entropy Technologies, LP | 25.139 | -11,05 | 525 | -37,43 | ||||
| 2026-02-17 | 13F | Optiver Holding B.V. | 130 | -49,22 | 3 | -71,43 | ||||
| 2026-02-11 | 13F | Ameritas Investment Partners, Inc. | 3.845 | 80 | ||||||
| 2026-02-11 | 13F | Winton Capital Group Ltd | 27.900 | 583 | ||||||
| 2026-02-13 | 13F | Mml Investors Services, Llc | 40.328 | 843 | ||||||
| 2026-02-10 | 13F | Savant Capital, LLC | 0 | -100,00 | 0 | |||||
| 2026-02-13 | 13F | Ieq Capital, Llc | 19.984 | -9,35 | 418 | -36,24 | ||||
| 2026-02-17 | 13F | G2 Investment Partners Management LLC | 500.000 | -23,19 | 10.450 | -45,93 | ||||
| 2026-02-17 | 13F | MIRAE ASSET GLOBAL ETFS HOLDINGS Ltd. | 58.432 | 1,35 | 1.221 | -28,64 | ||||
| 2026-02-12 | 13F | Ensign Peak Advisors, Inc | 8.700 | -96,81 | 182 | -97,76 | ||||
| 2026-02-17 | 13F | Advisor Group Holdings, Inc. | 30.964 | 308,23 | 647 | 156,75 | ||||
| 2026-02-11 | 13F | Havemeyer Place LP | 28.033 | 586 | ||||||
| 2026-02-13 | 13F | Next Century Growth Investors Llc | 283.680 | -57,06 | 5.929 | -69,78 | ||||
| 2026-03-13 | 13F/A | Pensionmark Financial Group, Llc | 55.688 | 1.164 | ||||||
| 2026-01-07 | 13F | Massmutual Trust Co Fsb/adv | 0 | -100,00 | 0 | -100,00 | ||||
| 2026-01-22 | 13F | Financial Consulate, Inc | 100 | 0 | ||||||
| 2026-01-30 | 13F | New York State Teachers Retirement System | 4.189 | 0 | ||||||
| 2026-02-10 | 13F | Intech Investment Management Llc | 22.080 | 38,89 | 461 | -2,33 | ||||
| 2026-02-17 | 13F | ExodusPoint Capital Management, LP | 0 | -100,00 | 0 | -100,00 | ||||
| 2026-02-11 | 13F | Simplex Trading, Llc | 90.760 | -46,78 | 1.897 | 37.820,00 | ||||
| 2026-02-04 | 13F | Virginia Retirement Systems Et Al | 0 | -100,00 | 0 | -100,00 | ||||
| 2026-02-09 | 13F | Huntington National Bank | 375 | 0,00 | 8 | -36,36 | ||||
| 2026-02-17 | 13F | PharVision Advisers, LLC | 24.617 | 514 | ||||||
| 2026-02-02 | 13F | Principal Financial Group Inc | 120.662 | 53,62 | 2.522 | 8,10 | ||||
| 2026-02-11 | 13F | Jpmorgan Chase & Co | 521.452 | -50,47 | 10.898 | -65,13 | ||||
| 2026-02-17 | 13F | Quadrature Capital Ltd | 24.564 | 513 | ||||||
| 2026-01-29 | 13F | Vanguard Group Inc | 2.043.341 | -0,71 | 42.706 | -30,11 | ||||
| 2026-02-17 | 13F | XTX Topco Ltd | 18.530 | 49,80 | 387 | 5,45 | ||||
| 2026-01-29 | 13F | UBS Group AG | Call | 53.500 | 0,00 | 1.118 | -29,60 | |||
| 2026-02-17 | 13F | Fmr Llc | 2.574 | 20,00 | 54 | -15,87 | ||||
| 2025-11-07 | 13F | NewEdge Wealth, LLC | 0 | -100,00 | 0 | -100,00 | ||||
| 2026-01-29 | 13F | UBS Group AG | 815.788 | 5,60 | 17.050 | -25,66 | ||||
| 2026-02-17 | 13F | Private Advisor Group, LLC | 18.398 | 83,06 | 385 | 28,86 | ||||
| 2026-02-13 | 13F | State Street Corp | 895.925 | 10,82 | 18.725 | -21,99 | ||||
| 2026-02-17 | 13F | Private Advisor Group, LLC | Call | 35.000 | 600,00 | 73 | -26,26 | |||
| 2026-02-06 | 13F | Lsv Asset Management | 1.200 | 0,00 | 0 | |||||
| 2025-11-14 | 13F | National Bank Of Canada /fi/ | 0 | -100,00 | 0 | -100,00 | ||||
| 2026-02-10 | 13F | Globeflex Capital L P | 139.106 | -23,98 | 2.907 | -46,49 | ||||
| 2026-02-13 | 13F | University Of Texas/texas Am Investment Managment Co | 943 | 20 | ||||||
| 2026-02-13 | 13F | Squarepoint Ops LLC | 506.902 | 407,98 | 10.594 | 257,66 | ||||
| 2026-01-30 | 13F | Sigma Planning Corp | 0 | -100,00 | 0 | -100,00 | ||||
| 2026-02-02 | 13F | Truist Financial Corp | 11.562 | 242 | ||||||
| 2026-02-11 | 13F | Fox Run Management, L.l.c. | 0 | -100,00 | 0 | -100,00 | ||||
| 2026-02-03 | 13F | Mitsubishi UFJ Kokusai Asset Management Co., Ltd. | 23.004 | 0,00 | 513 | -24,93 | ||||
| 2026-02-13 | 13F | Panagora Asset Management Inc | 215.304 | 362,16 | 4.500 | 225,31 | ||||
| 2026-02-13 | 13F | First Trust Advisors Lp | 40.879 | 8,88 | 854 | -23,34 | ||||
| 2026-02-13 | 13F | Squarepoint Ops LLC | Call | 12.500 | 12,61 | 261 | -20,67 | |||
| 2026-02-13 | 13F | Kestra Advisory Services, LLC | 7.798 | 163 | ||||||
| 2025-11-04 | 13F | United Community Bank | 0 | -100,00 | 0 | -100,00 | ||||
| 2025-10-23 | 13F | SG Americas Securities, LLC | 0 | -100,00 | 0 | |||||
| 2026-01-15 | 13F | Allspring Global Investments Holdings, LLC | 426.089 | 3.179,37 | 9.493 | 2.346,65 | ||||
| 2026-02-13 | 13F | Mariner, LLC | 10.107 | 211 | ||||||
| 2026-02-11 | 13F | Meeder Asset Management Inc | 515 | 11 | ||||||
| 2026-02-17 | 13F | Oberweis Asset Management Inc/ | 305.600 | 60,84 | 6.387 | 13,22 | ||||
| 2026-02-17 | 13F | SIH Partners, LLLP | 14.621 | 306 | ||||||
| 2026-02-17 | 13F | Harbourvest Partners Llc | 0 | -100,00 | 0 | -100,00 | ||||
| 2026-01-29 | 13F | Nbc Securities, Inc. | 6.121 | -30,29 | 128 | -51,15 | ||||
| 2026-01-29 | 13F | Cornerstone Investment Partners, LLC | 0 | -100,00 | 0 | |||||
| 2026-02-13 | 13F | Healthcare Of Ontario Pension Plan Trust Fund | 187.072 | 3.910 | ||||||
| 2026-02-13 | 13F | Wells Fargo & Company/mn | 66.242 | -51,87 | 1.384 | -66,13 | ||||
| 2026-02-17 | 13F | Eddie Patel Inc | 41.607 | 870 | ||||||
| 2026-01-28 | 13F | Arizona State Retirement System | 14.295 | 2,19 | 299 | -28,19 | ||||
| 2026-01-15 | 13F | Founders Capital Management | 600 | 13 | ||||||
| 2026-02-17 | 13F | J. Goldman & Co LP | 25.000 | 522 | ||||||
| 2026-02-05 | 13F | Amalgamated Bank | 1.604 | 14,74 | 0 | |||||
| 2026-02-17 | 13F | Boothbay Fund Management, Llc | Call | 0 | -100,00 | 0 | ||||
| 2026-02-17 | 13F | Driehaus Capital Management Llc | 0 | -100,00 | 0 | -100,00 | ||||
| 2026-02-11 | 13F | Franklin Resources Inc | 30.943 | 35,92 | 647 | -4,30 | ||||
| 2026-02-17 | 13F | Persistent Asset Partners Ltd | 0 | -100,00 | 0 | -100,00 | ||||
| 2026-02-13 | 13F | Ubs Oconnor Llc | 0 | -100,00 | 0 | |||||
| 2026-02-17 | 13F | Voloridge Investment Management, Llc | 442.546 | -44,74 | 9.249 | -61,10 | ||||
| 2026-02-13 | 13F | Transamerica Financial Advisors, Inc. | 1.447 | 30 | ||||||
| 2026-02-17 | 13F | Northern Trust Corp | 323.708 | 3.591,50 | 6.765 | 2.501,92 | ||||
| 2026-01-28 | 13F | Teacher Retirement System Of Texas | 15.951 | 333 | ||||||
| 2026-02-17 | 13F | Boothbay Fund Management, Llc | 145.688 | -48,97 | 3.045 | -64,08 | ||||
| 2026-02-17 | 13F | Balyasny Asset Management Llc | 59.575 | 2,17 | 1.245 | -28,08 | ||||
| 2026-02-06 | 13F | Pnc Financial Services Group, Inc. | 422 | 7,93 | 9 | -27,27 | ||||
| 2026-02-13 | 13F | Walleye Trading LLC | Call | 83.300 | 903,61 | 1.741 | 607,32 | |||
| 2026-02-11 | 13F | Picton Mahoney Asset Management | 43.415 | 93,84 | 907 | |||||
| 2026-02-13 | 13F | Walleye Trading LLC | Put | 53.300 | -38,17 | 1.114 | -56,51 | |||
| 2026-02-10 | 13F | Acadian Asset Management Llc | 23.074 | -11,86 | 0 | |||||
| 2026-02-17 | 13F | Dark Forest Capital Management Lp | 0 | -100,00 | 0 | -100,00 | ||||
| 2026-02-17 | 13F | Mangrove Partners | 28.847 | 603 | ||||||
| 2026-02-18 | 13F | GWM Advisors LLC | 151 | -97,40 | 3 | -98,26 | ||||
| 2026-02-17 | 13F | Two Sigma Advisers, Lp | 1.192.124 | -11,08 | 24.915 | -37,40 | ||||
| 2025-11-13 | 13F | Martingale Asset Management L P | 0 | -100,00 | 0 | |||||
| 2026-02-17 | 13F | Caption Management, LLC | Call | 499.000 | 149,50 | 10.429 | 75,63 | |||
| 2026-02-17 | 13F | Cetera Investment Advisers | 12.095 | -79,86 | 253 | -85,87 | ||||
| 2026-04-07 | 13F | Signaturefd, Llc | 0 | -100,00 | 0 | |||||
| 2026-01-26 | 13F | Asset Dedication, LLC | 25 | 1 | ||||||
| 2026-02-12 | 13F | Ironwood Investment Management Llc | 59.503 | -0,21 | 1.244 | -29,77 | ||||
| 2026-02-17 | 13F | Freestone Grove Partners LP | 22.132 | 463 | ||||||
| 2026-02-13 | 13F | Prudential Financial Inc | 46.610 | -80,46 | 974 | -86,24 | ||||
| 2026-04-08 | 13F | Hamilton Lane Advisors Llc | 0 | -100,00 | 0 | |||||
| 2026-02-12 | 13F | Jane Street Group, Llc | Put | 297.600 | 26,85 | 6.220 | -10,71 | |||
| 2026-02-11 | 13F | Parallel Advisors, LLC | 74 | -46,76 | 2 | -75,00 | ||||
| 2026-02-12 | 13F | Jane Street Group, Llc | Call | 364.608 | 55,88 | 7.620 | 9,74 | |||
| 2026-02-06 | 13F | EverSource Wealth Advisors, LLC | 570 | 8,57 | 12 | -26,67 | ||||
| 2026-02-06 | 13F | Aflac Inc | 130.324 | 0,00 | 2.724 | -29,62 | ||||
| 2026-02-17 | 13F | Harvest Investment Services, LLC | 0 | -100,00 | 0 | -100,00 | ||||
| 2026-02-17 | 13F | Citadel Advisors Llc | Put | 778.012 | 0,51 | 16.260 | -29,25 | |||
| 2026-02-17 | 13F | PDT Partners, LLC | 203.044 | 0,00 | 4.244 | -29,61 | ||||
| 2026-02-13 | 13F | SRS Capital Advisors, Inc. | 5 | -99,82 | 0 | -100,00 | ||||
| 2026-02-17 | 13F | Qube Research & Technologies Ltd | 1.046.548 | 459,02 | 21.873 | 293,52 | ||||
| 2026-02-12 | 13F | Hrt Financial Lp | 80.692 | -71,03 | 2 | -87,50 | ||||
| 2026-02-13 | 13F | Smartleaf Asset Management LLC | 365 | 2.047,06 | 8 | |||||
| 2026-02-17 | 13F | Citadel Advisors Llc | Call | 544.820 | 23,05 | 11.387 | -13,38 | |||
| 2026-02-17 | 13F | Citadel Advisors Llc | 810.474 | -16,73 | 16.939 | -41,38 | ||||
| 2026-02-11 | 13F | Cookson Peirce & Co Inc | 0 | -100,00 | 0 | |||||
| 2025-11-13 | 13F | Shannon River Fund Management LLC | 0 | -100,00 | 0 | |||||
| 2026-02-12 | 13F | Counterpoint Mutual Funds LLC | 0 | -100,00 | 0 | -100,00 | ||||
| 2026-02-13 | 13F | Rhumbline Advisers | 58.438 | -6,97 | 1.221 | -34,50 | ||||
| 2026-02-10 | 13F | Main Management ETF Advisors, LLC | 72.036 | 1,03 | 2 | -50,00 | ||||
| 2026-02-17 | 13F | Scientech Research LLC | 10.191 | 213 | ||||||
| 2026-02-17 | 13F | Tower Research Capital LLC (TRC) | 2.438 | 123,26 | 51 | 56,25 | ||||
| 2026-01-09 | 13F | Diversified Trust Co | 9.707 | 203 | ||||||
| 2026-01-30 | 13F | R Squared Ltd | 0 | -100,00 | 0 | -100,00 | ||||
| 2026-02-10 | 13F | Commonwealth Of Pennsylvania Public School Empls Retrmt Sys | 0 | -100,00 | 0 | -100,00 | ||||
| 2026-02-11 | 13F | Group One Trading, L.p. | 6.848 | -96,46 | 143 | -97,51 | ||||
| 2026-02-09 | 13F | Emerald Mutual Fund Advisers Trust | 31.165 | 0,00 | 651 | -29,62 | ||||
| 2026-02-10 | 13F | B. Riley Financial, Inc. | 17.700 | 370 | ||||||
| 2026-02-13 | 13F | DLD Asset Management, LP | Put | 551.000 | 66,47 | 11.510 | 17,15 | |||
| 2026-02-17 | 13F | Jump Financial, LLC | 315.827 | -24,89 | 6.601 | -47,13 | ||||
| 2026-02-17 | 13F | Algert Global Llc | 106.920 | 104,51 | 2 | 100,00 | ||||
| 2026-01-30 | 13F | Us Bancorp \de\ | 37 | 1 | ||||||
| 2026-02-04 | 13F | Bailard, Inc. | 12.500 | 81,16 | 261 | 27,94 | ||||
| 2026-02-17 | 13F | Aqr Capital Management Llc | 199.119 | -3,11 | 4.162 | -31,80 | ||||
| 2026-01-28 | 13F | Geneos Wealth Management Inc. | 4.155 | 87 | ||||||
| 2026-02-17 | 13F | Capital Fund Management S.a. | Call | 74.800 | 157,04 | 1.563 | 81,11 | |||
| 2026-01-26 | 13F | KBC Group NV | 1.805 | 0,00 | 0 | |||||
| 2026-02-13 | 13F | Clal Insurance Enterprises Holdings Ltd | 0 | -100,00 | 0 | |||||
| 2026-02-17 | 13F | Capital Fund Management S.a. | Put | 52.400 | 72,94 | 1.095 | 21,80 | |||
| 2026-02-13 | 13F | Public Sector Pension Investment Board | 139.441 | 2.914 | ||||||
| 2026-02-17 | 13F | California State Teachers Retirement System | 177.990 | 2,59 | 3.720 | -27,80 | ||||
| 2026-02-13 | 13F | Walleye Capital LLC | Call | 107.300 | 131,75 | 2.243 | 63,17 | |||
| 2026-02-13 | 13F | Walleye Capital LLC | Put | 47.300 | 22,22 | 989 | -14,01 | |||
| 2026-01-29 | 13F | IMC-Chicago, LLC | 14.054 | -86,54 | 294 | -90,55 | ||||
| 2026-02-12 | 13F | Jane Street Group, Llc | 1.216.444 | -39,49 | 25.424 | -57,41 | ||||
| 2026-02-17 | 13F | Millennium Management Llc | 1.738.760 | 110,87 | 36.340 | 48,44 | ||||
| 2026-02-13 | 13F | Walleye Capital LLC | 404.224 | 93,81 | 8.448 | 36,43 | ||||
| 2026-02-17 | 13F | Point72 Asset Management, L.P. | 975.087 | 20.379 | ||||||
| 2026-02-17 | 13F | State Of Wisconsin Investment Board | 45.187 | 194,51 | 944 | 107,47 | ||||
| 2026-01-29 | 13F | Pictet Asset Management Holding SA | 42.900 | 424,83 | 897 | 270,25 | ||||
| 2026-02-17 | 13F | D. E. Shaw & Co., Inc. | 574.789 | -72,33 | 12.013 | -80,53 | ||||
| 2026-02-10 | 13F | Meitav Dash Investments Ltd | 0 | -100,00 | 0 | -100,00 | ||||
| 2026-02-17 | 13F | Point72 Asset Management, L.P. | Call | 19.500 | 408 | |||||
| 2026-02-17 | 13F | D. E. Shaw & Co., Inc. | Put | 52.600 | -56,06 | 1.099 | -69,07 | |||
| 2026-02-10 | 13F | Skaana Management L.P. | Call | 2.300 | 0,00 | 48 | -29,41 | |||
| 2026-02-12 | 13F | Commonwealth Equity Services, Llc | 31.074 | -0,45 | 649 | |||||
| 2026-02-10 | 13F | Skaana Management L.P. | Put | 11.000 | 0,00 | 230 | -29,75 | |||
| 2026-02-17 | 13F | Utah Retirement Systems | 116.393 | 0,00 | 2.433 | -29,61 | ||||
| 2026-02-17 | 13F | Aster Capital Management (DIFC) Ltd | 1.392 | 351,95 | 29 | 222,22 | ||||
| 2026-02-12 | 13F | BlackRock, Inc. | 4.005.114 | 13,52 | 83.707 | -20,09 | ||||
| 2026-01-28 | 13F | Klp Kapitalforvaltning As | 10.875 | 16,00 | 227 | -18,35 | ||||
| 2026-02-13 | 13F | Peak6 Llc | Call | 0 | -100,00 | 0 | ||||
| 2025-11-12 | 13F | HAP Trading, LLC | Put | 14.400 | 52 | |||||
| 2026-02-02 | 13F | Mutual Advisors, LLC | 32.867 | -11,42 | 687 | -37,35 | ||||
| 2026-02-12 | 13F | Federated Hermes, Inc. | 765.577 | 27,57 | 16.001 | -10,20 | ||||
| 2026-02-13 | 13F | Citigroup Inc | 25.200 | 70,71 | 527 | 20,09 | ||||
| 2026-02-17 | 13F | Aquatic Capital Management LLC | 9.105 | -45,17 | 190 | -61,46 | ||||
| 2026-01-12 | 13F | Moody National Bank Trust Division | 28.978 | 2,35 | 606 | -27,98 | ||||
| 2026-02-10 | 13F | Skaana Management L.P. | 0 | -100,00 | 0 | -100,00 | ||||
| 2026-02-10 | 13F | Rothschild Investment Llc | 143 | -1,38 | 3 | -50,00 | ||||
| 2026-02-05 | 13F | Bessemer Group Inc | 53.993 | 0,00 | 1 | 0,00 | ||||
| 2026-02-11 | 13F | Empowered Funds, LLC | 2.502 | 52 | ||||||
| 2026-02-17 | 13F | D. E. Shaw & Co., Inc. | Call | 25.600 | -78,21 | 535 | -84,66 | |||
| 2026-02-17 | 13F | Jain Global LLC | 24.251 | 195,38 | 507 | 108,23 | ||||
| 2026-02-17 | 13F | Capital Fund Management S.a. | 187.289 | 3.914 | ||||||
| 2026-02-09 | 13F | Hartland & Co., LLC | 0 | -100,00 | 0 | |||||
| 2026-02-12 | 13F | MetLife Investment Management, LLC | 27.845 | 3,21 | 582 | -27,37 | ||||
| 2026-02-17 | 13F | PMC FIG Opportunities LLC | 0 | -100,00 | 0 | |||||
| 2026-02-17 | 13F | Two Sigma Investments, Lp | 1.222.314 | -15,85 | 25.546 | -40,77 | ||||
| 2026-03-16 | 13F/A | Rockefeller Capital Management L.P. | 126 | 3 | ||||||
| 2026-02-17 | 13F | Graham Capital Management, L.P. | 51.709 | 51,48 | 1.081 | 6,61 | ||||
| 2026-02-09 | 13F | IPG Investment Advisors LLC | 10.000 | 209 | ||||||
| 2026-02-17 | 13F | Millennium Management Llc | Call | 0 | -100,00 | 0 | -100,00 | |||
| 2026-02-19 | 13F | Invesco Ltd. | 89.892 | 22,53 | 1.879 | -13,77 | ||||
| 2026-02-17 | 13F | Occudo Quantitative Strategies Lp | 14.664 | 306 | ||||||
| 2025-11-14 | 13F | Aigen Investment Management, Lp | 0 | -100,00 | 0 | |||||
| 2026-01-29 | 13F | Concurrent Investment Advisors, LLC | 33.177 | 693 | ||||||
| 2026-02-12 | 13F | Marex Group plc | 15.813 | 330 | ||||||
| 2026-01-26 | 13F | Mirae Asset Global Investments Co., Ltd. | 222 | 20,00 | 5 | -20,00 | ||||
| 2026-02-04 | 13F | Atlantic Union Bankshares Corp | 495 | 0,00 | 10 | -28,57 | ||||
| 2025-11-10 | 13F | Options Solutions, Llc | 0 | -100,00 | 0 | -100,00 | ||||
| 2026-02-10 | 13F | State of Wyoming | 2.610 | -81,57 | 55 | -87,14 | ||||
| 2026-02-13 | 13F | Toroso Investments, LLC | 43.611 | 5,79 | 911 | -25,57 | ||||
| 2026-02-17 | 13F | Altshuler Shaham Ltd | 413 | -18,86 | ||||||
| 2026-02-11 | 13F | Deutsche Bank Ag\ | 44.841 | 7,40 | 937 | -24,37 | ||||
| 2026-02-13 | 13F | Arrowstreet Capital, Limited Partnership | 11.514 | 241 | ||||||
| 2026-02-06 | 13F | ProShare Advisors LLC | 0 | -100,00 | 0 | -100,00 | ||||
| 2026-02-13 | 13F | Police & Firemen's Retirement System of New Jersey | 12.703 | 0,00 | 265 | -29,71 | ||||
| 2026-02-17 | 13F | Jones Financial Companies Lllp | 42 | 1 | ||||||
| 2026-02-17 | 13F | Alliancebernstein L.p. | 48.090 | 0,00 | 1.005 | -29,57 | ||||
| 2026-02-10 | 13F | Bnp Paribas Arbitrage, Sa | 1.014.570 | -15,76 | 21.205 | -40,70 | ||||
| 2026-02-13 | 13F | Neo Ivy Capital Management | 0 | -100,00 | 0 | |||||
| 2026-02-17 | 13F | Temasek Holdings (Private) Ltd | 144.068 | 0,00 | 3.011 | -29,60 | ||||
| 2026-02-13 | 13F | Segall Bryant & Hamill, Llc | 65.448 | 1.368 | ||||||
| 2026-02-17 | 13F | Susquehanna International Group, Llp | 0 | -100,00 | 0 | -100,00 | ||||
| 2026-03-06 | 13F | Hsbc Holdings Plc | 30.412 | -30,43 | 637 | -49,96 | ||||
| 2026-02-04 | 13F | Summit Wealth Group Llc / Co | 0 | -100,00 | 0 | -100,00 | ||||
| 2026-02-18 | 13F | Vident Advisory, LLC | 0 | -100,00 | 0 | -100,00 | ||||
| 2026-02-12 | 13F | Colonial Trust Co / SC | 124 | 3 | ||||||
| 2026-02-13 | 13F | Sei Investments Co | 33.469 | -2,56 | 700 | -31,40 | ||||
| 2026-02-17 | 13F | Man Group plc | 54.473 | 1.138 | ||||||
| 2026-02-06 | 13F | Gsa Capital Partners Llp | 0 | -100,00 | 0 | |||||
| 2026-02-17 | 13F | Advisory Services Network, LLC | 0 | -100,00 | 0 | |||||
| 2026-02-13 | 13F | Marshall Wace, Llp | 742.072 | 10,43 | 15.509 | -22,26 | ||||
| 2026-02-17 | 13F | Wiley Bros.-aintree Capital, Llc | 32.568 | 681 | ||||||
| 2026-02-13 | 13F | Verition Fund Management LLC | 234.781 | 93,71 | 4.907 | 36,35 | ||||
| 2026-02-13 | 13F | Quarry LP | 1.663 | 330,83 | 35 | 209,09 | ||||
| 2026-02-13 | 13F | American Century Companies Inc | 1.410.054 | 28,80 | 29.470 | -9,33 | ||||
| 2026-02-17 | 13F | Susquehanna International Group, Llp | Put | 691.300 | 31,88 | 14.448 | -7,16 | |||
| 2026-02-17 | 13F | Susquehanna International Group, Llp | Call | 1.335.300 | 50,61 | 27.908 | 6,02 | |||
| 2026-02-04 | 13F | LRI Investments, LLC | 23 | 0 | ||||||
| 2026-02-10 | 13F | Goldman Sachs Group Inc | 1.379.550 | 221,49 | 28.833 | 126,31 | ||||
| 2026-01-12 | 13F | Salem Investment Counselors Inc | 0 | -100,00 | 0 | |||||
| 2026-02-17 | 13F | Tudor Investment Corp Et Al | Call | 12.800 | -52,94 | 268 | -66,91 | |||
| 2026-02-17 | 13F | Tudor Investment Corp Et Al | Put | 26.600 | -44,70 | 556 | -61,13 | |||
| 2026-04-07 | 13F | Farther Finance Advisors, LLC | 4.015 | 12.066,67 | 47 | |||||
| 2026-02-11 | 13F | LPL Financial LLC | 26.665 | -24,83 | 557 | -47,10 | ||||
| 2026-02-05 | 13F | Allworth Financial LP | 410 | 12,02 | 9 | -20,00 | ||||
| 2026-02-17 | 13F | Tudor Investment Corp Et Al | 503.932 | 10,47 | 10.532 | -22,24 | ||||
| 2026-02-17 | 13F | Css Llc/il | Put | 0 | -100,00 | 0 | -100,00 | |||
| 2026-02-12 | 13F | Renaissance Technologies Llc | 1.354.064 | 27,30 | 28.300 | -10,39 | ||||
| 2026-02-17 | 13F | RiverPark Advisors, LLC | 1.650 | -57,43 | 34 | -70,43 | ||||
| 2026-02-13 | 13F | Divisadero Street Capital Management, LP | 0 | -100,00 | 0 | |||||
| 2026-02-10 | 13F | Envestnet Asset Management Inc | 109.176 | 665,02 | 2.282 | 439,24 | ||||
| 2026-02-06 | 13F | IFP Advisors, Inc | 17.072 | 43,63 | 357 | 1,14 | ||||
| 2026-01-29 | 13F | Kestra Private Wealth Services, Llc | 33.983 | 37,24 | 710 | -3,40 | ||||
| 2026-02-12 | 13F | Mission Creek Capital Partners, Inc. | 0 | -100,00 | 0 | |||||
| 2026-02-13 | 13F | Squarepoint Ops LLC | Put | 0 | -100,00 | 0 | -100,00 | |||
| 2026-02-17 | 13F | Price T Rowe Associates Inc /md/ | 92.297 | -69,60 | 2 | -88,89 | ||||
| 2026-02-12 | 13F | EAM Investors, LLC | 0 | -100,00 | 0 | -100,00 | ||||
| 2025-11-14 | 13F | Virtus ETF Advisers LLC | 0 | -100,00 | 0 | -100,00 | ||||
| 2026-02-17 | 13F | Schonfeld Strategic Advisors LLC | 13.201 | -53,36 | 276 | -67,26 | ||||
| 2026-02-17 | 13F | LMR Partners LLP | 0 | -100,00 | 0 | -100,00 | ||||
| 2026-02-17 | 13F | Frontier Capital Management Co Llc | 1.040.862 | -24,75 | 21.754 | -47,03 | ||||
| 2026-02-17 | 13F | Russell Investments Group, Ltd. | 5.386 | -91,52 | 113 | -94,06 | ||||
| 2026-02-10 | 13F | Thames Capital Management Llc | 0 | -100,00 | 0 | |||||
| 2026-02-17 | 13F | Bank Of America Corp /de/ | 981.960 | 214,09 | 20.523 | 121,09 | ||||
| 2026-02-09 | 13F | Geode Capital Management, Llc | 651.469 | 8,97 | 13.614 | -23,29 | ||||
| 2026-02-12 | 13F | Swiss National Bank | 100.983 | 10,14 | 2.111 | -22,48 | ||||
| 2026-04-06 | 13F | Versant Capital Management, Inc | 1.563 | 83,45 | 18 | 5,88 | ||||
| 2026-02-13 | 13F | K2 Principal Fund, L.p. | Put | 30.000 | 627 | |||||
| 2025-11-14 | 13F | Graham Capital Management, L.P. | Put | 0 | -100,00 | 0 | -100,00 | |||
| 2026-02-03 | 13F | SBI Securities Co., Ltd. | 16.493 | 5,03 | 345 | -26,18 | ||||
| 2025-11-13 | 13F | Macquarie Group Ltd | 0 | -100,00 | 0 | -100,00 | ||||
| 2026-02-17 | 13F | Numerai GP LLC | 18.877 | -54,03 | 395 | -67,68 | ||||
| 2026-01-20 | 13F | Thurston, Springer, Miller, Herd & Titak, Inc. | 3.983 | 1.386,19 | 83 | 1.085,71 | ||||
| 2026-02-13 | 13F | Parkside Financial Bank & Trust | 60 | -22,08 | 1 | -50,00 | ||||
| 2026-03-24 | 13F/A | Creek Drive Management Group LLC | 108.205 | 2.261 | ||||||
| 2026-03-24 | 13F/A | Creek Drive Management Group LLC | Call | 140.000 | 245 | |||||
| 2026-02-02 | 13F | Strs Ohio | 46.272 | -5,71 | 967 | -33,59 | ||||
| 2026-02-17 | 13F | Trexquant Investment LP | 840.240 | 48,99 | 17.561 | 4,88 | ||||
| 2026-02-12 | 13F | Voya Investment Management Llc | 16.471 | 19,09 | 344 | -16,10 | ||||
| 2026-02-17 | 13F | Signature Equity Partners, LLC | 1.842 | 38 | ||||||
| 2026-02-13 | 13F | Manufacturers Life Insurance Company, The | 0 | -100,00 | 0 | |||||
| 2026-02-13 | 13F | Walleye Trading LLC | 0 | -100,00 | 0 | -100,00 | ||||
| 2026-02-13 | 13F | Caitong International Asset Management Co., Ltd | 1.181 | -12,06 | 25 | -38,46 | ||||
| 2026-02-09 | 13F | Jefferies Financial Group Inc. | Put | 50.000 | 1.045 | |||||
| 2026-02-09 | 13F | Jefferies Financial Group Inc. | Call | 86.000 | 56,36 | 1.797 | 10,11 | |||
| 2026-02-10 | 13F | Quantbot Technologies LP | 53.605 | -64,95 | 1.120 | -75,33 | ||||
| 2026-02-14 | 13F | BluePath Capital Management, LLC | 46.151 | 965 | ||||||
| 2026-02-09 | 13F | Jefferies Financial Group Inc. | 145.000 | 3.030 | ||||||
| 2026-02-17 | 13F | Creative Planning | 0 | -100,00 | 0 | -100,00 | ||||
| 2025-11-13 | 13F | Riggs Asset Managment Co. Inc. | 0 | -100,00 | 0 | |||||
| 2026-01-23 | 13F | State of Alaska, Department of Revenue | 21.538 | 653,60 | 0 | |||||
| 2026-02-06 | 13F | GPS Wealth Strategies Group, LLC | 60 | -91,20 | 1 | -95,00 | ||||
| 2026-02-05 | 13F | Qsemble Capital Management, LP | 62.140 | 1.299 | ||||||
| 2026-02-09 | 13F | Jackson Creek Investment Advisors LLC | 0 | -100,00 | 0 | |||||
| 2026-02-17 | 13F | Q Global Advisors, LLC | 126.555 | 3 | ||||||
| 2026-02-06 | 13F | Larson Financial Group LLC | 265 | -37,35 | 6 | -58,33 | ||||
| 2026-02-12 | 13F | Integrated Quantitative Investments LLC | 13.785 | 11,30 | 288 | -21,53 | ||||
| 2026-02-17 | 13F | Voleon Capital Management Lp | 33.961 | -44,52 | 710 | -60,98 | ||||
| 2026-02-13 | 13F | SPX Equities Gestao de Recursos Ltda | 120.300 | 140,60 | 2.514 | 69,41 | ||||
| 2026-02-11 | 13F | MCF Advisors LLC | 336 | -56,08 | 7 | -68,18 | ||||
| 2026-02-13 | 13F | Headlands Technologies LLC | 0 | -100,00 | 0 | |||||
| 2025-11-14 | 13F | Corton Capital Inc. | 11.657 | -59,17 | 346 | -43,09 | ||||
| 2026-02-17 | 13F | Raymond James Financial Inc | 43.100 | 17,18 | 901 | -17,51 | ||||
| 2026-01-28 | 13F | Universal- Beteiligungs- und Servicegesellschaft mbH | 26.290 | 554 | ||||||
| 2026-02-13 | 13F | Y-Intercept (Hong Kong) Ltd | 0 | -100,00 | 0 | |||||
| 2026-02-11 | 13F | ARK Investment Management LLC | 74.426 | 11,86 | 1.556 | -21,27 | ||||
| 2026-02-17 | 13F | SummitTX Capital, L.P. | 0 | -100,00 | 0 | -100,00 | ||||
| 2026-02-17 | 13F | Royal Bank Of Canada | 15.317 | -97,61 | 320 | -98,32 | ||||
| 2025-11-14 | 13F | Cubist Systematic Strategies, LLC | 0 | -100,00 | 0 | -100,00 | ||||
| 2026-02-17 | 13F | Quantinno Capital Management LP | 16.906 | 42,79 | 353 | 0,57 | ||||
| 2026-02-13 | 13F | Adams Street Partners Llc | 0 | -100,00 | 0 | |||||
| 2026-02-11 | 13F | Zions Bancorporation, National Association /ut/ | 44 | 1 | ||||||
| 2026-04-08 | 13F | Wealth Enhancement Advisory Services, Llc | 17.626 | -63,21 | 207 | -81,63 | ||||
| 2026-02-12 | 13F | Triumph Capital Management | 100 | -66,67 | 2 | -75,00 | ||||
| 2026-02-13 | 13F | Morgan Stanley | 1.326.266 | 17,21 | 27.719 | -17,49 | ||||
| 2026-02-17 | 13F | Worth Venture Partners, LLC | 0 | -100,00 | 0 | -100,00 | ||||
| 2026-02-13 | 13F | Van Eck Associates Corp | 20.585 | 0 | ||||||
| 2026-02-18 | 13F | Vermillion & White Wealth Management Group, LLC | 0 | -100,00 | 0 | -100,00 | ||||
| 2026-01-14 | 13F | ORG Partners LLC | 50 | 1 | ||||||
| 2026-02-10 | 13F | Bank of New York Mellon Corp | 121.973 | 4,32 | 2.549 | -26,56 | ||||
| 2026-02-06 | 13F | Cullen/frost Bankers, Inc. | 68 | 1 | ||||||
| 2026-02-10 | 13F | Zweig-DiMenna Associates LLC | 0 | -100,00 | 0 | |||||
| 2026-02-11 | 13F | Prestige Wealth Management Group LLC | 25 | 0,00 | 1 | |||||
| 2026-02-13 | 13F | Kennedy Capital Management, Inc. | 86.415 | -0,61 | 1.806 | -30,03 | ||||
| 2026-02-17 | 13F | Canada Pension Plan Investment Board | 158.665 | 75,37 | 3.316 | 23,45 | ||||
| 2026-02-13 | 13F | Edgestream Partners, L.P. | 82.480 | -11,91 | 1.724 | -38,00 | ||||
| 2026-02-17 | 13F | Twinbeech Capital Lp | 49.600 | 16,49 | 1.037 | -18,04 | ||||
| 2026-02-13 | 13F | Venture Visionary Partners LLC | 0 | -100,00 | 0 | |||||
| 2025-11-14 | 13F | Point72 (DIFC) Ltd | 0 | -100,00 | 0 | |||||
| 2026-02-12 | 13F | Nuveen, LLC | 1.299.274 | 3,71 | 27.155 | -26,99 | ||||
| 2026-04-06 | 13F | GAMMA Investing LLC | 5.918 | 10,10 | 69 | -39,29 | ||||
| 2026-02-11 | 13F | Los Angeles Capital Management Llc | 48.435 | 23,94 | 1.259 | 8,53 | ||||
| 2026-01-27 | 13F | Zurcher Kantonalbank (Zurich Cantonalbank) | 26.454 | 18,29 | 553 | -16,74 |