Grundlæggende statistik
| Institutionelle ejere | 130 total, 130 long only, 0 short only, 0 long/short - change of 8,33% MRQ |
| Gennemsnitlig porteføljeallokering | 0.0953 % - change of -61,38% MRQ |
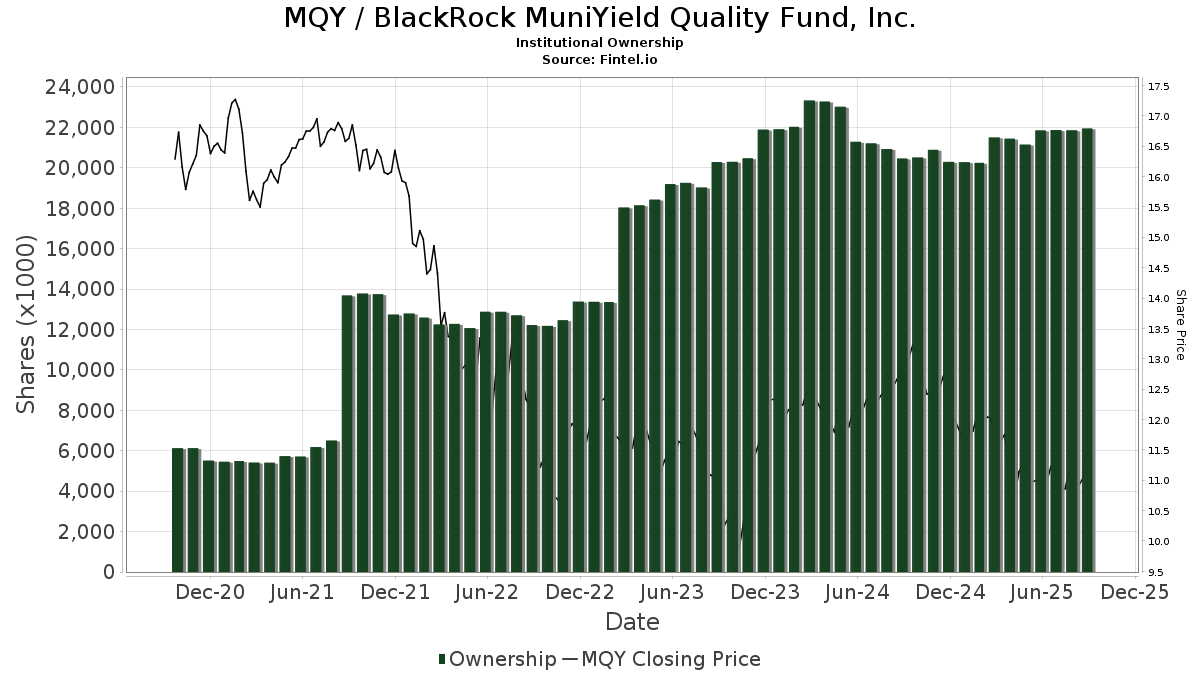
| Institutionelle aktier (lange) | 21.527.016 (ex 13D/G) - change of -0,40MM shares -1,83% MRQ |
| Institutionel værdi (lang) | $ 233.804 USD ($1000) |
Institutionelt ejerskab og aktionærer
BlackRock MuniYield Quality Fund, Inc. (US:MQY) har 130 institutionelle ejere og aktionærer, der har indsendt 13D/G- eller 13F-formularer til Securities Exchange Commission (SEC). Disse institutioner har i alt 21,527,016 aktier. Største aktionærer omfatter Morgan Stanley, Rivernorth Capital Management, Llc, Guggenheim Capital Llc, Hennion & Walsh Asset Management, Inc., Cornerstone Advisory, LLC, Wells Fargo & Company/mn, UBS Group AG, Karpus Management, Inc., Robinson Capital Management, Llc, and Van Eck Associates Corp .
BlackRock MuniYield Quality Fund, Inc. (NYSE:MQY) institutionel ejerskabsstruktur viser aktuelle positioner i virksomheden efter institutioner og fonde, samt seneste ændringer i positionsstørrelse. Større aktionærer kan omfatte individuelle investorer, investeringsforeninger, hedgefonde eller institutioner. Skema 13D angiver, at investoren besidder (eller besidder) mere end 5 % af virksomheden og har til hensigt (eller har til hensigt at) aktivt at forfølge en ændring i forretningsstrategi. Skema 13G indikerer en passiv investering på over 5%.
The share price as of March 20, 2026 is 11,17 / share. Previously, on March 21, 2025, the share price was 11,77 / share. This represents a decline of 5,10% over that period.
Fondens stemningsscore
Fund Sentiment Score (fka Ownership Accumulation Score) finder de aktier, der bliver mest købt af fonde. Det er resultatet af en sofistikeret, multi-faktor kvantitativ model, der identificerer virksomheder med de højeste niveauer af institutionel akkumulering. Scoringsmodellen bruger en kombination af den samlede stigning i oplyste ejere, ændringerne i porteføljeallokeringer i disse ejere og andre målinger. Tallet går fra 0 til 100, hvor højere tal indikerer et højere niveau af akkumulering for sine jævnaldrende, og 50 er gennemsnittet.
Opdateringsfrekvens: Dagligt
Se Ownership Explorer, som giver en liste over højest rangerende virksomheder.
AI+ Ask Fintel’s AI assistant about BlackRock MuniYield Quality Fund, Inc..
Select a question to share a public post with an AI-crafted answer.
Thinking of good questions…
Institutionel Put/Call-forhold
Ud over at indberette standardaktie- og gældsudstedelser skal institutter med mere end 100 mill. aktiver under forvaltning også oplyse deres put- og call-optionsbeholdninger. Da salgsoptioner generelt indikerer negativ stemning, og købsoptioner indikerer positiv stemning, kan vi få en fornemmelse af den overordnede institutionelle stemning ved at plotte forholdet mellem put og kald. Diagrammet til højre viser det historiske put/call-forhold for dette instrument.
Brug af Put/Call Ratio som en indikator for investorernes stemning overvinder en af de vigtigste mangler ved at bruge totalt institutionelt ejerskab, som er, at en betydelig mængde af aktiver under forvaltning investeres passivt for at spore indekser. Passivt forvaltede fonde køber typisk ikke optioner, så indikatoren for put/call-forholdet følger mere nøje følelsen af aktivt forvaltede fonde.
13F og NPORT arkivering
Detaljer om 13F-arkivering er gratis. Detaljer om NP-ansøgninger kræver et premium-medlemskab. Grønne rækker angiver nye positioner. Røde rækker angiver lukkede positioner. Klik på linket ikon for at se den fulde transaktionshistorik.
Opgrader
for at låse premium-data op og eksportere til Excel ![]() .
.
| Fil dato | Kilde | Investor | Type | Gennemsnitlig pris (Øst) |
Aktier | Δ Aktier (%) |
Rapporteret Værdi ($1000) |
Δ Værdi (%) |
Port Alloc (%) |
|
|---|---|---|---|---|---|---|---|---|---|---|
| 2026-02-17 | 13F | Polar Asset Management Partners Inc. | 0 | -100,00 | 0 | |||||
| 2026-02-13 | 13F | Westchester Capital Management, LLC | 130.274 | 0,00 | 1.472 | -2,97 | ||||
| 2026-01-12 | 13F | Moody National Bank Trust Division | 10.016 | 113 | ||||||
| 2025-10-06 | 13F | Trust Co | 0 | -100,00 | 0 | |||||
| 2026-02-12 | 13F | Pettinga Financial Advisors, LLC | 125.297 | 1.416 | ||||||
| 2026-02-17 | 13F | Logan Stone Capital, LLC | 58.233 | 658 | ||||||
| 2026-01-28 | 13F | WPG Advisers, LLC | 343 | 57,34 | 4 | 50,00 | ||||
| 2026-02-12 | 13F | Hollencrest Capital Management | 6.730 | 189,71 | 76 | 181,48 | ||||
| 2026-02-12 | 13F | Advisors Asset Management, Inc. | 153.686 | 132,12 | 1.737 | 125,16 | ||||
| 2025-11-04 | 13F | Umb Bank N A/mo | 0 | -100,00 | 0 | |||||
| 2026-02-17 | 13F | Citadel Advisors Llc | 12.401 | 140 | ||||||
| 2025-11-13 | 13F | Newbridge Financial Services Group, Inc. | 0 | -100,00 | 0 | |||||
| 2026-02-13 | 13F | Kestra Advisory Services, LLC | 32.215 | 0,79 | 364 | -2,15 | ||||
| 2026-02-09 | 13F | Prospera Financial Services Inc | 10.416 | 0,00 | 118 | -3,31 | ||||
| 2026-02-13 | 13F | Robinson Capital Management, Llc | 568.312 | 6.422 | ||||||
| 2026-01-22 | 13F | Pinnacle Bancorp, Inc. | 0 | -100,00 | 0 | |||||
| 2026-02-11 | 13F | Fiera Capital Corp | 414.855 | 0,18 | 4.688 | -2,84 | ||||
| 2026-02-02 | 13F | CX Institutional | 11.193 | 0,50 | 0 | |||||
| 2026-02-12 | 13F | Jane Street Group, Llc | 119.512 | 1.350 | ||||||
| 2026-01-23 | 13F | Tyche Wealth Partners LLC | 16.729 | 0,00 | 189 | -2,58 | ||||
| 2026-01-20 | 13F | Stratos Wealth Partners, LTD. | 53.948 | 17,41 | 610 | 13,83 | ||||
| 2026-02-05 | 13F | Wakefield Asset Management LLLP | 88.236 | 997 | ||||||
| 2026-02-11 | 13F | TruNorth Capital Management, LLC | 0 | -100,00 | 0 | |||||
| 2026-02-17 | 13F | Rivernorth Capital Management, Llc | 2.439.445 | -6,34 | 27.566 | -9,16 | ||||
| 2026-02-17 | 13F | Ameriprise Financial Inc | 128.548 | -23,07 | 1.451 | -25,44 | ||||
| 2026-01-29 | 13F | Concurrent Investment Advisors, LLC | 15.716 | -42,99 | 178 | -44,86 | ||||
| 2026-02-17 | 13F | Summit Trail Advisors, Llc | 0 | -100,00 | 0 | -100,00 | ||||
| 2026-02-03 | 13F | Legacy Wealth Managment, LLC/ID | 0 | -100,00 | 0 | |||||
| 2026-02-13 | 13F | Integrated Wealth Concepts LLC | 40.334 | 456 | ||||||
| 2026-01-29 | 13F | Mackay Shields Llc | 357.837 | 0,00 | 4.044 | -3,00 | ||||
| 2025-11-13 | 13F | BTG Pactual Asset Management US LLC | 0 | -100,00 | 0 | -100,00 | ||||
| 2026-02-13 | 13F | Ubs Asset Management Americas Inc | 2.122 | 24 | ||||||
| 2025-10-22 | 13F | Geneos Wealth Management Inc. | 0 | -100,00 | 0 | |||||
| 2026-02-10 | 13F | Moors & Cabot, Inc. | 10.393 | -2,34 | 117 | -4,88 | ||||
| 2025-10-22 | 13F | OneAscent Financial Services LLC | 13.267 | 0,00 | 155 | |||||
| 2026-02-17 | 13F | Palogic Value Management, L.P. | 10.000 | -6,96 | 113 | -9,60 | ||||
| 2026-02-06 | 13F | Stronghold Wealth Management L.L.C. | 13.639 | 154 | ||||||
| 2026-02-09 | 13F | Harbour Investments, Inc. | 3.421 | 0,00 | 39 | -2,56 | ||||
| 2026-02-12 | 13F | Commonwealth Equity Services, Llc | 208.750 | 6,65 | 2.359 | 117.800,00 | ||||
| 2026-02-10 | 13F | Goldman Sachs Group Inc | 50.735 | 0,00 | 573 | -3,05 | ||||
| 2026-02-12 | 13F | Marex Group plc | 10.913 | 123 | ||||||
| 2025-10-07 | 13F | Graves-Light Private Wealth Management, Inc. | 0 | -100,00 | 0 | |||||
| 2026-02-13 | 13F | Mml Investors Services, Llc | 68.076 | 9,30 | 769 | 6,07 | ||||
| 2026-01-27 | 13F | First Horizon Corp | 2.932 | 0,00 | 33 | -2,94 | ||||
| 2026-01-29 | 13F | Calamos Advisors LLC | 22.762 | 257 | ||||||
| 2026-03-04 | 13F | SHP Wealth Management | 843 | 10 | ||||||
| 2026-01-16 | 13F | FNY Investment Advisers, LLC | 0 | -100,00 | 0 | |||||
| 2026-01-09 | 13F | Westview Management dba Westview Investment Advisors | 10.700 | 121 | ||||||
| 2026-01-29 | 13F | Nbc Securities, Inc. | 3.194 | 0,00 | 36 | -2,70 | ||||
| 2026-02-02 | 13F | Chung Wu Investment Group, LLC | 7.000 | 0,00 | 79 | -2,47 | ||||
| 2026-02-17 | 13F | Advisor Group Holdings, Inc. | 97.661 | 85,79 | 1.104 | 87,27 | ||||
| 2026-01-13 | 13F | Capital Investment Advisors, LLC | 11.615 | -15,50 | 131 | -18,12 | ||||
| 2026-01-20 | 13F | Hanson & Doremus Investment Management | 1.300 | 0,00 | 0 | |||||
| 2026-01-26 | 13F | Cwm, Llc | 2.707 | 0,00 | 0 | |||||
| 2026-01-14 | 13F | Jfs Wealth Advisors, Llc | 128.040 | 0,07 | 1.447 | -2,95 | ||||
| 2026-02-17 | 13F | Bank Of America Corp /de/ | 535.352 | -5,72 | 6.049 | -8,56 | ||||
| 2026-02-06 | 13F | Pnc Financial Services Group, Inc. | 5.088 | -2,86 | 57 | -6,56 | ||||
| 2026-02-17 | 13F | Readystate Asset Management Lp | 53.424 | 604 | ||||||
| 2026-01-27 | 13F | Compass Financial Group, INC/SD | 23.685 | 0,00 | 268 | -2,91 | ||||
| 2026-02-11 | 13F | Janney Montgomery Scott LLC | 143.532 | -5,01 | 2 | 0,00 | ||||
| 2026-02-18 | 13F | GWM Advisors LLC | 62.984 | 0,31 | 712 | -2,74 | ||||
| 2026-02-06 | 13F | Pathway Financial Advisers, LLC | 0 | -100,00 | 0 | |||||
| 2026-01-29 | 13F | UBS Group AG | 842.244 | -6,31 | 9.517 | -9,13 | ||||
| 2026-02-13 | 13F | Yakira Capital Management, Inc. | 0 | -100,00 | 0 | |||||
| 2026-02-13 | 13F | Pinnacle Wealth Planning Services, Inc. | 1.230 | 14 | ||||||
| 2026-01-26 | 13F | River Street Advisors LLC | 0 | -100,00 | 0 | |||||
| 2026-02-26 | 13F | Anchor Investment Management, LLC | 7.131 | 0,00 | 81 | -3,61 | ||||
| 2026-02-17 | 13F | Nomura Holdings Inc | 21.250 | 240 | ||||||
| 2026-02-17 | 13F | XTX Topco Ltd | 23.841 | 269 | ||||||
| 2026-02-06 | 13F | Global Retirement Partners, LLC | 2.827 | 32 | ||||||
| 2026-01-23 | 13F | Clear Creek Financial Management, LLC | 17.111 | 6,21 | 193 | 3,21 | ||||
| 2026-01-20 | 13F | SOA Wealth Advisors, LLC. | 299 | 0,00 | 3 | 0,00 | ||||
| 2026-02-05 | 13F | Cambridge Investment Research Advisors, Inc. | 36.646 | 0,18 | 0 | |||||
| 2026-02-11 | 13F | J.w. Cole Advisors, Inc. | 22.351 | 58 | ||||||
| 2026-02-13 | 13F | Van Eck Associates Corp | 544.362 | 18,19 | 6 | 20,00 | ||||
| 2025-11-05 | 13F | Koesten, Hirschmann & Crabtree, INC. | 0 | -100,00 | 0 | |||||
| 2026-01-07 | 13F | Permanent Capital Management, LP | 12.343 | 3,79 | 139 | 0,00 | ||||
| 2026-02-13 | 13F | Landscape Capital Management, L.l.c. | 63.577 | 308,15 | 718 | 296,69 | ||||
| 2026-01-14 | 13F | First City Capital Management, Inc. | 10.548 | 0,00 | 119 | -2,46 | ||||
| 2026-01-29 | 13F | Courier Capital Llc | 16.000 | 0,00 | 181 | -3,23 | ||||
| 2026-02-05 | 13F | Allworth Financial LP | 4.459 | 0,00 | 50 | -1,96 | ||||
| 2026-02-12 | 13F | Bank Of Montreal /can/ | 31.618 | -3,51 | 357 | -6,30 | ||||
| 2026-02-04 | 13F | Pensionmark Financial Group, Llc | 13.512 | 19,34 | 152 | 16,03 | ||||
| 2026-02-17 | 13F/A | Karpus Management, Inc. | 683.812 | 7.727 | ||||||
| 2026-01-23 | 13F | U.S. Capital Wealth Advisors, LLC | 36.624 | -21,45 | 414 | -23,94 | ||||
| 2026-02-12 | 13F | Principal Securities, Inc. | 0 | -100,00 | 0 | -100,00 | ||||
| 2026-02-13 | 13F | Wells Fargo & Company/mn | 930.683 | 6,25 | 10.517 | 3,06 | ||||
| 2026-02-17 | 13F | Advisory Services Network, LLC | 12.864 | -13,29 | 145 | -15,70 | ||||
| 2026-02-13 | 13F | Wealth Alliance | 10.000 | 0,00 | 113 | -2,59 | ||||
| 2026-01-16 | 13F | West Branch Capital LLC | 1.200 | 0,00 | 14 | 0,00 | ||||
| 2026-01-23 | 13F | Cura Wealth Advisors, Llc | 271.000 | -25,14 | 3.062 | -27,39 | ||||
| 2026-01-28 | 13F | Cornerstone Advisory, LLC | 1.049.409 | -4,22 | 11.858 | -7,10 | ||||
| 2026-02-05 | 13F | Elyxium Wealth, LLC | 6.069 | 69 | ||||||
| 2026-02-13 | 13F | Cohen & Steers, Inc. | 35.385 | 0,00 | 0 | |||||
| 2026-02-12 | 13F | Hrt Financial Lp | 17.334 | 0 | ||||||
| 2026-02-13 | 13F | City Of London Investment Management Co Ltd | 10.000 | 113 | ||||||
| 2026-02-03 | 13F | Primoris Wealth Advisors, Llc | 46.101 | 2,22 | 521 | -0,95 | ||||
| 2026-02-13 | 13F | Corps Capital Advisors, LLC | 17.100 | 0,00 | 193 | -3,02 | ||||
| 2026-02-03 | 13F | Bokf, Na | 6.534 | 0,00 | 74 | -3,95 | ||||
| 2026-02-06 | 13F | Bare Financial Services, Inc | 1.055 | 0,00 | 12 | -8,33 | ||||
| 2026-02-17 | 13F | Wiley Bros.-aintree Capital, Llc | 22.321 | 83,20 | 252 | 78,72 | ||||
| 2026-02-19 | 13F | CI Private Wealth, LLC | 10.459 | 118 | ||||||
| 2026-02-17 | 13F | Guggenheim Capital Llc | 1.557.152 | 3,00 | 17.596 | -0,10 | ||||
| 2026-02-02 | 13F | Mutual Advisors, LLC | 88.717 | -35,16 | 1.003 | -36,74 | ||||
| 2026-02-09 | 13F | Shufro Rose & Co Llc | 0 | -100,00 | 0 | |||||
| 2026-02-06 | 13F | HighTower Advisors, LLC | 74.223 | -28,43 | 839 | -30,63 | ||||
| 2025-11-03 | 13F | Truist Financial Corp | 0 | -100,00 | 0 | |||||
| 2026-01-28 | 13F | Alesco Advisors Llc | 10.117 | 0,00 | 114 | -2,56 | ||||
| 2026-02-17 | 13F | Susquehanna International Group, Llp | 64.927 | 734 | ||||||
| 2026-01-29 | 13F | Sanctuary Advisors, LLC | 13.914 | -47,38 | 157 | -49,03 | ||||
| 2026-02-19 | 13F | Invesco Ltd. | 88.625 | 129,17 | 1.001 | 122,44 | ||||
| 2025-09-24 | NP | XMPT - VanEck Vectors CEF Municipal Income ETF | 457.534 | 5,81 | 5.015 | 4,11 | ||||
| 2026-02-13 | 13F | MAI Capital Management | 11.838 | 0,06 | 134 | -2,92 | ||||
| 2026-01-20 | 13F | Savvy Advisors, Inc. | 10.284 | -7,22 | 116 | -10,08 | ||||
| 2026-02-12 | 13F | Nuveen, LLC | 33.242 | 9,92 | 376 | 6,53 | ||||
| 2026-02-17 | 13F | Jones Financial Companies Lllp | 0 | -100,00 | 0 | |||||
| 2026-01-21 | 13F | Indiana Trust & Investment Management CO | 98.527 | 0,00 | 1.113 | -2,96 | ||||
| 2026-02-17 | 13F | Creative Planning | 25.384 | -3,45 | 287 | -6,54 | ||||
| 2026-02-17 | 13F | Balyasny Asset Management Llc | 238.968 | 2.700 | ||||||
| 2025-09-23 | NP | MMHVX - MainStay MacKay High Yield Municipal Bond Fund Investor Class | 287.227 | 0,00 | 3.148 | -1,59 | ||||
| 2026-01-22 | 13F | Charter Trust Co | 12.305 | 0,00 | 139 | -2,80 | ||||
| 2026-02-10 | 13F | Bank of New York Mellon Corp | 20.484 | 231 | ||||||
| 2026-02-17 | 13F | Raymond James Financial Inc | 291.557 | -6,11 | 3.295 | -8,93 | ||||
| 2026-02-10 | 13F | Envestnet Asset Management Inc | 38.449 | 21,76 | 434 | 18,26 | ||||
| 2026-01-14 | 13F | Hennion & Walsh Asset Management, Inc. | 1.428.403 | 35,06 | 16.141 | 31,01 | ||||
| 2026-01-06 | 13F | Canal Capital Management, LLC | 18.990 | 51,54 | 215 | 47,59 | ||||
| 2026-01-30 | 13F/A | M&t Bank Corp | 17.000 | 0,00 | 192 | -3,03 | ||||
| 2026-02-17 | 13F | Cetera Investment Advisers | 52.217 | 16,64 | 590 | 13,24 | ||||
| 2026-01-29 | 13F | Comerica Bank | 1.750 | 17,53 | 20 | 11,76 | ||||
| 2025-10-08 | 13F/A | Simon Quick Advisors, Llc | 0 | -100,00 | 0 | |||||
| 2026-01-14 | 13F | Spire Wealth Management | 9.000 | 0,00 | 102 | -2,88 | ||||
| 2026-02-13 | 13F | Stifel Financial Corp | 36.234 | 15,27 | 409 | 11,75 | ||||
| 2025-10-29 | 13F | Bfsg, Llc | 0 | -100,00 | 0 | |||||
| 2026-02-13 | 13F | Morgan Stanley | 4.362.677 | 7,45 | 49.298 | 4,22 | ||||
| 2026-02-14 | 13F | Rockefeller Capital Management L.P. | 235.591 | 12,16 | 2.662 | 8,79 | ||||
| 2025-11-07 | 13F | Jpmorgan Chase & Co | 0 | -100,00 | 0 | |||||
| 2026-02-02 | 13F | Wolverine Asset Management Llc | 95.713 | 1.082 | ||||||
| 2026-02-12 | 13F | Steward Partners Investment Advisory, Llc | 33.387 | -11,84 | 377 | -14,51 | ||||
| 2026-02-12 | 13F | StoneX Group Inc. | 167.115 | 2,01 | 1.888 | -1,41 | ||||
| 2026-02-03 | 13F | Indivisible Partners | 23.941 | 271 | ||||||
| 2026-01-30 | 13F | Us Bancorp \de\ | 6.400 | 0,00 | 72 | -2,70 | ||||
| 2026-01-13 | 13F | Dakota Wealth Management | 15.100 | 171 | ||||||
| 2026-02-17 | 13F | Royal Bank Of Canada | 67.887 | 5,65 | 767 | 2,40 | ||||
| 2026-02-04 | 13F | Meridian Wealth Management, LLC | 11.955 | 0,00 | 135 | -2,88 | ||||
| 2026-02-12 | 13F | Triumph Capital Management | 748 | 8 | ||||||
| 2026-01-21 | 13F | Wealthbridge Capital Management, Llc | 28.000 | -24,46 | 316 | -26,68 | ||||
| 2026-02-18 | 13F | Garton & Associates Financial Advisors LLC | 2.862 | 32 | ||||||
| 2026-01-16 | 13F | Melfa Wealth Management, Llc | 192.732 | -0,83 | 2.178 | -3,84 | ||||
| 2026-02-04 | 13F | Tsfg, Llc | 448 | 0,00 | 0 | |||||
| 2026-01-30 | 13F | Caldwell Trust Co | 19.517 | 0,00 | 221 | -3,08 | ||||
| 2026-02-11 | 13F | LPL Financial LLC | 111.343 | -0,62 | 1.258 | -3,60 | ||||
| 2026-02-11 | 13F | Ackerman Capital Advisors, LLC | 15.599 | 176 | ||||||
| 2026-02-17 | 13F | Modern Wealth Management, LLC | 11.223 | 127 |