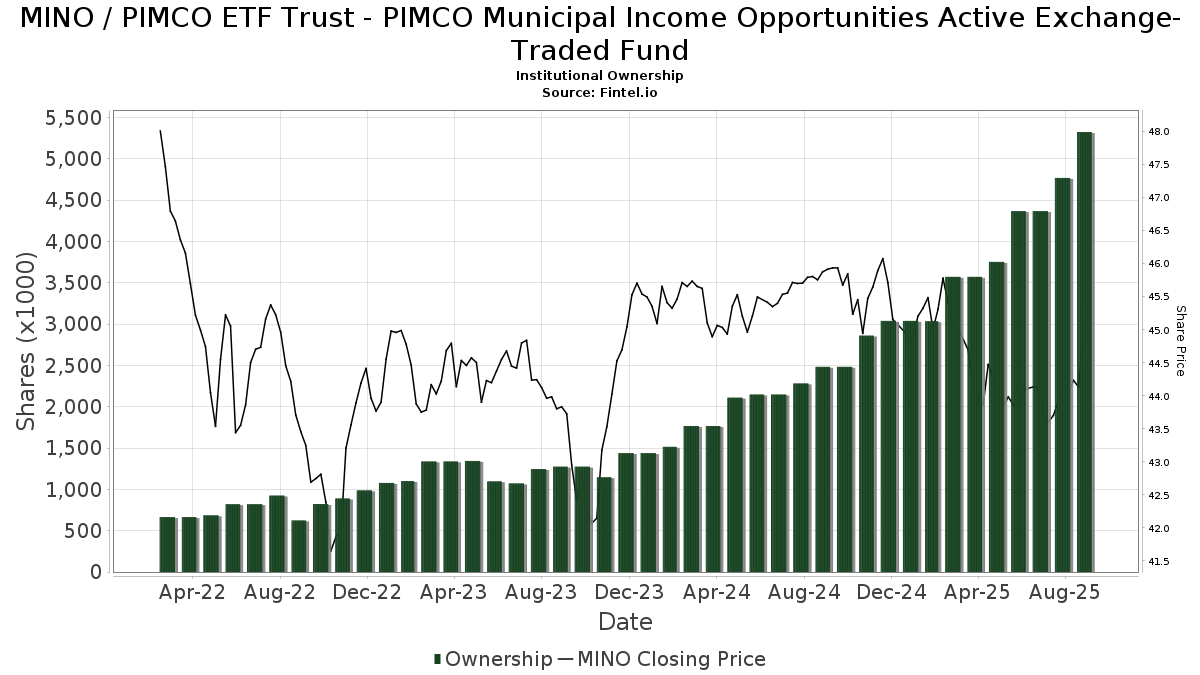
Grundlæggende statistik
| Institutionelle ejere | 139 total, 139 long only, 0 short only, 0 long/short - change of 17,65% MRQ |
| Gennemsnitlig porteføljeallokering | 0.2802 % - change of 23,91% MRQ |
| Institutionelle aktier (lange) | 7.625.252 (ex 13D/G) - change of 1,63MM shares 27,15% MRQ |
| Institutionel værdi (lang) | $ 315.004 USD ($1000) |
Institutionelt ejerskab og aktionærer
PIMCO ETF Trust - PIMCO Municipal Income Opportunities Active Exchange-Traded Fund (US:MINO) har 139 institutionelle ejere og aktionærer, der har indsendt 13D/G- eller 13F-formularer til Securities Exchange Commission (SEC). Disse institutioner har i alt 7,625,252 aktier. Største aktionærer omfatter LPL Financial LLC, Cardinal Point Capital Management, ULC, Cwm, Llc, Great Valley Advisor Group, Inc., Colony Group, LLC, Advisor Group Holdings, Inc., Envestnet Asset Management Inc, GWM Advisors LLC, Asio Capital, LLC, and Truist Financial Corp .
PIMCO ETF Trust - PIMCO Municipal Income Opportunities Active Exchange-Traded Fund (ARCA:MINO) institutionel ejerskabsstruktur viser aktuelle positioner i virksomheden efter institutioner og fonde, samt seneste ændringer i positionsstørrelse. Større aktionærer kan omfatte individuelle investorer, investeringsforeninger, hedgefonde eller institutioner. Skema 13D angiver, at investoren besidder (eller besidder) mere end 5 % af virksomheden og har til hensigt (eller har til hensigt at) aktivt at forfølge en ændring i forretningsstrategi. Skema 13G indikerer en passiv investering på over 5%.
The share price as of April 24, 2026 is 45,60 / share. Previously, on April 28, 2025, the share price was 44,26 / share. This represents an increase of 3,04% over that period.
Fondens stemningsscore
Fund Sentiment Score (fka Ownership Accumulation Score) finder de aktier, der bliver mest købt af fonde. Det er resultatet af en sofistikeret, multi-faktor kvantitativ model, der identificerer virksomheder med de højeste niveauer af institutionel akkumulering. Scoringsmodellen bruger en kombination af den samlede stigning i oplyste ejere, ændringerne i porteføljeallokeringer i disse ejere og andre målinger. Tallet går fra 0 til 100, hvor højere tal indikerer et højere niveau af akkumulering for sine jævnaldrende, og 50 er gennemsnittet.
Opdateringsfrekvens: Dagligt
Se Ownership Explorer, som giver en liste over højest rangerende virksomheder.
AI+ Ask Fintel’s AI assistant about PIMCO ETF Trust - PIMCO Municipal Income Opportunities Active Exchange-Traded Fund.
Select a question to share a public post with an AI-crafted answer.
Thinking of good questions…
Institutionel Put/Call-forhold
Ud over at indberette standardaktie- og gældsudstedelser skal institutter med mere end 100 mill. aktiver under forvaltning også oplyse deres put- og call-optionsbeholdninger. Da salgsoptioner generelt indikerer negativ stemning, og købsoptioner indikerer positiv stemning, kan vi få en fornemmelse af den overordnede institutionelle stemning ved at plotte forholdet mellem put og kald. Diagrammet til højre viser det historiske put/call-forhold for dette instrument.
Brug af Put/Call Ratio som en indikator for investorernes stemning overvinder en af de vigtigste mangler ved at bruge totalt institutionelt ejerskab, som er, at en betydelig mængde af aktiver under forvaltning investeres passivt for at spore indekser. Passivt forvaltede fonde køber typisk ikke optioner, så indikatoren for put/call-forholdet følger mere nøje følelsen af aktivt forvaltede fonde.
13F og NPORT arkivering
Detaljer om 13F-arkivering er gratis. Detaljer om NP-ansøgninger kræver et premium-medlemskab. Grønne rækker angiver nye positioner. Røde rækker angiver lukkede positioner. Klik på linket ikon for at se den fulde transaktionshistorik.
Opgrader
for at låse premium-data op og eksportere til Excel ![]() .
.
| Fil dato | Kilde | Investor | Type | Gennemsnitlig pris (Øst) |
Aktier | Δ Aktier (%) |
Rapporteret Værdi ($1000) |
Δ Værdi (%) |
Port Alloc (%) |
|
|---|---|---|---|---|---|---|---|---|---|---|
| 2026-02-05 | 13F | PAX Financial Group, LLC | 47.946 | 22,78 | 2.173 | 22,78 | ||||
| 2026-02-17 | 13F | Equitable Holdings, Inc. | 4.709 | 213 | ||||||
| 2026-04-17 | 13F | Nautilus Advisors LLC | 5.444 | 6,27 | 246 | 5,60 | ||||
| 2026-02-11 | 13F | Arrowroot Family Office, LLC | 47.314 | 12,90 | 2.144 | 12,96 | ||||
| 2026-01-29 | 13F | Golden State Equity Partners | 11.716 | 531 | ||||||
| 2026-04-21 | 13F | Mayfair Advisory Group, LLC | 23.718 | 86,76 | 1.071 | 85,94 | ||||
| 2026-04-20 | 13F | Cardinal Point Capital Management, ULC | 585.778 | 5,46 | 26.460 | 4,76 | ||||
| 2026-02-02 | 13F | Mutual Advisors, LLC | 8.516 | 86,71 | 386 | 85,10 | ||||
| 2026-02-12 | 13F | Betterment LLC | 7.069 | 40,93 | 0 | |||||
| 2026-02-17 | 13F | Advisory Services Network, LLC | 7.183 | -1,52 | 326 | -1,52 | ||||
| 2026-02-06 | 13F | Envestnet Portfolio Solutions, Inc. | 7.353 | 0,00 | 333 | 0,00 | ||||
| 2025-11-06 | 13F | Financial Advocates Investment Management | 0 | -100,00 | 0 | |||||
| 2026-04-07 | 13F | CoreCap Advisors, LLC | 4.026 | 34,92 | 182 | 34,07 | ||||
| 2026-04-10 | 13F | AssuredPartners Investment Advisors, LLC | 73.265 | 7,23 | 3.312 | 6,98 | ||||
| 2026-01-20 | 13F | Stratos Wealth Partners, LTD. | 13.550 | 0,00 | 614 | 0,16 | ||||
| 2026-02-11 | 13F | SOUTH STATE Corp | 1.140 | -38,11 | 52 | -38,55 | ||||
| 2026-02-17 | 13F | Private Advisor Group, LLC | 21.615 | -83,11 | 980 | -83,11 | ||||
| 2026-01-26 | 13F | Private Trust Co Na | 4.639 | 17,32 | 210 | 17,32 | ||||
| 2026-04-22 | 13F | Eqis Capital Management, Inc. | 29.918 | 4,44 | 1.351 | 4,08 | ||||
| 2026-02-20 | 13F | Kovitz Investment Group Partners, LLC | 0 | -100,00 | 0 | |||||
| 2026-04-20 | 13F | Williams & Novak, LLC | 4.900 | 221 | ||||||
| 2026-02-02 | 13F | Integrity Wealth Solutions LLC | 38.497 | 19,19 | 1.745 | 19,21 | ||||
| 2026-02-05 | 13F | WealthPlan Investment Management, LLC | 5.126 | -15,31 | 232 | -15,33 | ||||
| 2026-04-14 | 13F | Seven Mile Advisory | 0 | -100,00 | 0 | |||||
| 2026-02-05 | 13F | Evergreen Wealth Partners LLC | 52.773 | 2.392 | ||||||
| 2026-02-24 | 13F | Barnes Wealth Management Group, Inc | 12.937 | 1,76 | 586 | 1,74 | ||||
| 2026-02-12 | 13F | Brinker Capital Investments, LLC | 16.455 | -27,07 | 746 | -27,10 | ||||
| 2026-02-12 | 13F | Great Valley Advisor Group, Inc. | 473.091 | -15,10 | 21.441 | -15,09 | ||||
| 2026-04-17 | 13F | BAM Wealth Management, LLC | 17.795 | 6,15 | 804 | 5,80 | ||||
| 2026-02-05 | 13F | Paulson Wealth Management Inc. | 78.272 | 13,80 | 3.547 | 13,83 | ||||
| 2026-02-17 | 13F | Advisor Group Holdings, Inc. | 219.065 | 17,39 | 9.929 | 18,02 | ||||
| 2026-04-22 | 13F | Janney Montgomery Scott LLC | 12.235 | 21,43 | 1 | |||||
| 2026-02-13 | 13F | LiftPoint Family Wealth Advisors LLC | 26.853 | 1.217 | ||||||
| 2026-04-17 | 13F | AdvisorNet Financial, Inc | 6.061 | 175,37 | 274 | 175,76 | ||||
| 2026-02-05 | 13F | Dahring | Cusmano Llc | 15.193 | 10,49 | 689 | 10,43 | ||||
| 2026-02-17 | 13F | Elequin Capital Lp | 26.579 | 175,23 | 1.205 | 175,51 | ||||
| 2026-01-29 | 13F | Comerica Bank | 5.033 | 228 | ||||||
| 2026-01-20 | 13F | Westwood Wealth Management | 5.731 | 261 | ||||||
| 2026-02-09 | 13F | Cary Street Partners Financial Llc | 165.297 | 1,78 | 7.491 | 1,81 | ||||
| 2025-11-13 | 13F | Cove Street Capital, LLC | 13.665 | 19,59 | 619 | 22,57 | ||||
| 2026-01-13 | 13F | Dakota Wealth Management | 52.063 | 2.359 | ||||||
| 2026-04-17 | 13F | BCS Wealth Management | 41.571 | -49,87 | 1.878 | -50,05 | ||||
| 2026-01-30 | 13F | Delta Investment Management, LLC | 8.194 | 371 | ||||||
| 2026-02-10 | 13F | Viawealth, Llc | 37.688 | 0,81 | 1.708 | 0,89 | ||||
| 2026-02-13 | 13F | Kestra Advisory Services, LLC | 3.590 | 163 | ||||||
| 2026-04-13 | 13F | IFP Advisors, Inc | 2.036 | -5,13 | 92 | -6,19 | ||||
| 2026-02-17 | 13F | Wiley Bros.-aintree Capital, Llc | 21.133 | 26,26 | 958 | 26,25 | ||||
| 2025-11-25 | 13F | Briaud Financial Planning, Inc | 0 | -100,00 | 0 | |||||
| 2026-01-22 | 13F | Premier Path Wealth Partners, LLC | 8.386 | -12,65 | 380 | -12,64 | ||||
| 2026-02-11 | 13F | Capital Analysts, Inc. | 6.847 | 264,01 | 0 | |||||
| 2026-02-17 | 13F | Raymond James Financial Inc | 154.865 | 57,85 | 7.018 | 57,89 | ||||
| 2026-02-10 | 13F | Sittner & Nelson, Llc | 105.239 | 186,58 | 4.806 | 188,94 | ||||
| 2026-02-05 | 13F | Landmark Wealth Management, LLC | 20.511 | 1,36 | 930 | 1,42 | ||||
| 2026-01-13 | 13F | Lionshead Wealth Management, LLC | 5.731 | 261 | ||||||
| 2026-04-15 | 13F | Park Capital Management, LLC / WI | 24.449 | 5,53 | 1.104 | 5,24 | ||||
| 2026-04-23 | 13F | Summit Investment Advisory Services, LLC | 25.356 | 10,62 | 1.145 | 10,31 | ||||
| 2026-04-13 | 13F | Mallini Complete Financial Planning LLC | 271 | 0,00 | ||||||
| 2026-01-28 | 13F | Cornerstone Advisory, LLC | 0 | -100,00 | 0 | |||||
| 2026-02-13 | 13F | Clarity Asset Management, Inc. | 95.581 | 2,51 | 4.332 | 2,53 | ||||
| 2026-04-20 | 13F | Breakwater Capital Group | 6.773 | 306 | ||||||
| 2026-02-17 | 13F | Gladstone Institutional Advisory LLC | 4.803 | 218 | ||||||
| 2026-04-10 | 13F | Perigon Wealth Management, LLC | 15.812 | 125,69 | 714 | 125,24 | ||||
| 2025-11-14 | 13F | Citadel Advisors Llc | 0 | -100,00 | 0 | |||||
| 2026-02-11 | 13F | Allianz Asset Management GmbH | 655 | 39,66 | 30 | 38,10 | ||||
| 2025-11-19 | 13F | Sunbelt Securities, Inc. | 0 | -100,00 | 0 | |||||
| 2026-02-17 | 13F | Cetera Investment Advisers | 62.603 | 66,59 | 2.837 | 66,69 | ||||
| 2026-04-17 | 13F | High Net Worth Advisory Group LLC | 20.000 | 0,00 | 903 | -0,33 | ||||
| 2026-02-10 | 13F | Envestnet Asset Management Inc | 212.133 | -29,90 | 9.614 | -29,89 | ||||
| 2026-02-03 | 13F | Crossmark Global Holdings, Inc. | 0 | -100,00 | 0 | |||||
| 2026-02-04 | 13F | Bridgewealth Advisory Group, LLC | 132.772 | 166,70 | 6.017 | 166,83 | ||||
| 2026-04-13 | 13F | Creative Financial Designs Inc /adv | 4.333 | 18,81 | 196 | 18,18 | ||||
| 2026-04-09 | 13F | TrueWealth Advisors, LLC | 20.044 | 75,36 | 905 | 74,71 | ||||
| 2026-01-29 | 13F | Camelot Portfolios, LLC | 1.000 | 45 | ||||||
| 2026-04-15 | 13F | DAVENPORT & Co LLC | 7.514 | 8,12 | 339 | 7,96 | ||||
| 2026-02-05 | 13F | Cambridge Investment Research Advisors, Inc. | 66.230 | -4,80 | 3 | 0,00 | ||||
| 2026-04-20 | 13F | ABLE Financial Group, LLC | 0 | -100,00 | 0 | |||||
| 2026-04-15 | 13F | Asio Capital, LLC | 188.799 | 30,10 | 8.528 | 29,25 | ||||
| 2026-04-08 | 13F | Wealth Enhancement Advisory Services, Llc | 116.315 | -51,56 | 5.257 | -51,87 | ||||
| 2026-02-03 | 13F | Legacy Wealth Managment, LLC/ID | 353 | 16 | ||||||
| 2026-04-23 | 13F | Laurel Wealth Planning LLC | 50.255 | 2,04 | 2.270 | 1,75 | ||||
| 2026-01-21 | 13F | Capital Investment Advisory Services, LLC | 1.537 | 53,24 | 70 | 53,33 | ||||
| 2026-04-21 | 13F | Econ Financial Services Corp | 36.121 | 22,62 | 1.632 | 22,17 | ||||
| 2026-02-03 | 13F | Emerald Investment Partners, Llc | 23.788 | 91,81 | 1.078 | 92,16 | ||||
| 2026-02-10 | 13F | Evolution Wealth Management Inc. | 3.201 | 145 | ||||||
| 2026-02-12 | 13F | StoneX Group Inc. | 4.437 | -50,20 | 202 | -50,12 | ||||
| 2026-01-15 | 13F | PFG Private Wealth Management, LLC | 0 | -100,00 | 0 | |||||
| 2026-04-17 | 13F | Worth Asset Management, LLC | 14.850 | 671 | ||||||
| 2026-02-17 | 13F | Royal Bank Of Canada | 33.340 | 223,63 | 1.511 | 223,55 | ||||
| 2026-02-06 | 13F | Vestmark Advisory Solutions, Inc. | 0 | -100,00 | 0 | |||||
| 2026-04-16 | 13F | Smith Thornton Advisors LLC | 5.555 | 0,00 | 251 | -0,40 | ||||
| 2026-01-23 | 13F | Hedeker Wealth, LLC | 0 | -100,00 | 0 | |||||
| 2026-02-13 | 13F | Beacon Financial Advisory LLC | 0 | -100,00 | 0 | |||||
| 2026-02-18 | 13F | Crusonia Wealth Advisors LLC | 6.413 | 291 | ||||||
| 2026-01-14 | 13F | ORG Partners LLC | 21.857 | 0,00 | 991 | 0,00 | ||||
| 2026-02-17 | 13F | Warren Averett Asset Management, LLC | 22.134 | 44,61 | 1.003 | 44,73 | ||||
| 2026-01-26 | 13F | Pennsylvania Capital Management Inc /adv | 6.422 | 291 | ||||||
| 2026-02-17 | 13F | Susquehanna International Group, Llp | 8.505 | 385 | ||||||
| 2026-02-13 | 13F | Mariner, LLC | 8.226 | 373 | ||||||
| 2026-02-13 | 13F | Colony Group, LLC | 289.744 | 13.131 | ||||||
| 2026-02-10 | 13F | Beckerman Institutional, LLC | 15.787 | -7,06 | 715 | -7,02 | ||||
| 2026-02-13 | 13F | Visionary Wealth Advisors | 69.212 | 4,45 | 3.137 | 4,46 | ||||
| 2026-02-17 | 13F | Cape Investment Advisory, Inc. | 300 | 14 | ||||||
| 2026-02-20 | 13F | SB Capital Management Inc | 20.220 | 916 | ||||||
| 2025-11-14 | 13F | Flow Traders U.s. Llc | 0 | -100,00 | 0 | |||||
| 2026-04-21 | 13F | Waterway Wealth Management, LLC | 91.438 | 71,08 | 4.130 | 70,52 | ||||
| 2026-01-23 | 13F | Assetmark, Inc | 2.307 | 105 | ||||||
| 2026-02-13 | 13F | Change Path, LLC | 32.458 | 22,83 | 1.471 | 22,81 | ||||
| 2026-02-06 | 13F | Tortoise Investment Management, LLC | 72.270 | 199,38 | 3.275 | 199,63 | ||||
| 2026-04-17 | 13F | Tectonic Advisors Llc | 0 | -100,00 | 0 | |||||
| 2026-02-12 | 13F | Wayfinding Financial, LLC | 41.399 | 2 | ||||||
| 2026-02-18 | 13F | GWM Advisors LLC | 203.572 | 17,11 | 9.226 | 17,13 | ||||
| 2026-02-02 | 13F | Truist Financial Corp | 172.803 | 0,35 | 7.831 | 0,37 | ||||
| 2026-01-29 | 13F | Quadcap Wealth Management, LLC | 43.785 | 1,89 | 1.961 | 0,67 | ||||
| 2026-02-12 | 13F | Commonwealth Equity Services, Llc | 164.841 | 46,19 | 7.471 | 149.300,00 | ||||
| 2026-02-06 | 13F | GPS Wealth Strategies Group, LLC | 1.851 | -69,11 | 84 | -69,37 | ||||
| 2026-01-22 | 13F | CarsonAllaria Wealth Management, Ltd. | 154.057 | 10,44 | 6.982 | 10,46 | ||||
| 2026-04-17 | 13F | RFG Advisory, LLC | 31.969 | 53,22 | 1.444 | 52,80 | ||||
| 2026-02-11 | 13F | LPL Financial LLC | 932.953 | 60,41 | 42.281 | 60,45 | ||||
| 2026-01-26 | 13F | AE Wealth Management LLC | 82 | 4 | ||||||
| 2026-04-08 | 13F | Lineweaver Wealth Advisors, LLC | 18.872 | 852 | ||||||
| 2026-04-17 | 13F | Krilogy Financial LLC | 0 | -100,00 | 0 | |||||
| 2026-02-10 | 13F | Advisor Resource Council | 9.415 | 429 | ||||||
| 2026-02-10 | 13F | Clear Point Advisors Inc. | 7.778 | 353 | ||||||
| 2026-02-09 | 13F | Sterling Investment Advisors, Ltd. | 37.015 | 84,15 | 1.678 | 84,29 | ||||
| 2026-04-22 | 13F | Mason & Associates, LLC | 46.823 | 10,70 | 2.115 | 10,33 | ||||
| 2026-01-26 | 13F | Cwm, Llc | 534.744 | 3,67 | 24 | 4,35 | ||||
| 2026-04-08 | 13F | Emergent Wealth Advisors, LLC | 7.227 | 40,99 | 326 | 40,52 | ||||
| 2026-01-29 | 13F | ProVise Management Group, LLC | 26.424 | 126,27 | 1.198 | 126,28 | ||||
| 2026-01-28 | 13F | Trademark Financial Management, LLC | 23.443 | 73,11 | 1.062 | 73,25 | ||||
| 2026-04-10 | 13F | Pure Financial Advisors, Inc. | 9.200 | 416 | ||||||
| 2026-02-13 | 13F | Morgan Stanley | 9.535 | 953.400,00 | 432 | |||||
| 2026-02-03 | 13F | RWM Asset Management, LLC | 28.893 | 8,68 | 1.317 | 9,30 | ||||
| 2026-02-17 | 13F | GeoWealth Management, LLC | 147.381 | -0,62 | 6.679 | -0,60 | ||||
| 2026-01-29 | 13F | Sanctuary Advisors, LLC | 8.600 | 51,76 | 390 | 51,95 | ||||
| 2026-02-13 | 13F | Stifel Financial Corp | 40.922 | 9,98 | 1.855 | 10,03 | ||||
| 2026-04-21 | 13F | Avaii Wealth Management, Llc | 10.062 | 14,44 | 454 | 14,07 | ||||
| 2026-02-11 | 13F | Jpmorgan Chase & Co | 1.815 | 110,31 | 82 | 110,26 | ||||
| 2026-02-12 | 13F | Principal Securities, Inc. | 0 | -100,00 | 0 | -100,00 | ||||
| 2026-02-10 | 13F | Goldman Sachs Group Inc | 15.263 | 692 | ||||||
| 2026-02-13 | 13F | Advyzon Investment Management, LLC | 5.401 | 245 | ||||||
| 2026-01-26 | 13F | Kelman-Lazarov, Inc. | 16.697 | -4,95 | 757 | -4,91 | ||||
| 2025-11-05 | 13F | Lokken Investment Group LLC | 43.368 | 10,77 | 1.965 | 13,52 | ||||
| 2026-02-12 | 13F | Jane Street Group, Llc | 58.668 | 323,81 | 2.659 | 323,92 | ||||
| 2026-02-13 | 13F | Wells Fargo & Company/mn | 111 | 5 | ||||||
| 2026-02-06 | 13F | HighTower Advisors, LLC | 49.788 | 415,94 | 2.256 | 416,25 | ||||
| 2026-04-10 | 13F | Harbor Group, Inc. | 4.792 | 216 | ||||||
| 2026-04-16 | 13F | Sprinkle Financial Consultants LLC | 98.738 | 56,00 | 4.460 | 55,51 | ||||
| 2026-02-06 | 13F | Global Retirement Partners, LLC | 17.309 | 0,73 | 784 | 0,77 | ||||
| 2026-04-23 | 13F | Cornerstone Wealth Management, LLC | 13.879 | 83,08 | 627 | 82,51 | ||||
| 2026-04-24 | 13F | Able Wealth Management LLC | 81.147 | 88,35 | 3.665 | 87,76 | ||||
| 2025-11-12 | 13F | Blair William & Co/il | 0 | -100,00 | 0 | -100,00 | ||||
| 2026-02-13 | 13F | Lavaca Capital Llc | 1.069 | 48 | ||||||
| 2026-02-13 | 13F | Mml Investors Services, Llc | 47.289 | 4,91 | 2.143 | 4,95 | ||||
| 2026-04-07 | 13F | Farther Finance Advisors, LLC | 15.380 | 40,82 | 694 | 40,28 | ||||
| 2026-02-11 | 13F | O'shaughnessy Asset Management, Llc | 67 | 3 | ||||||
| 2026-02-09 | 13F | Harbour Investments, Inc. | 4.762 | 105,35 | 216 | 104,76 | ||||
| 2026-02-12 | 13F | Steward Partners Investment Advisory, Llc | 9.850 | 77,48 | 446 | 77,69 | ||||
| 2026-04-22 | 13F | Wetzel Investment Advisors, Inc. | 12.000 | 0,00 | 542 | -0,18 |