Grundlæggende statistik
| Institutionelle aktier (lange) | 224.133.849 - 95,11% (ex 13D/G) - change of -69,85MM shares -23,76% MRQ |
| Institutionel værdi (lang) | $ 3.774.409 USD ($1000) |
Institutionelt ejerskab og aktionærer
Independence Realty Trust, Inc. (US:IRT) har 378 institutionelle ejere og aktionærer, der har indsendt 13D/G- eller 13F-formularer til Securities Exchange Commission (SEC). Disse institutioner har i alt 224,133,849 aktier. Største aktionærer omfatter BlackRock, Inc., Vanguard Group Inc, State Street Corp, Alliancebernstein L.p., UBS Group AG, Delaware Management Holdings, Inc., Prudential Financial Inc, Geode Capital Management, Llc, Morgan Stanley, and Citadel Advisors Llc .
Independence Realty Trust, Inc. (NYSE:IRT) institutionel ejerskabsstruktur viser aktuelle positioner i virksomheden efter institutioner og fonde, samt seneste ændringer i positionsstørrelse. Større aktionærer kan omfatte individuelle investorer, investeringsforeninger, hedgefonde eller institutioner. Skema 13D angiver, at investoren besidder (eller besidder) mere end 5 % af virksomheden og har til hensigt (eller har til hensigt at) aktivt at forfølge en ændring i forretningsstrategi. Skema 13G indikerer en passiv investering på over 5%.
The share price as of March 30, 2026 is 14,81 / share. Previously, on March 31, 2025, the share price was 21,23 / share. This represents a decline of 30,24% over that period.

Fondens stemningsscore
Fund Sentiment Score (fka Ownership Accumulation Score) finder de aktier, der bliver mest købt af fonde. Det er resultatet af en sofistikeret, multi-faktor kvantitativ model, der identificerer virksomheder med de højeste niveauer af institutionel akkumulering. Scoringsmodellen bruger en kombination af den samlede stigning i oplyste ejere, ændringerne i porteføljeallokeringer i disse ejere og andre målinger. Tallet går fra 0 til 100, hvor højere tal indikerer et højere niveau af akkumulering for sine jævnaldrende, og 50 er gennemsnittet.
Opdateringsfrekvens: Dagligt
Se Ownership Explorer, som giver en liste over højest rangerende virksomheder.
AI+ Ask Fintel’s AI assistant about Independence Realty Trust, Inc..
Select a question to share a public post with an AI-crafted answer.
Thinking of good questions…
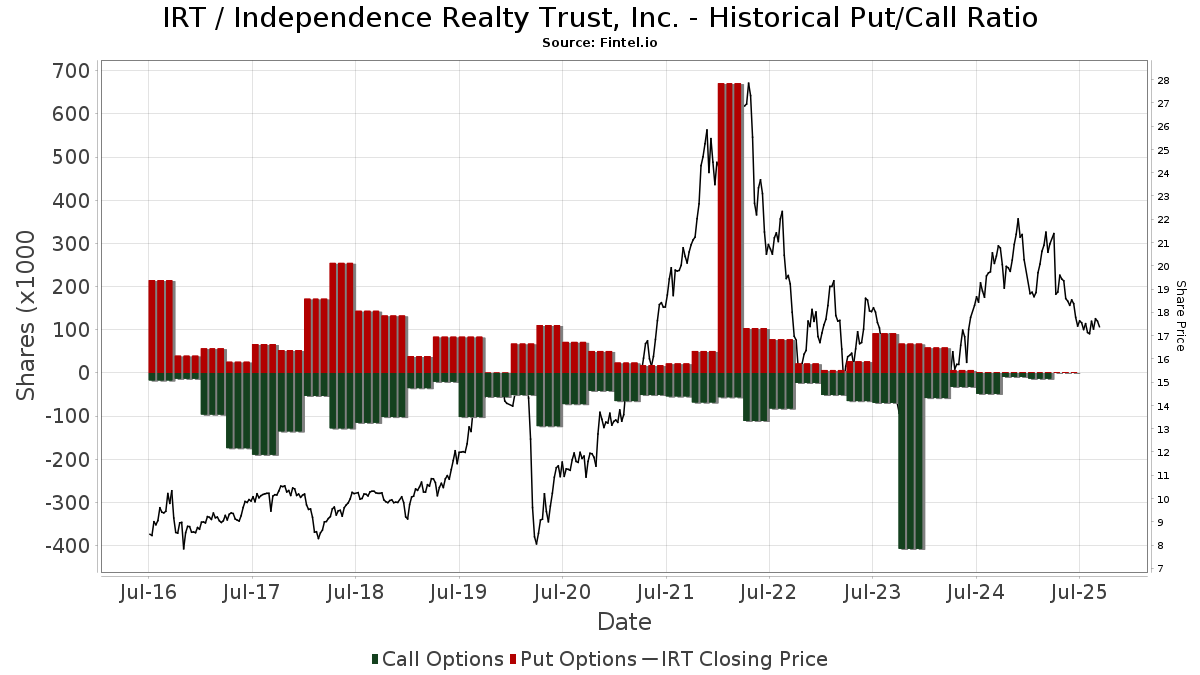
Institutionel Put/Call-forhold
Ud over at indberette standardaktie- og gældsudstedelser skal institutter med mere end 100 mill. aktiver under forvaltning også oplyse deres put- og call-optionsbeholdninger. Da salgsoptioner generelt indikerer negativ stemning, og købsoptioner indikerer positiv stemning, kan vi få en fornemmelse af den overordnede institutionelle stemning ved at plotte forholdet mellem put og kald. Diagrammet til højre viser det historiske put/call-forhold for dette instrument.
Brug af Put/Call Ratio som en indikator for investorernes stemning overvinder en af de vigtigste mangler ved at bruge totalt institutionelt ejerskab, som er, at en betydelig mængde af aktiver under forvaltning investeres passivt for at spore indekser. Passivt forvaltede fonde køber typisk ikke optioner, så indikatoren for put/call-forholdet følger mere nøje følelsen af aktivt forvaltede fonde.
13D/G-arkivering
Vi præsenterer 13D/G ansøgninger separat fra 13F ansøgninger på grund af den forskellige behandling af SEC. 13D/G-ansøgninger kan indgives af grupper af investorer (med én ledende), hvorimod 13F-ansøgninger ikke kan. Dette resulterer i situationer, hvor en investor kan indsende en 13D/G, der rapporterer én værdi for de samlede aktier (der repræsenterer alle de aktier, der ejes af investorgruppen), men derefter indsender en 13F, der rapporterer en anden værdi for de samlede aktier (der udelukkende repræsenterer deres egne) ejendomsret). Det betyder, at aktieejerskab af 13D/G-arkiver og 13F-arkiveringer ofte ikke er direkte sammenlignelige, så vi præsenterer dem separat.
Bemærk: Fra den 16. maj 2021 viser vi ikke længere ejere, der ikke har indsendt en 13D/G inden for det seneste år. Tidligere viste vi den fulde historie af 13D/G-arkiver. Generelt skal enheder, der er forpligtet til at indgive 13D/G-ansøgninger, indgive mindst årligt, før de indsender en afsluttende ansøgning. Dog forlader fonde nogle gange positioner uden at indsende en afsluttende ansøgning (dvs. de afvikler), så visning af den fulde historie resulterede nogle gange i forvirring om det nuværende ejerskab. For at undgå forvirring viser vi nu kun 'aktuelle' ejere - det vil sige - ejere, der har anmeldt inden for det seneste år.
Upgrade to unlock premium data.
| Fil dato | Form | Investor | Forrige Aktier |
Seneste Aktier |
Δ Aktier (Procent) |
Ejendomsret (Procent) |
Δ Ejerskab (Procent) |
|
|---|---|---|---|---|---|---|---|---|
| 2026-03-27 | VANGUARD GROUP INC | 32,400,936 | 0 | -100.00 | 0.00 | -100.00 | ||
| 2026-02-17 | T. Rowe Price Investment Management, Inc. | 11,920,616 | 10,170,657 | -14.68 | 4.30 | -15.69 | ||
| 2025-11-14 | Long Pond Capital, LP | 12,301,684 | 5.26 | |||||
| 2025-11-12 | WELLINGTON MANAGEMENT GROUP LLP | 11,360,979 | 6,094,776 | -46.35 | 2.60 | -48.51 | ||
| 2025-04-29 | BlackRock, Inc. | 35,944,182 | 33,393,323 | -7.10 | 14.40 | -10.00 |
13F og NPORT arkivering
Detaljer om 13F-arkivering er gratis. Detaljer om NP-ansøgninger kræver et premium-medlemskab. Grønne rækker angiver nye positioner. Røde rækker angiver lukkede positioner. Klik på linket ikon for at se den fulde transaktionshistorik.
Opgrader
for at låse premium-data op og eksportere til Excel ![]() .
.
| Fil dato | Kilde | Investor | Type | Gennemsnitlig pris (Øst) |
Aktier | Δ Aktier (%) |
Rapporteret Værdi ($1000) |
Δ Værdi (%) |
Port Alloc (%) |
|
|---|---|---|---|---|---|---|---|---|---|---|
| 2026-02-11 | 13F | Cerity Partners LLC | 15.174 | -11,73 | 265 | -5,69 | ||||
| 2026-02-09 | 13F | Hartland & Co., LLC | 776 | 278,54 | 14 | 333,33 | ||||
| 2026-02-13 | 13F | Sei Investments Co | 249.501 | -51,59 | 4.361 | -48,37 | ||||
| 2026-01-29 | 13F | State Of Michigan Retirement System | 56.400 | 1,44 | 986 | 8,12 | ||||
| 2026-02-13 | 13F | Parkside Financial Bank & Trust | 588 | 67,52 | 10 | 100,00 | ||||
| 2026-02-13 | 13F | Manufacturers Life Insurance Company, The | 0 | -100,00 | 0 | |||||
| 2025-11-14 | 13F | WealthTrak Capital Management LLC | 0 | -100,00 | 0 | |||||
| 2026-01-26 | 13F | KBC Group NV | 8.393 | 0,00 | 0 | |||||
| 2026-01-26 | 13F | Private Trust Co Na | 1.119 | 0,00 | 20 | 5,56 | ||||
| 2025-11-07 | 13F | Shell Asset Management Co | 8.324 | -55,95 | 0 | |||||
| 2025-11-21 | 13F/A | CIBC Bancorp USA Inc. | 25.095 | 411 | ||||||
| 2026-01-09 | 13F | SG Americas Securities, LLC | 44.367 | -11,10 | 1 | |||||
| 2026-02-03 | 13F | Crossmark Global Holdings, Inc. | 15.801 | -3,46 | 276 | 2,99 | ||||
| 2026-02-13 | 13F | First Trust Advisors Lp | 108.564 | 202,34 | 1.898 | 222,62 | ||||
| 2026-01-20 | 13F | Perpetual Ltd | 25.835 | -28,46 | 452 | -23,69 | ||||
| 2026-01-28 | 13F | Teacher Retirement System Of Texas | 571.568 | 1.767,50 | 9.991 | 1.894,21 | ||||
| 2026-02-17 | 13F | Millennium Management Llc | 1.601.973 | 7.297,36 | 28.002 | 7.810,17 | ||||
| 2026-02-17 | 13F | DV Trading LLC | 600 | 10 | ||||||
| 2026-01-30 | 13F/A | M&t Bank Corp | 33.908 | 593 | ||||||
| 2026-02-13 | 13F | Caxton Associates Llp | 0 | -100,00 | 0 | -100,00 | ||||
| 2026-02-12 | 13F | State Board Of Administration Of Florida Retirement System | 64.442 | 0,00 | 1.126 | 6,63 | ||||
| 2026-02-12 | 13F | Penserra Capital Management LLC | 30.756 | 14,30 | 1 | |||||
| 2026-02-13 | 13F | Marshall Wace, Llp | 0 | -100,00 | 0 | |||||
| 2026-01-27 | 13F | Gf Fund Management Co. Ltd. | 3.874 | 0,57 | 68 | 6,35 | ||||
| 2026-02-04 | 13F | Money Concepts Capital Corp | 26.246 | -10,58 | 459 | -4,78 | ||||
| 2026-02-12 | 13F | Hm Payson & Co | 1.810 | -37,46 | 32 | -34,04 | ||||
| 2026-02-13 | 13F | Dockside LLC | 61.874 | 1.082 | ||||||
| 2026-02-18 | 13F | GWM Advisors LLC | 14.320 | 250 | ||||||
| 2026-02-05 | 13F | Allworth Financial LP | 4.457 | 4,06 | 78 | 10,00 | ||||
| 2026-02-10 | 13F | Easterly Investment Partners Llc | 36.509 | -94,69 | 638 | -94,34 | ||||
| 2026-01-15 | 13F | Retirement Systems of Alabama | 286.512 | 1,52 | 5.008 | 8,28 | ||||
| 2026-01-30 | 13F | Keybank National Association/oh | 26.266 | -20,03 | 459 | -14,68 | ||||
| 2026-02-10 | 13F | Sfmg, Llc | 11.126 | 0,00 | 194 | 6,59 | ||||
| 2026-02-04 | 13F | Swiss Life Asset Management Ltd | 11.083 | 0,00 | 194 | 6,63 | ||||
| 2026-02-06 | 13F | Larson Financial Group LLC | 504 | 0,00 | 9 | 0,00 | ||||
| 2026-02-17 | 13F | Mercer Global Advisors Inc /adv | 28.952 | 36,50 | 506 | 45,82 | ||||
| 2026-01-28 | 13F | Arizona State Retirement System | 65.075 | -5,93 | 1.138 | 0,35 | ||||
| 2026-01-28 | 13F | Peregrine Capital Management Llc | 288.385 | -4,71 | 5.041 | 1,61 | ||||
| 2026-02-17 | 13F | Ameriflex Group, Inc. | 3.996 | -50,00 | 70 | -46,92 | ||||
| 2026-01-28 | 13F | Consolidated Planning Corp | 10.778 | 0,00 | 188 | 6,82 | ||||
| 2026-02-12 | 13F | Dimensional Fund Advisors Lp | 3.339.433 | 2,84 | 58.376 | 9,68 | ||||
| 2026-01-27 | 13F | First Horizon Corp | 1.627 | 0,43 | 28 | 7,69 | ||||
| 2026-02-10 | 13F | Cbre Clarion Securities Llc | 1.871.603 | 23,44 | 32.716 | 31,65 | ||||
| 2026-02-13 | 13F | Centaurus Financial, Inc. | 42.240 | -1,29 | 1 | |||||
| 2026-02-02 | 13F | Principal Financial Group Inc | 517.203 | -1,72 | 9.041 | 4,81 | ||||
| 2026-01-08 | 13F | Armstrong Advisory Group, Inc | 4.724 | 0,66 | 83 | 7,89 | ||||
| 2026-01-22 | 13F | Investment Advisory Services Inc /tx /adv | 21.884 | -1,34 | 383 | 5,23 | ||||
| 2026-02-12 | 13F | Great Valley Advisor Group, Inc. | 13.477 | -1,82 | 235 | 4,44 | ||||
| 2026-01-15 | 13F | SILVER OAK SECURITIES, Inc | 23.740 | 0,00 | 422 | 8,23 | ||||
| 2025-11-14 | 13F | Nekton Capital Ltd. | 93.225 | 1.528 | ||||||
| 2026-02-13 | 13F | Caitong International Asset Management Co., Ltd | 0 | -100,00 | 0 | |||||
| 2026-02-09 | 13F | Coldstream Capital Management Inc | 10.702 | 187 | ||||||
| 2025-11-04 | 13F | Gitterman Wealth Management, LLC | 0 | -100,00 | 0 | |||||
| 2026-02-17 | 13F | Alliancebernstein L.p. | 8.683.124 | -4,80 | 151.781 | 1,53 | ||||
| 2026-01-21 | 13F | Vanderbilt University | 0 | -100,00 | 0 | |||||
| 2026-02-06 | 13F | EverSource Wealth Advisors, LLC | 775 | -50,86 | 14 | -48,00 | ||||
| 2026-02-12 | 13F | EntryPoint Capital, LLC | 54.026 | -18,52 | 944 | -13,08 | ||||
| 2026-01-14 | 13F | Southland Equity Partners LLC | 31.281 | 0,00 | 547 | 6,64 | ||||
| 2026-02-12 | 13F | Quadrant Capital Group Llc | 38.880 | 85,32 | 680 | 97,96 | ||||
| 2026-02-17 | 13F | Citadel Advisors Llc | 5.117.405 | 47,35 | 89.452 | 57,15 | ||||
| 2026-02-10 | 13F | Anchor Capital Advisors Llc | 90.577 | 1.583 | ||||||
| 2026-02-12 | 13F | CIBC Private Wealth Group, LLC | 14.040 | -14,42 | 245 | -8,58 | ||||
| 2026-02-06 | 13F | Global Retirement Partners, LLC | 4.921 | 15,92 | 86 | 24,64 | ||||
| 2026-01-14 | 13F | Bell Bank | 88.006 | 0,00 | 1.538 | 6,66 | ||||
| 2026-02-13 | 13F | Umb Bank N A/mo | 1.092 | -13,26 | 19 | -5,00 | ||||
| 2026-02-12 | 13F | Concorde Asset Management, LLC | 22.743 | 33,88 | 398 | 43,84 | ||||
| 2026-02-12 | 13F | Nuveen, LLC | 678.472 | -1,39 | 11.860 | 5,16 | ||||
| 2025-11-12 | 13F | Steward Partners Investment Advisory, Llc | 0 | -100,00 | 0 | |||||
| 2026-02-17 | 13F | Landmark Investment Partners, L.p. | Call | 0 | -100,00 | 0 | ||||
| 2026-02-17 | 13F | Sherbrooke Park Advisers Llc | 0 | -100,00 | 0 | |||||
| 2026-02-13 | 13F | MAI Capital Management | 784 | 14,45 | 14 | 18,18 | ||||
| 2026-02-17 | 13F | T. Rowe Price Investment Management, Inc. | 2.680.667 | -77,48 | 47 | -76,41 | ||||
| 2025-12-09 | 13F/A | Tudor Investment Corp Et Al | 0 | -100,00 | 0 | |||||
| 2026-01-23 | 13F | Blue Sky Capital Consultants Group, Inc. | 301.516 | -5,40 | 5.271 | 0,88 | ||||
| 2025-11-14 | 13F | Wood Tarver Financial Group, LLC | 0 | -100,00 | 0 | |||||
| 2026-02-17 | 13F | Sophron Capital Management L.P. | 0 | -100,00 | 0 | |||||
| 2025-11-20 | 13F | Asset Dedication, LLC | 0 | -100,00 | 0 | |||||
| 2026-02-13 | 13F | Rhumbline Advisers | 753.542 | -4,74 | 13.172 | 1,59 | ||||
| 2026-02-17 | 13F | National Asset Management, Inc. | 28.598 | -5,48 | 500 | 0,81 | ||||
| 2026-02-02 | 13F | Mutual Advisors, LLC | 25.020 | -5,58 | 437 | 1,16 | ||||
| 2026-02-13 | 13F | Dynamic Technology Lab Private Ltd | 0 | -100,00 | 0 | |||||
| 2026-02-17 | 13F | Norinchukin Bank, The | 10.926 | -0,96 | 191 | 5,56 | ||||
| 2026-01-28 | 13F | Klp Kapitalforvaltning As | 49.900 | 4,18 | 879 | 10,98 | ||||
| 2026-02-13 | 13F | Venture Visionary Partners LLC | 21.191 | 0,00 | 370 | 6,63 | ||||
| 2026-02-12 | 13F | Jane Street Group, Llc | 268.077 | -48,57 | 4.686 | -45,16 | ||||
| 2025-11-12 | 13F | Neo Ivy Capital Management | 0 | -100,00 | 0 | -100,00 | ||||
| 2026-02-17 | 13F | Ameriprise Financial Inc | 538.665 | -3,94 | 9.418 | 2,46 | ||||
| 2026-02-17 | 13F | Delaware Management Holdings, Inc. | 7.406.406 | 129.464 | ||||||
| 2026-02-17 | 13F | Quantinno Capital Management LP | 41.947 | -3,67 | 733 | 2,81 | ||||
| 2025-11-04 | 13F | Convergence Investment Partners, LLC | 0 | -100,00 | 0 | |||||
| 2025-11-14 | 13F | Point72 Asia (Singapore) Pte. Ltd. | 1.699 | 28 | ||||||
| 2026-01-28 | 13F | Geneos Wealth Management Inc. | 30.075 | -12,37 | 526 | -6,58 | ||||
| 2026-02-12 | 13F | Federated Hermes, Inc. | 19.205 | -78,74 | 336 | -77,36 | ||||
| 2026-02-02 | 13F | Cornerstone Planning Group LLC | 0 | -100,00 | 0 | |||||
| 2026-02-12 | 13F | California Public Employees Retirement System | 440.187 | 4,54 | 7.694 | 11,49 | ||||
| 2026-01-27 | 13F | Berger Financial Group, Inc | 233.845 | -9,72 | 4.088 | -3,72 | ||||
| 2026-02-17 | 13F | Bamco Inc /ny/ | 0 | -100,00 | 0 | |||||
| 2026-02-04 | 13F | Securian Asset Management, Inc | 17.398 | -0,48 | 304 | 6,29 | ||||
| 2026-02-13 | 13F | Smartleaf Asset Management LLC | 2.875 | 97,87 | 51 | 121,74 | ||||
| 2026-02-17 | 13F | MIRAE ASSET GLOBAL ETFS HOLDINGS Ltd. | 127.646 | 0,84 | 2.231 | 7,57 | ||||
| 2026-02-09 | 13F | Huntington National Bank | 2.531 | 10,57 | 44 | 18,92 | ||||
| 2026-02-17 | 13F | Janus Henderson Group Plc | 103.797 | 0,00 | 1.815 | 6,64 | ||||
| 2026-02-17 | 13F | XTX Topco Ltd | 110.632 | 7,27 | 1.934 | 14,38 | ||||
| 2026-02-09 | 13F | Fisher Asset Management, LLC | 1.145.635 | -4,70 | 20.026 | 1,63 | ||||
| 2026-02-02 | 13F | Truist Financial Corp | 0 | -100,00 | 0 | |||||
| 2025-10-17 | 13F | FSC Wealth Advisors, LLC | 0 | -100,00 | 0 | -100,00 | ||||
| 2026-02-04 | 13F | Prosperitas Financial LLC | 58.373 | -0,89 | 1.020 | 5,70 | ||||
| 2026-02-10 | 13F | Intech Investment Management Llc | 110.250 | -8,06 | 1.927 | -1,93 | ||||
| 2026-01-20 | 13F | Harbor Capital Advisors, Inc. | 602 | -1,63 | 0 | |||||
| 2026-02-11 | 13F | Deutsche Bank Ag\ | 309.689 | 4,79 | 5.413 | 11,77 | ||||
| 2026-01-27 | 13F | Asset Management One Co., Ltd. | 350.320 | 3,46 | 6.173 | 11,23 | ||||
| 2026-02-13 | 13F | SRS Capital Advisors, Inc. | 2.386 | -9,62 | 42 | -4,65 | ||||
| 2026-02-17 | 13F | Argosy-Lionbridge Management, LLC | 1.536.859 | 106,31 | 26.862 | 120,02 | ||||
| 2026-02-11 | 13F | Group One Trading, L.p. | Put | 5.300 | -35,37 | 93 | -31,34 | |||
| 2025-11-14 | 13F | Squarepoint Ops LLC | 0 | -100,00 | 0 | |||||
| 2026-02-11 | 13F | Group One Trading, L.p. | 4.270 | 75 | ||||||
| 2026-02-17 | 13F | Farringdon Capital, Ltd. | 0 | -100,00 | 0 | |||||
| 2025-11-14 | 13F | ExodusPoint Capital Management, LP | 302.820 | 4.963 | ||||||
| 2026-02-02 | 13F | Benjamin Edwards Inc | 0 | -100,00 | 0 | |||||
| 2026-01-29 | 13F | UMA Financial Services, Inc. | 119 | 108,77 | 2 | |||||
| 2026-02-03 | 13F | Navigoe, LLC | 422 | 0,00 | 0 | |||||
| 2026-02-06 | 13F | Creative Financial Designs Inc /adv | 1.053 | -65,69 | 18 | -64,00 | ||||
| 2026-01-30 | 13F | Jennison Associates Llc | 4.603.487 | -26,07 | 80.469 | -21,16 | ||||
| 2025-11-14 | 13F | D. E. Shaw & Co., Inc. | 0 | -100,00 | 0 | |||||
| 2025-11-07 | 13F | Beacon Capital Management, LLC | 0 | -100,00 | 0 | |||||
| 2025-11-13 | 13F | Vestcor Inc | 0 | -100,00 | 0 | |||||
| 2026-02-03 | 13F | Sumitomo Mitsui DS Asset Management Company, Ltd | 58.360 | 5,82 | 1.020 | 12,96 | ||||
| 2026-02-13 | 13F | Neuberger Berman Group LLC | 17.530 | 14,45 | 306 | 21,91 | ||||
| 2026-02-13 | 13F | Toroso Investments, LLC | 128.614 | 8,01 | 2.248 | 15,22 | ||||
| 2026-02-03 | 13F | Mitsubishi UFJ Kokusai Asset Management Co., Ltd. | 188.864 | 7,93 | 3.324 | 15,94 | ||||
| 2026-02-05 | 13F/A | Fulcrum Asset Management LLP | 896 | 0,00 | 16 | 7,14 | ||||
| 2026-01-29 | 13F | Quent Capital, LLC | 238 | 22,68 | 4 | 33,33 | ||||
| 2026-02-13 | 13F | Fiduciary Trust Co | 17.481 | -1,65 | 306 | 4,81 | ||||
| 2026-02-17 | 13F | Gillson Capital LP | 654.300 | 11 | ||||||
| 2026-01-29 | 13F | Kestra Private Wealth Services, Llc | 60.721 | -2,44 | 1.061 | 4,02 | ||||
| 2026-02-05 | 13F | Northwestern Mutual Investment Management Company, Llc | 53.412 | 2,66 | 934 | 9,51 | ||||
| 2026-02-10 | 13F | Daiwa Securities Group Inc. | 711.275 | 40,63 | 12 | 50,00 | ||||
| 2026-01-08 | 13F | Aurora Investment Managers, LLC. | 193.742 | -0,26 | 3 | 0,00 | ||||
| 2026-02-12 | 13F | Hohimer Wealth Management, Llc | 0 | -100,00 | 0 | |||||
| 2026-02-06 | 13F | ProShare Advisors LLC | 53.574 | 6,76 | 936 | 13,87 | ||||
| 2025-11-12 | 13F | Quantbot Technologies LP | 0 | -100,00 | 0 | |||||
| 2026-01-16 | 13F | Perigon Wealth Management, LLC | 12.468 | 0,90 | 218 | 7,43 | ||||
| 2026-01-29 | 13F | Teachers Retirement System Of The State Of Kentucky | 76.022 | 0,00 | 1 | 0,00 | ||||
| 2025-10-17 | 13F | Carderock Capital Management Inc | 0 | -100,00 | 0 | |||||
| 2025-11-14 | 13F | Man Group plc | 0 | -100,00 | 0 | |||||
| 2026-02-18 | 13F | Mackenzie Financial Corp | 16.071 | 1,40 | 285 | 10,04 | ||||
| 2026-02-19 | 13F | Invesco Ltd. | 1.373.606 | 12,50 | 24.011 | 19,98 | ||||
| 2026-02-13 | 13F | Public Employees Retirement Association Of Colorado | 12.508 | 0,00 | 0 | |||||
| 2026-02-12 | 13F | Keel Point, LLC | 17.262 | 0,46 | 302 | 7,12 | ||||
| 2026-02-17 | 13F | Creative Planning | 107.715 | 21,86 | 1.883 | 29,97 | ||||
| 2026-02-13 | 13F | Kestra Advisory Services, LLC | 0 | -100,00 | 0 | |||||
| 2026-01-27 | 13F | Belpointe Asset Management LLC | 16.616 | -0,27 | 290 | 6,23 | ||||
| 2026-02-12 | 13F | Hrt Financial Lp | 0 | -100,00 | 0 | |||||
| 2026-01-23 | 13F | State of Alaska, Department of Revenue | 155.594 | 1,91 | 3 | 0,00 | ||||
| 2026-02-11 | 13F | M Holdings Securities, Inc. | 14.230 | 0 | ||||||
| 2026-02-12 | 13F | Hilton Capital Management, LLC | 136.789 | -64,30 | 2.391 | -61,92 | ||||
| 2026-02-17 | 13F | Tower Research Capital LLC (TRC) | 9.775 | -44,42 | 171 | -40,97 | ||||
| 2026-02-05 | 13F | AlphaCore Capital LLC | 40.241 | -18,48 | 703 | -13,95 | ||||
| 2026-01-28 | 13F | Universal- Beteiligungs- und Servicegesellschaft mbH | 225.070 | 9,14 | 3.934 | 16,42 | ||||
| 2026-01-23 | 13F | Farther Finance Advisors, LLC | 1.810 | 70,27 | 32 | 82,35 | ||||
| 2026-02-17 | 13F | Raymond James Financial Inc | 272.850 | -29,91 | 4.799 | -24,80 | ||||
| 2026-02-06 | 13F | Handelsbanken Fonder AB | 96.061 | 40,11 | 2 | 0,00 | ||||
| 2026-01-26 | 13F | B&I Capital AG | 510.860 | 6,79 | 8.930 | 13,89 | ||||
| 2026-02-11 | 13F | LPL Financial LLC | 346.625 | -5,14 | 6.059 | 1,19 | ||||
| 2026-02-12 | 13F | Ensign Peak Advisors, Inc | 11.323 | -69,94 | 198 | -68,07 | ||||
| 2026-02-17 | 13F | Point72 Asset Management, L.P. | 0 | -100,00 | 0 | |||||
| 2026-02-17 | 13F | Price T Rowe Associates Inc /md/ | 208.610 | 7,13 | 4 | 0,00 | ||||
| 2026-02-10 | 13F | Norges Bank | 2.981.783 | 52.122 | ||||||
| 2026-02-17 | 13F | Amundi | 126.997 | 3,33 | 2.220 | 11,73 | ||||
| 2026-01-12 | 13F | Pensionfund Sabic | 23.000 | 9,52 | 0 | |||||
| 2026-03-06 | 13F | Hsbc Holdings Plc | 383.503 | 21,99 | 6.704 | 30,10 | ||||
| 2026-02-10 | 13F | Rothschild Investment Llc | 23.314 | 1,18 | 408 | 7,96 | ||||
| 2026-01-20 | 13F | AdvisorNet Financial, Inc | 743 | 1,09 | 13 | 0,00 | ||||
| 2026-02-09 | 13F | Geode Capital Management, Llc | 6.445.967 | 2,36 | 112.690 | 9,16 | ||||
| 2026-02-11 | 13F | J.w. Cole Advisors, Inc. | 140.310 | -4,99 | 2.337 | -3,47 | ||||
| 2026-01-30 | 13F | New York State Teachers Retirement System | 344.966 | -0,51 | 6 | 20,00 | ||||
| 2026-02-10 | 13F | Goldman Sachs Group Inc | 2.360.276 | -33,90 | 41.258 | -29,51 | ||||
| 2026-02-18 | 13F | State of Tennessee, Treasury Department | 62.547 | -4,11 | 1.045 | -2,34 | ||||
| 2026-01-16 | 13F | Ronald Blue Trust, Inc. | 62 | 0,00 | 1 | 0,00 | ||||
| 2026-02-06 | 13F | Pathway Financial Advisers, LLC | 0 | -100,00 | 0 | |||||
| 2026-01-21 | 13F | Raleigh Capital Management Inc. | 1 | 0,00 | 0 | |||||
| 2026-02-17 | 13F | Woodline Partners LP | 2.799.913 | 48.942 | ||||||
| 2026-01-22 | 13F | Apollon Wealth Management, LLC | 24.660 | -27,18 | 431 | -22,34 | ||||
| 2026-02-13 | 13F | Gen-Wealth Partners Inc | 462 | 0,87 | 8 | 14,29 | ||||
| 2026-02-12 | 13F | Hollencrest Capital Management | 0 | -100,00 | 0 | |||||
| 2026-02-17 | 13F | Greenland Capital Management LP | 246.633 | 796,49 | 4.311 | 858,00 | ||||
| 2026-01-20 | 13F | Investment Research & Advisory Group, Inc. | 29.987 | -17,74 | 524 | -12,23 | ||||
| 2026-02-12 | 13F | IFM Investors Pty Ltd | 38.532 | 1,60 | 1 | -100,00 | ||||
| 2026-01-23 | 13F | Integrated Wealthcare, Llc | 13.787 | 241 | ||||||
| 2026-01-26 | 13F | Cwm, Llc | 39.365 | 1,84 | 1 | |||||
| 2026-02-20 | 13F | Kovitz Investment Group Partners, LLC | 0 | -100,00 | 0 | |||||
| 2026-01-23 | 13F | Sumitomo Mitsui Trust Holdings, Inc. | 261.517 | 1,85 | 4.571 | 8,63 | ||||
| 2025-11-12 | 13F | Simplex Trading, Llc | 0 | -100,00 | 0 | |||||
| 2026-01-27 | 13F | Elevated Capital Advisors, LLC | 11 | 0 | ||||||
| 2026-02-12 | 13F | Johnson Financial Group, Inc. | 1.054 | 19 | ||||||
| 2026-02-17 | 13F | Fmr Llc | 42.411 | 13,31 | 741 | 20,88 | ||||
| 2026-02-11 | 13F | Winton Capital Group Ltd | 23.375 | -12,12 | 409 | -6,21 | ||||
| 2026-02-17 | 13F | Frontier Capital Management Co Llc | 3.072.365 | -9,25 | 53.705 | -3,21 | ||||
| 2026-02-12 | 13F | Jane Street Group, Llc | Put | 0 | -100,00 | 0 | -100,00 | |||
| 2026-02-11 | 13F | Fox Run Management, L.l.c. | 0 | -100,00 | 0 | |||||
| 2026-02-11 | 13F | Metis Global Partners, LLC | 56.473 | 7,32 | 987 | 14,50 | ||||
| 2026-02-13 | 13F | Great West Life Assurance Co /can/ | 525.522 | 2,35 | 9 | 12,50 | ||||
| 2026-02-13 | 13F | Colony Group, LLC | 20.719 | 362 | ||||||
| 2026-01-14 | 13F | Exchange Traded Concepts, Llc | 246.393 | -8,18 | 4.307 | -2,09 | ||||
| 2026-02-09 | 13F | Hantz Financial Services, Inc. | 68.423 | 2,17 | 1 | 0,00 | ||||
| 2025-10-24 | 13F | Hemington Wealth Management | 44 | 0,00 | 0 | |||||
| 2026-02-04 | 13F | Advisor OS, LLC | 0 | -100,00 | 0 | |||||
| 2026-02-17 | 13F | Engineers Gate Manager LP | 4.299.707 | 16.719,38 | 75.159 | 17.880,38 | ||||
| 2026-01-20 | 13F | Sheets Smith Wealth Management | 79.990 | -3,61 | 1.398 | 2,79 | ||||
| 2026-02-12 | 13F | Commonwealth Equity Services, Llc | 142.877 | -19,10 | 2.497 | 124.750,00 | ||||
| 2026-02-17 | 13F | SageView Advisory Group, LLC | 1.811 | 32 | ||||||
| 2026-01-09 | 13F | Congress Asset Management Co /ma | 124.582 | -7,79 | 2.178 | -1,67 | ||||
| 2026-01-21 | 13F | Prime Capital Investment Advisors, LLC | 50.769 | -0,27 | 887 | 6,35 | ||||
| 2026-01-29 | 13F | Verdence Capital Advisors LLC | 15.187 | -2,87 | 265 | 5,16 | ||||
| 2025-11-17 | 13F | Avondale Wealth Management | 0 | -100,00 | 0 | |||||
| 2026-01-08 | 13F | Wealth Enhancement Advisory Services, Llc | 22.407 | 14,87 | 391 | 23,42 | ||||
| 2026-02-10 | 13F | Bank of New York Mellon Corp | 2.029.224 | 3,79 | 35.471 | 10,69 | ||||
| 2026-02-13 | 13F | American Century Companies Inc | 76.112 | 1,48 | 1.330 | 8,22 | ||||
| 2026-01-26 | 13F | Lightrock Netherlands B.V. | 271.434 | 9,70 | 4.745 | 37,47 | ||||
| 2026-02-13 | 13F | JustInvest LLC | 49.827 | 14,93 | 871 | 22,54 | ||||
| 2026-01-29 | 13F | High Probability Advisors, LLC | 16.645 | 0,00 | 291 | 6,62 | ||||
| 2026-02-06 | 13F | Covestor Ltd | 6.757 | -0,81 | 0 | |||||
| 2026-02-11 | 13F | Parallel Advisors, LLC | 4.698 | 217,22 | 82 | 241,67 | ||||
| 2026-02-12 | 13F | Cibc World Markets Corp | 15.927 | -44,45 | 278 | -45,17 | ||||
| 2026-02-02 | 13F | Strs Ohio | 525.200 | -24,96 | 9.180 | -19,97 | ||||
| 2026-02-14 | 13F | Rockefeller Capital Management L.P. | 997 | 46,40 | 17 | 54,55 | ||||
| 2025-11-03 | 13F | Foundations Investment Advisors, LLC | 0 | -100,00 | 0 | |||||
| 2026-02-13 | 13F | Pinnacle Wealth Planning Services, Inc. | 6.667 | 117 | ||||||
| 2026-02-17 | 13F | Cetera Investment Advisers | 234.954 | -6,01 | 4.107 | 0,24 | ||||
| 2026-02-17 | 13F | FIL Ltd | 5.482 | -27,91 | 96 | -23,39 | ||||
| 2026-01-30 | 13F | North Star Investment Management Corp. | 2.029 | 1,45 | 35 | 9,38 | ||||
| 2025-11-13 | 13F | Arkhouse Management Co. LP | 45.932 | 67,12 | 753 | 54,73 | ||||
| 2026-02-17 | 13F | Royal Bank Of Canada | 59.635 | -38,99 | 1.042 | -34,92 | ||||
| 2026-02-13 | 13F | Macquarie Group Ltd | 124.040 | -98,47 | 2.168 | -98,37 | ||||
| 2025-11-14 | 13F | Algert Global Llc | 0 | -100,00 | 0 | |||||
| 2026-02-17 | 13F | Advisor Group Holdings, Inc. | 323.593 | -18,17 | 5.658 | -20,22 | ||||
| 2026-01-30 | 13F | Caldwell Trust Co | 3.452 | 0,00 | 60 | 7,14 | ||||
| 2026-02-10 | 13F | Bnp Paribas Arbitrage, Sa | 83.978 | -10,86 | 1.468 | -4,99 | ||||
| 2026-02-13 | 13F | Police & Firemen's Retirement System of New Jersey | 64.572 | 0,32 | 1.129 | 7,02 | ||||
| 2026-02-17 | 13F | Conversant Capital LLC | 850.000 | 13,33 | 14.858 | 20,88 | ||||
| 2025-11-13 | 13F | GeoWealth Management, LLC | 0 | -100,00 | 0 | |||||
| 2026-02-12 | 13F | Xponance, Inc. | 29.284 | -11,78 | 512 | -6,07 | ||||
| 2026-02-05 | 13F | Center for Financial Planning, Inc. | 1.134 | 0,00 | 20 | 5,56 | ||||
| 2025-11-13 | 13F | Clear Street Markets Llc | 0 | -100,00 | 0 | -100,00 | ||||
| 2026-02-17 | 13F | Boothbay Fund Management, Llc | 10.882 | 190 | ||||||
| 2026-02-13 | 13F | Verition Fund Management LLC | 577.650 | 932,05 | 10.097 | 1.001,09 | ||||
| 2026-02-06 | 13F | Bare Financial Services, Inc | 30 | 1 | ||||||
| 2026-01-29 | 13F | UBS Group AG | Put | 44.300 | -81,76 | 774 | -80,56 | |||
| 2026-01-29 | 13F | UBS Group AG | 7.695.550 | 359,38 | 134.518 | 389,94 | ||||
| 2026-02-17 | 13F | Optiver Holding B.V. | 668 | -59,66 | 12 | -59,26 | ||||
| 2026-01-23 | 13F | Retirement Guys Formula Llc | 12.476 | 0,00 | 218 | 6,86 | ||||
| 2026-02-09 | 13F | Atlantic Trust, LLC | 5.098 | 13,11 | 89 | 21,92 | ||||
| 2026-02-10 | 13F | Connor, Clark & Lunn Investment Management Ltd. | 0 | -100,00 | 0 | |||||
| 2026-01-15 | 13F | Nisa Investment Advisors, Llc | 61.773 | -12,83 | 1.092 | -7,07 | ||||
| 2026-02-06 | 13F | Fortis Group Advisors, LLC | 2 | 0,00 | 0 | |||||
| 2026-02-23 | 13F | Mv Capital Management, Inc. | 3 | 0,00 | 0 | |||||
| 2025-11-12 | 13F | Bellwether Advisors, LLC | 0 | -100,00 | 0 | |||||
| 2026-01-26 | 13F | Paradigm Financial Partners, Llc | 28.648 | -9,31 | 501 | -3,29 | ||||
| 2026-01-26 | 13F | Taylor Frigon Capital Management LLC | 100.437 | 7,12 | 1.756 | 14,26 | ||||
| 2026-02-09 | 13F | Keating Financial Advisory Services, Inc. | 11 | 0 | ||||||
| 2026-01-22 | 13F | Financial Consulate, Inc | 29 | 1 | ||||||
| 2026-02-11 | 13F | RM Financial Services, LLC | 110.723 | 1.935 | ||||||
| 2026-02-10 | 13F | New Mexico Educational Retirement Board | 45.700 | 0,00 | 1 | |||||
| 2026-01-12 | 13F | Focus Financial Network, Inc. | 43.328 | -6,57 | 757 | -0,39 | ||||
| 2026-01-15 | 13F | Allspring Global Investments Holdings, LLC | 60.120 | 27,49 | 1.058 | 37,05 | ||||
| 2025-11-14 | 13F | Waterfront Capital Partners, LLC | 0 | -100,00 | 0 | -100,00 | ||||
| 2026-01-23 | 13F | Assetmark, Inc | 2.096 | -5,80 | 37 | 0,00 | ||||
| 2026-01-30 | 13F | Us Bancorp \de\ | 30.827 | 36,22 | 539 | 45,41 | ||||
| 2026-02-13 | 13F | Sofos Investments, Inc. | 0 | -100,00 | 0 | |||||
| 2026-02-11 | 13F | Los Angeles Capital Management Llc | 942 | 15 | ||||||
| 2026-02-13 | 13F | Quarry LP | 0 | -100,00 | 0 | |||||
| 2026-02-17 | 13F | Holocene Advisors, LP | 934.230 | 16.330 | ||||||
| 2026-02-09 | 13F | Quest Partners LLC | 2.546 | -66,55 | 45 | -64,52 | ||||
| 2026-02-02 | 13F | Fifth Third Bancorp | 2.703 | -13,67 | 47 | -7,84 | ||||
| 2026-02-13 | 13F | Healthcare Of Ontario Pension Plan Trust Fund | 0 | -100,00 | 0 | |||||
| 2026-03-04 | 13F | SHP Wealth Management | 1.698 | 30 | ||||||
| 2026-02-11 | 13F | Allianz Asset Management GmbH | 172.534 | 42,99 | 3.016 | 52,50 | ||||
| 2026-02-05 | 13F | Independent Solutions Wealth Management, LLC | 18.197 | 0,00 | 318 | 6,71 | ||||
| 2026-02-11 | 13F | Simplex Trading, Llc | Put | 0 | -100,00 | 0 | ||||
| 2026-01-07 | 13F | Massmutual Trust Co Fsb/adv | 1.398 | 3,63 | 24 | 9,09 | ||||
| 2025-11-25 | 13F | Briaud Financial Planning, Inc | 0 | -100,00 | 0 | |||||
| 2026-02-17 | 13F | Cardiff Park Advisors, Llc | 0 | -100,00 | 0 | |||||
| 2026-02-17 | 13F | Two Sigma Securities, Llc | 0 | -100,00 | 0 | |||||
| 2025-11-14 | 13F | Point72 Hong Kong Ltd | 2.400 | 26,92 | 39 | 18,18 | ||||
| 2026-02-25 | 13F | Westshore Wealth, LLC | 10.000 | 175 | ||||||
| 2026-02-12 | 13F | Brinker Capital Investments, LLC | 0 | -100,00 | 0 | |||||
| 2025-11-07 | 13F | Gsa Capital Partners Llp | 0 | -100,00 | 0 | |||||
| 2026-02-03 | 13F | McIlrath & Eck, LLC | 1.439 | 0,00 | 25 | 8,70 | ||||
| 2026-03-05 | 13F | Bayban | 750 | 13 | ||||||
| 2026-02-17 | 13F | Northern Trust Corp | 3.288.911 | -2,83 | 57.490 | 3,63 | ||||
| 2026-01-28 | 13F | HB Wealth Management, LLC | 13.234 | 21,51 | 231 | 29,78 | ||||
| 2026-02-13 | 13F | Transamerica Financial Advisors, Inc. | 5 | 0 | ||||||
| 2026-02-17 | 13F | Private Advisor Group, LLC | 0 | -100,00 | 0 | |||||
| 2026-01-20 | 13F | Signaturefd, Llc | 17.489 | 8,90 | 306 | 15,97 | ||||
| 2026-02-13 | 13F | Commerce Bank | 21.735 | -1,50 | 380 | 4,99 | ||||
| 2026-02-12 | 13F | BlackRock, Inc. | 35.782.163 | 3,01 | 625.472 | 9,86 | ||||
| 2026-02-17 | 13F | Aqr Capital Management Llc | 148.931 | 162,12 | 2.603 | 183,24 | ||||
| 2026-01-14 | 13F | Hunter Perkins Capital Management, LLC | 29.175 | 0,00 | 1 | |||||
| 2026-02-13 | 13F | Charles Schwab Investment Management Inc | 4.063.759 | 6,19 | 71.035 | 13,25 | ||||
| 2026-01-30 | 13F | State of New Jersey Common Pension Fund D | 345.981 | 2,33 | 6.048 | 9,13 | ||||
| 2026-02-10 | 13F | Envestnet Asset Management Inc | 78.141 | -56,91 | 1.366 | -54,07 | ||||
| 2026-02-17 | 13F | Aster Capital Management (DIFC) Ltd | 0 | -100,00 | 0 | |||||
| 2026-01-26 | 13F | Keystone Wealth Services, LLC | 30.166 | 0,00 | 527 | 6,68 | ||||
| 2025-11-13 | 13F | Riggs Asset Managment Co. Inc. | 0 | -100,00 | 0 | |||||
| 2026-02-04 | 13F | Pensionmark Financial Group, Llc | 41.894 | 732 | ||||||
| 2026-02-04 | 13F | Dynamic Wealth Strategies, LLC | 2.685 | 0,00 | 47 | 4,55 | ||||
| 2026-02-10 | 13F | Basepoint Wealth LLC | 5.000 | 87 | ||||||
| 2026-01-29 | 13F | Pictet Asset Management Holding SA | 35.491 | 0,00 | 620 | 6,71 | ||||
| 2026-01-21 | 13F | Sound Income Strategies, LLC | 4.873 | 13,46 | 84 | 21,74 | ||||
| 2025-11-14 | 13F | Point72 (DIFC) Ltd | 10.017 | 164 | ||||||
| 2026-02-04 | 13F | Atlantic Union Bankshares Corp | 57.932 | -1,75 | 1.013 | 4,76 | ||||
| 2026-02-02 | 13F | Danske Bank A/s | 1.600 | 0,00 | 28 | 3,85 | ||||
| 2026-02-13 | 13F | Citigroup Inc | 246.185 | 66,00 | 4.303 | 77,08 | ||||
| 2026-02-06 | 13F | IFP Advisors, Inc | 6.879 | -0,19 | 120 | 7,14 | ||||
| 2026-02-17 | 13F | United Capital Financial Advisers, Llc | 13.487 | 236 | ||||||
| 2026-02-13 | 13F | Edgestream Partners, L.P. | 182.706 | 3.194 | ||||||
| 2025-11-14 | 13F | Aigen Investment Management, Lp | 0 | -100,00 | 0 | |||||
| 2026-02-17 | 13F | Susquehanna International Group, Llp | 130.064 | 2.274 | ||||||
| 2026-02-17 | 13F | Nissay Asset Management Corp /japan/ /adv | 35.920 | 3,97 | 628 | 10,78 | ||||
| 2026-02-17 | 13F | Crawford Investment Counsel Inc | 0 | -100,00 | 0 | |||||
| 2026-02-06 | 13F | Resona Asset Management Co.,Ltd. | 100.352 | -2,49 | 1.767 | 4,93 | ||||
| 2026-02-18 | 13F | Vident Advisory, LLC | 35.933 | -9,10 | 628 | -2,94 | ||||
| 2026-02-12 | 13F | Ci Investments Inc. | 0 | -100,00 | 0 | |||||
| 2026-02-03 | 13F | International Assets Investment Management, Llc | 8.104 | 142 | ||||||
| 2025-11-14 | 13F | Bridgefront Capital, LLC | 0 | -100,00 | 0 | -100,00 | ||||
| 2026-02-12 | 13F | Centersquare Investment Management Llc | 0 | -100,00 | 0 | |||||
| 2026-02-11 | 13F | Commonwealth Retirement Investments LLC | 825 | 14 | ||||||
| 2026-02-12 | 13F | UniSuper Management Pty Ltd | 49.600 | -22,98 | 867 | -17,82 | ||||
| 2025-10-10 | 13F | CHICAGO TRUST Co NA | 0 | -100,00 | 0 | |||||
| 2026-02-02 | 13F | Oppenheimer & Co Inc | 19.379 | 0,00 | 339 | 6,62 | ||||
| 2026-02-13 | 13F | Barclays Plc | 524.875 | 31,10 | 9.175 | 11,78 | ||||
| 2026-01-08 | 13F | Versant Capital Management, Inc | 1.980 | 25,63 | 35 | 36,00 | ||||
| 2026-01-08 | 13F | Fulton Bank, N.a. | 16.811 | -5,72 | 294 | 0,34 | ||||
| 2026-02-12 | 13F | New York State Common Retirement Fund | 125.368 | -0,29 | 2.191 | 6,36 | ||||
| 2026-02-17 | 13F | Jones Financial Companies Lllp | 4.868 | 84,05 | 85 | 97,67 | ||||
| 2026-01-26 | 13F | Mirae Asset Global Investments Co., Ltd. | 6.834 | 33,42 | 119 | 43,37 | ||||
| 2026-02-13 | 13F | Ausdal Financial Partners, Inc. | 41.702 | -2,33 | 729 | 4,15 | ||||
| 2026-02-05 | 13F | Cambridge Investment Research Advisors, Inc. | 460.725 | -2,27 | 8 | 14,29 | ||||
| 2026-02-11 | 13F | SOUTH STATE Corp | 0 | -100,00 | 0 | |||||
| 2026-02-13 | 13F | Sterling Capital Management LLC | 13.991 | -14,17 | 245 | -8,61 | ||||
| 2026-01-26 | 13F | AE Wealth Management LLC | 15.338 | -1,02 | 268 | 5,93 | ||||
| 2025-11-03 | 13F | Knights of Columbus Asset Advisors LLC | 0 | -100,00 | 0 | |||||
| 2026-02-02 | 13F | Sachetta, LLC | 61 | -67,55 | 1 | -66,67 | ||||
| 2026-01-26 | 13F | PFG Investments, LLC | 22.839 | -15,71 | 399 | -10,14 | ||||
| 2025-11-13 | 13F | LaSalle St. Investment Advisors, LLC | 0 | -100,00 | 0 | |||||
| 2026-02-13 | 13F | Vivaldi Capital Management, LLC | 16.182 | 0,14 | 283 | 6,82 | ||||
| 2026-02-11 | 13F | Hughes Financial Services, LLC | 3 | 0 | ||||||
| 2026-02-09 | 13F | Texas Capital Bank Wealth Management Services Inc | 44.372 | 776 | ||||||
| 2026-01-28 | 13F | Kingswood Wealth Advisors, Llc | 11.062 | 193 | ||||||
| 2026-01-22 | 13F | Massachusetts Financial Services Co /ma/ | 3.756.821 | 1,21 | 65.669 | 7,95 | ||||
| 2026-02-12 | 13F | Principal Securities, Inc. | 0 | -100,00 | 0 | -100,00 | ||||
| 2026-02-13 | 13F | Cramer Rosenthal Mcglynn Llc | 378.113 | -3,84 | 6.609 | 2,56 | ||||
| 2026-01-14 | 13F | Aventus Investment Advisors, Inc. | 0 | -100,00 | 0 | |||||
| 2026-01-26 | 13F/A | Phocas Financial Corp. | 360.359 | -0,30 | 6.299 | 6,35 | ||||
| 2026-02-20 | 13F | Sunbelt Securities, Inc. | 1.925 | -54,92 | 34 | -52,17 | ||||
| 2026-02-03 | 13F | Koshinski Asset Management, Inc. | 12.132 | -70,35 | 212 | -68,36 | ||||
| 2025-11-14 | 13F | SummitTX Capital, L.P. | 0 | -100,00 | 0 | |||||
| 2026-02-12 | 13F | Wealthspire Advisors, LLC | 0 | -100,00 | 0 | |||||
| 2026-02-17 | 13F | Balyasny Asset Management Llc | 0 | -100,00 | 0 | |||||
| 2026-02-17 | 13F | Blair William & Co/il | 639.008 | -5,37 | 11.170 | 0,92 | ||||
| 2026-01-08 | 13F | Grove Bank & Trust | 283.843 | 0,00 | 4.962 | 6,64 | ||||
| 2026-02-03 | 13F | NewEdge Wealth, LLC | 10.376 | 3,76 | 181 | 11,73 | ||||
| 2026-02-17 | 13F | Canada Pension Plan Investment Board | 17.400 | 304 | ||||||
| 2026-02-13 | 13F | Mill Creek Capital Advisors, LLC | 252.497 | 0,00 | 4.414 | 6,65 | ||||
| 2026-02-04 | 13F | Oregon Public Employees Retirement Fund | 47.363 | 0,85 | 828 | 7,54 | ||||
| 2026-02-03 | 13F | Sequoia Financial Advisors, LLC | 15.775 | 2,90 | 276 | 9,56 | ||||
| 2026-01-26 | 13F | Slocum, Gordon & Co LLP | 98.660 | -7,00 | 1.725 | -0,81 | ||||
| 2026-02-17 | 13F | Gallagher Fiduciary Advisors, LLC | 53.792 | 19,65 | 940 | 27,72 | ||||
| 2026-01-12 | 13F | Pensionfund DSM Netherlands | 44.500 | 0,00 | 1 | |||||
| 2026-02-10 | 13F | Nomura Asset Management Co Ltd | 367.343 | 5,36 | 6.421 | 12,37 | ||||
| 2026-02-13 | 13F | Ubs Asset Management Americas Inc | 1.061 | -99,92 | 19 | -99,92 | ||||
| 2026-02-17 | 13F | Wellington Management Group Llp | 2.482.685 | -59,27 | 43.397 | -56,56 | ||||
| 2026-02-03 | 13F | Farmers & Merchants Investments Inc | 203 | 0,00 | 4 | 0,00 | ||||
| 2026-02-12 | 13F | Skopos Labs, Inc. | 15.471 | 273 | ||||||
| 2026-02-10 | 13F | Natixis Advisors, L.p. | 12.369 | -83,41 | 0 | -100,00 | ||||
| 2026-02-13 | 13F | Victory Capital Management Inc | 495.017 | -22,73 | 8.653 | -17,59 | ||||
| 2025-11-04 | 13F | State of Wyoming | 0 | -100,00 | 0 | |||||
| 2026-02-17 | 13F | State Of Wisconsin Investment Board | 465.811 | 2,64 | 8.142 | 9,46 | ||||
| 2026-01-16 | 13F | Trust Co Of Vermont | 293 | 0,00 | 5 | 25,00 | ||||
| 2026-01-20 | 13F | Ascent Group, LLC | 15.462 | 0,00 | 270 | 6,72 | ||||
| 2026-02-17 | 13F | Freestone Grove Partners LP | 0 | -100,00 | 0 | |||||
| 2026-02-09 | 13F | Legal & General Group Plc | 1.427.502 | 9,93 | 24.953 | 17,24 | ||||
| 2026-02-13 | 13F | Pathstone Holdings, LLC | 80.646 | 9,80 | 1.410 | 17,11 | ||||
| 2026-02-10 | 13F | Td Asset Management Inc | 126.086 | -25,42 | 2.204 | -20,50 | ||||
| 2026-01-13 | 13F | Mather Group, Llc. | 0 | -100,00 | 0 | -100,00 | ||||
| 2026-02-24 | 13F/A | Pacer Advisors, Inc. | 28.489 | -45,49 | 498 | -41,94 | ||||
| 2026-02-17 | 13F | Bank Of America Corp /de/ | 2.604.411 | 15,54 | 45.525 | 23,23 | ||||
| 2025-11-04 | 13F | TFB Advisors LLC | 0 | -100,00 | 0 | |||||
| 2026-02-10 | 13F/A | Northwestern Mutual Wealth Management Co | 7.569 | -34,29 | 132 | -29,79 | ||||
| 2026-02-11 | 13F | Janney Montgomery Scott LLC | 0 | -100,00 | 0 | |||||
| 2026-02-10 | 13F | Mutual Of America Capital Management Llc | 99.352 | -7,84 | 1.737 | -1,70 | ||||
| 2026-01-21 | 13F | Yousif Capital Management, Llc | 73.834 | 0,28 | 1.241 | 2,90 | ||||
| 2026-02-13 | 13F | Fieldview Capital Management, LLC | 0 | -100,00 | 0 | |||||
| 2026-02-17 | 13F | Warren Averett Asset Management, LLC | 11.095 | 5,79 | 194 | 12,87 | ||||
| 2026-02-17 | 13F | Schonfeld Strategic Advisors LLC | 138.632 | -88,03 | 2.423 | -87,23 | ||||
| 2025-10-07 | 13F | Proathlete Wealth Management Llc | 0 | -100,00 | 0 | |||||
| 2026-01-05 | 13F | GAMMA Investing LLC | 4.200 | 157,04 | 73 | 180,77 | ||||
| 2026-02-13 | 13F | Morgan Stanley | 5.649.829 | 209,53 | 98.759 | 230,12 | ||||
| 2026-02-09 | 13F | MQS Management LLC | 0 | -100,00 | 0 | |||||
| 2026-02-11 | 13F | Simplex Trading, Llc | Call | 300 | -76,92 | 5 | ||||
| 2025-11-13 | 13F | Advisor Resource Council | 0 | -100,00 | 0 | |||||
| 2025-11-17 | 13F | American Trust | 0 | -100,00 | 0 | |||||
| 2026-01-29 | 13F | Dunhill Financial, LLC | 12 | 0 | ||||||
| 2026-02-06 | 13F | CFO4Life Group, LLC | 19.625 | 0,79 | 343 | 7,52 | ||||
| 2026-02-17 | 13F | Public Employees Retirement System Of Ohio | 328.152 | -1,08 | 5.736 | 5,52 | ||||
| 2025-10-10 | 13F | Fluent Financial, LLC | 0 | -100,00 | 0 | |||||
| 2025-11-12 | 13F | Elo Mutual Pension Insurance Co | 0 | -100,00 | 0 | |||||
| 2026-02-19 | 13F | TMB Capital Partners, LLC | 86.123 | 1.505 | ||||||
| 2025-11-14 | 13F | Cubist Systematic Strategies, LLC | 168.457 | 23,36 | 2.761 | 14,33 | ||||
| 2026-01-16 | 13F | Louisiana State Employees Retirement System | 66.100 | 1,69 | 1.155 | 8,45 | ||||
| 2026-01-21 | 13F | Blue Zone Wealth Advisors, LLC | 299.811 | 1,21 | 5.241 | 7,93 | ||||
| 2026-02-12 | 13F | Voya Investment Management Llc | 41.196 | 0,00 | 720 | 6,67 | ||||
| 2026-02-11 | 13F | GW&K Investment Management, LLC | 1.308.087 | 23 | ||||||
| 2026-01-28 | 13F | DekaBank Deutsche Girozentrale | 53.729 | 0,00 | 1 | |||||
| 2026-02-06 | 13F | HighTower Advisors, LLC | 32.377 | -11,09 | 566 | -5,20 | ||||
| 2025-11-06 | 13F | Versor Investments LP | 0 | -100,00 | 0 | |||||
| 2026-02-13 | 13F | Solstein Capital, LLC | 1.500 | 0,00 | 26 | 8,33 | ||||
| 2026-02-17 | 13F | Russell Investments Group, Ltd. | 206.750 | 2,32 | 3.616 | 9,21 | ||||
| 2026-02-06 | 13F | Copia Wealth Management | 520 | 0,00 | 9 | 12,50 | ||||
| 2026-02-09 | 13F | Harbour Investments, Inc. | 29.231 | -5,60 | 511 | 0,59 | ||||
| 2026-02-05 | 13F | Thrivent Financial For Lutherans | 172.368 | -12,08 | 3 | 0,00 | ||||
| 2026-02-17 | 13F | Voloridge Investment Management, Llc | 375.331 | 415,99 | 6.561 | 450,34 | ||||
| 2026-02-14 | 13F | Pointe Capital Management LLC | 29.565 | 0,00 | 517 | 6,61 | ||||
| 2026-01-13 | 13F | CoreCap Advisors, LLC | 897 | 1,13 | 16 | 7,14 | ||||
| 2026-02-17 | 13F | CWM Advisors, LLC | 26.853 | -3,29 | 469 | 3,08 | ||||
| 2026-02-12 | 13F | JPL Wealth Management, LLC | 0 | -100,00 | 0 | |||||
| 2025-11-12 | 13F | Ironsides Asset Advisors, LLC | 0 | -100,00 | 0 | |||||
| 2026-02-11 | 13F | Franklin Resources Inc | 3.874.647 | 1,23 | 67.729 | 7,96 | ||||
| 2026-01-16 | 13F | Standard Life Aberdeen plc | 86.103 | 11,07 | 1.505 | 18,78 | ||||
| 2026-02-13 | 13F | Long Pond Capital, LP | 0 | -100,00 | 0 | |||||
| 2025-11-14 | 13F | Texas Permanent School Fund | 0 | -100,00 | 0 | |||||
| 2026-02-12 | 13F | Brown Brothers Harriman & Co | 436 | 282,46 | 8 | 600,00 | ||||
| 2026-02-13 | 13F | Prudential Financial Inc | 6.671.874 | 53,13 | 116.624 | 63,31 | ||||
| 2026-02-12 | 13F | Triumph Capital Management | 9.242 | 0,00 | 162 | 6,62 | ||||
| 2026-02-13 | 13F | BNP Paribas Asset Management Holding S.A. | 8.033 | 9,61 | 0 | |||||
| 2026-02-12 | 13F | Bank Of Montreal /can/ | 31.800 | -2,87 | 556 | 3,54 | ||||
| 2026-02-06 | 13F | Pnc Financial Services Group, Inc. | 13.807 | -1,47 | 241 | 5,24 | ||||
| 2026-02-13 | 13F | Arkadios Wealth Advisors | 25.828 | 102,80 | 451 | 116,83 | ||||
| 2026-02-04 | 13F | Ameritas Advisory Services, LLC | 0 | -100,00 | 0 | |||||
| 2025-11-14 | 13F | Graham Capital Management, L.P. | 0 | -100,00 | 0 | |||||
| 2026-02-12 | 13F | Federation des caisses Desjardins du Quebec | 112.246 | -4,71 | 1.962 | 1,66 | ||||
| 2026-02-06 | 13F | Csenge Advisory Group | 12.913 | -7,20 | 226 | -1,32 | ||||
| 2026-02-12 | 13F | MetLife Investment Management, LLC | 1.009.165 | -0,99 | 17.640 | 5,60 | ||||
| 2026-02-13 | 13F | Mml Investors Services, Llc | 10.316 | -8,25 | 180 | -2,17 | ||||
| 2026-02-05 | 13F | Bessemer Group Inc | 682 | -12,11 | 0 | |||||
| 2026-02-12 | 13F | Swiss National Bank | 461.100 | 1,72 | 8.060 | 8,49 | ||||
| 2026-02-13 | 13F | Baird Financial Group, Inc. | 17.911 | 22,65 | 313 | 30,96 | ||||
| 2026-02-17 | 13F | Advisory Services Network, LLC | 0 | -100,00 | 0 | |||||
| 2026-02-06 | 13F | Aew Capital Management L P | 271.575 | -55,03 | 4.747 | -52,05 | ||||
| 2026-02-11 | 13F | Ameritas Investment Partners, Inc. | 67.924 | 1.187 | ||||||
| 2026-02-17 | 13F | California State Teachers Retirement System | 220.065 | -1,38 | 3.847 | 5,17 | ||||
| 2026-02-11 | 13F | Rise Advisors, LLC | 0 | -100,00 | 0 | |||||
| 2026-02-05 | 13F | High Note Wealth, LLC | 264 | 5 | ||||||
| 2026-02-05 | 13F | Amalgamated Bank | 100.588 | -2,05 | 2 | 0,00 | ||||
| 2026-02-13 | 13F | Wells Fargo & Company/mn | 418.827 | 26,74 | 7.321 | 35,17 | ||||
| 2026-03-19 | 13F | Painted Porch Advisors LLC | 0 | -100,00 | 0 | |||||
| 2026-01-28 | 13F | Oversea-Chinese Banking CORP Ltd | 312.203 | 22,93 | 5.457 | 31,11 | ||||
| 2026-01-22 | 13F | Carlton Hofferkamp & Jenks Wealth Management, LLC | 26.222 | 0,00 | 458 | 8,27 | ||||
| 2025-10-30 | 13F | Twin Peaks Wealth Advisors, LLC | 0 | -100,00 | 0 | |||||
| 2026-01-27 | 13F | Zurcher Kantonalbank (Zurich Cantonalbank) | 163.006 | 3,95 | 2.849 | 10,86 | ||||
| 2026-02-13 | 13F | Van Eck Associates Corp | 64.326 | 12,32 | 1 | |||||
| 2026-02-10 | 13F | Godfrey Financial Associates, Inc. | 6 | 0 | ||||||
| 2025-11-14 | 13F | Point72 Europe (London) LLP | 2.452 | 40 | ||||||
| 2026-01-29 | 13F | Vanguard Group Inc | 33.235.002 | 0,76 | 580.948 | 7,46 | ||||
| 2026-02-11 | 13F | Jpmorgan Chase & Co | 2.150.829 | 2,12 | 37.596 | 8,91 | ||||
| 2026-02-05 | 13F | Atria Investments Llc | 58.732 | 20,19 | 1.027 | 28,25 | ||||
| 2026-02-11 | 13F | Nemes Rush Group LLC | 2.609 | 1,08 | 46 | 7,14 | ||||
| 2026-02-13 | 13F | Bard Associates Inc | 27.496 | -62,16 | 485 | -59,68 | ||||
| 2026-02-13 | 13F | State Street Corp | 13.074.813 | 0,59 | 230.705 | 7,21 | ||||
| 2026-01-14 | 13F | Spire Wealth Management | 33 | 0,00 | 1 | |||||
| 2026-02-10 | 13F | Commonwealth Of Pennsylvania Public School Empls Retrmt Sys | 137.629 | 0,97 | 2.406 | 7,65 | ||||
| 2026-02-13 | 13F | Integrated Wealth Concepts LLC | 23.336 | 24,66 | 408 | 33,01 | ||||
| 2026-02-06 | 13F | Envestnet Portfolio Solutions, Inc. | 0 | -100,00 | 0 | |||||
| 2026-02-17 | 13F | Captrust Financial Advisors | 14.245 | -16,02 | 249 | -10,43 | ||||
| 2026-02-17 | 13F | Virtus Investment Advisers, Inc. | 9.426 | 165 | ||||||
| 2026-02-17 | 13F | Kemnay Advisory Services Inc. | 567 | 10 | ||||||
| 2026-01-26 | 13F | Heritage Wealth Architects, Inc. | 14.052 | -7,73 | 237 | -5,22 | ||||
| 2026-02-17 | 13F | Magnetar Financial LLC | 0 | -100,00 | 0 | |||||
| 2026-02-13 | 13F | Alberta Investment Management Corp | 85.700 | 1.498 |
Other Listings
| DE:5O2 | 12,70 € |