Grundlæggende statistik
| Institutionelle ejere | 188 total, 188 long only, 0 short only, 0 long/short - change of 12,50% MRQ |
| Gennemsnitlig porteføljeallokering | 0.4909 % - change of -4,69% MRQ |
| Institutionelle aktier (lange) | 25.957.432 (ex 13D/G) - change of 4,28MM shares 19,75% MRQ |
| Institutionel værdi (lang) | $ 1.014.617 USD ($1000) |
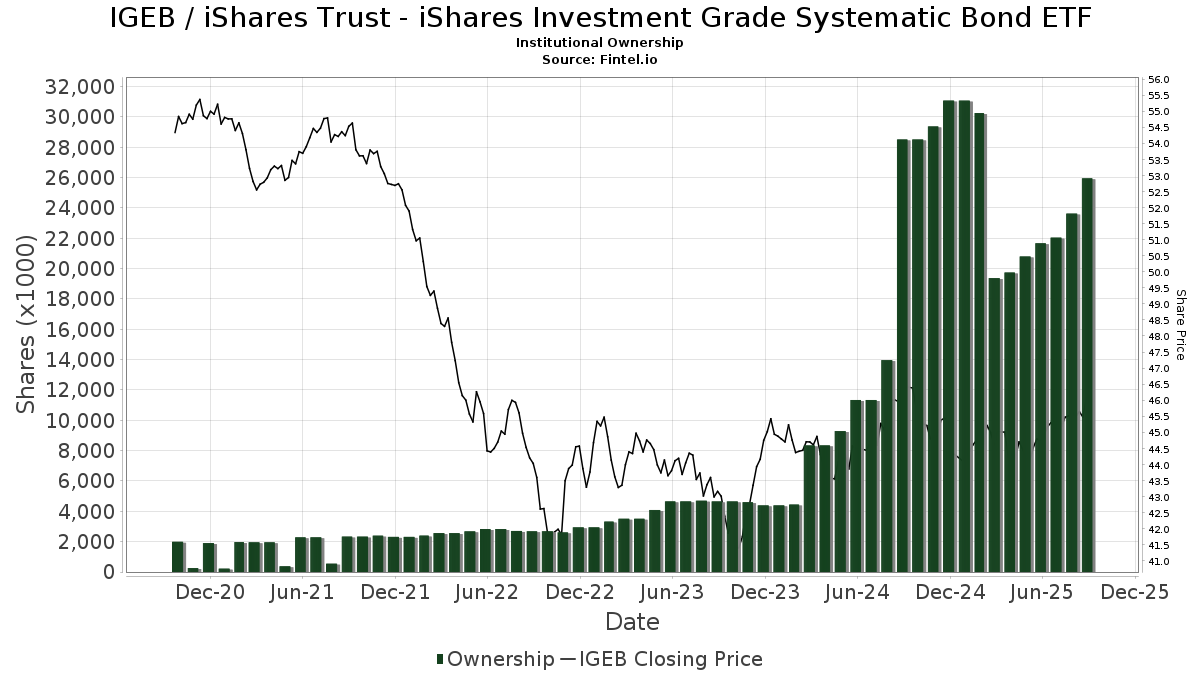
Institutionelt ejerskab og aktionærer
iShares Trust - iShares Investment Grade Systematic Bond ETF (US:IGEB) har 188 institutionelle ejere og aktionærer, der har indsendt 13D/G- eller 13F-formularer til Securities Exchange Commission (SEC). Disse institutioner har i alt 25,957,432 aktier. Største aktionærer omfatter Envestnet Asset Management Inc, LPL Financial LLC, State of New Jersey Common Pension Fund D, Bank Of America Corp /de/, Ameriprise Financial Inc, Fundamentun, Llc, Hennion & Walsh Asset Management, Inc., Cwm, Llc, Mml Investors Services, Llc, and Resources Investment Advisors, LLC. .
iShares Trust - iShares Investment Grade Systematic Bond ETF (BATS:IGEB) institutionel ejerskabsstruktur viser aktuelle positioner i virksomheden efter institutioner og fonde, samt seneste ændringer i positionsstørrelse. Større aktionærer kan omfatte individuelle investorer, investeringsforeninger, hedgefonde eller institutioner. Skema 13D angiver, at investoren besidder (eller besidder) mere end 5 % af virksomheden og har til hensigt (eller har til hensigt at) aktivt at forfølge en ændring i forretningsstrategi. Skema 13G indikerer en passiv investering på over 5%.
The share price as of September 15, 2025 is 46,28 / share. Previously, on September 16, 2024, the share price was 46,61 / share. This represents a decline of 0,71% over that period.
Fondens stemningsscore
Fund Sentiment Score (fka Ownership Accumulation Score) finder de aktier, der bliver mest købt af fonde. Det er resultatet af en sofistikeret, multi-faktor kvantitativ model, der identificerer virksomheder med de højeste niveauer af institutionel akkumulering. Scoringsmodellen bruger en kombination af den samlede stigning i oplyste ejere, ændringerne i porteføljeallokeringer i disse ejere og andre målinger. Tallet går fra 0 til 100, hvor højere tal indikerer et højere niveau af akkumulering for sine jævnaldrende, og 50 er gennemsnittet.
Opdateringsfrekvens: Dagligt
Se Ownership Explorer, som giver en liste over højest rangerende virksomheder.
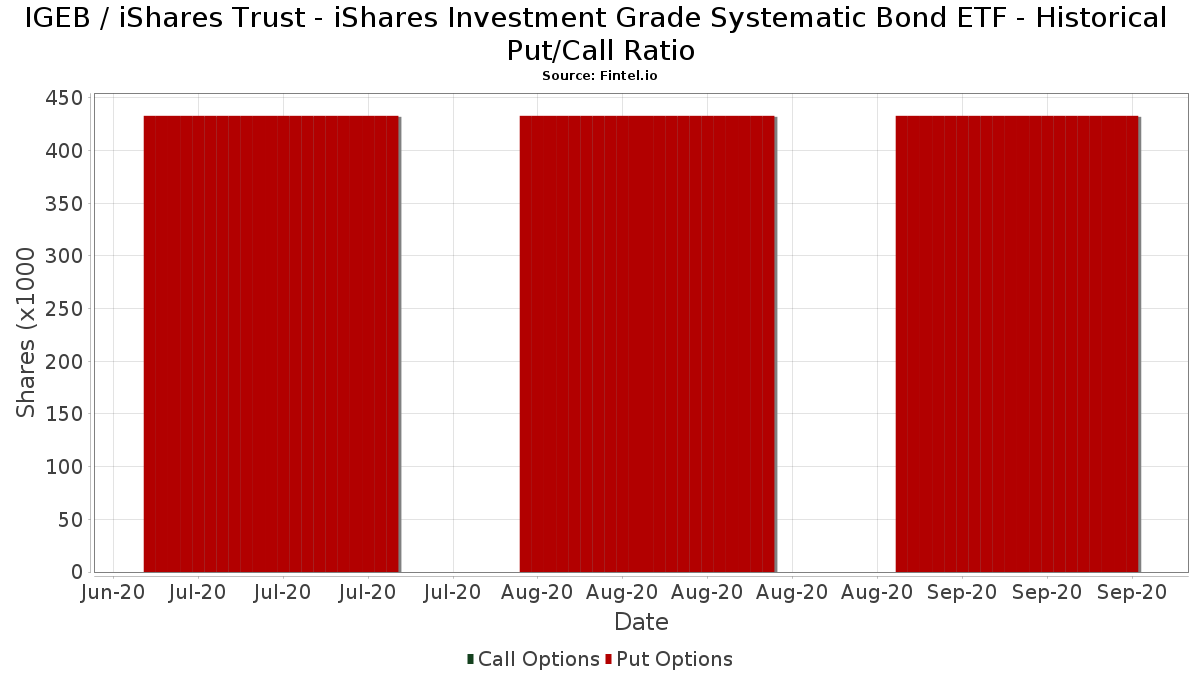
Institutionel Put/Call-forhold
Ud over at indberette standardaktie- og gældsudstedelser skal institutter med mere end 100 mill. aktiver under forvaltning også oplyse deres put- og call-optionsbeholdninger. Da salgsoptioner generelt indikerer negativ stemning, og købsoptioner indikerer positiv stemning, kan vi få en fornemmelse af den overordnede institutionelle stemning ved at plotte forholdet mellem put og kald. Diagrammet til højre viser det historiske put/call-forhold for dette instrument.
Brug af Put/Call Ratio som en indikator for investorernes stemning overvinder en af de vigtigste mangler ved at bruge totalt institutionelt ejerskab, som er, at en betydelig mængde af aktiver under forvaltning investeres passivt for at spore indekser. Passivt forvaltede fonde køber typisk ikke optioner, så indikatoren for put/call-forholdet følger mere nøje følelsen af aktivt forvaltede fonde.
13F og NPORT arkivering
Detaljer om 13F-arkivering er gratis. Detaljer om NP-ansøgninger kræver et premium-medlemskab. Grønne rækker angiver nye positioner. Røde rækker angiver lukkede positioner. Klik på linket ikon for at se den fulde transaktionshistorik.
Opgrader
for at låse premium-data op og eksportere til Excel ![]() .
.
| Fil dato | Kilde | Investor | Type | Gennemsnitlig pris (Øst) |
Aktier | Δ Aktier (%) |
Rapporteret Værdi ($1000) |
Δ Værdi (%) |
Port Alloc (%) |
|
|---|---|---|---|---|---|---|---|---|---|---|
| 2025-05-12 | 13F | CFS Investment Advisory Services, LLC | 0 | -100,00 | 0 | |||||
| 2025-05-14 | 13F | Oarsman Capital, Inc. | 0 | -100,00 | 0 | |||||
| 2025-07-09 | 13F | Breakwater Capital Group | 94.737 | 8,87 | 4.305 | 9,91 | ||||
| 2025-07-18 | 13F | SigFig Wealth Management, LLC | 5.494 | 249 | ||||||
| 2025-07-28 | 13F | Axxcess Wealth Management, Llc | 10.687 | -11,04 | 486 | -10,19 | ||||
| 2025-08-06 | 13F | North Capital, Inc. | 102 | 0,99 | 5 | 0,00 | ||||
| 2025-07-09 | 13F | Fermata Advisors, LLC | 44.117 | 13,38 | 2.005 | 14,45 | ||||
| 2025-06-26 | NP | FCBD - Frontier Asset Core Bond ETF | 49.966 | -23,85 | 2.233 | -23,66 | ||||
| 2025-07-17 | 13F | Altus Wealth Management, LLC | 43.389 | -1,16 | 1.972 | -0,20 | ||||
| 2025-07-08 | 13F | Parallel Advisors, LLC | 47.549 | -28,89 | 2.161 | -28,22 | ||||
| 2025-08-14 | 13F | Diversify Advisory Services, LLC | 4.967 | 226 | ||||||
| 2025-08-14 | 13F | Susquehanna International Group, Llp | 66.480 | 1.035,83 | 3.021 | 1.048,29 | ||||
| 2025-08-11 | 13F | Copperleaf Capital, LLC | 0 | -100,00 | 0 | |||||
| 2025-07-29 | 13F | Two West Capital Advisors LLC | 22.899 | 13,92 | 1.036 | 18,13 | ||||
| 2025-07-25 | 13F | Cwm, Llc | 783.778 | -1,25 | 36 | 0,00 | ||||
| 2025-04-28 | 13F | Fedenia Advisers LLC | 0 | -100,00 | 0 | |||||
| 2025-08-15 | 13F | Morgan Stanley | 556.092 | 47,41 | 25.269 | 48,81 | ||||
| 2025-08-15 | 13F | High Falls Advisors, Inc | 9.806 | 446 | ||||||
| 2025-05-07 | 13F | Spectrum Wealth Counsel, LLC | 7.255 | 25,71 | 327 | 27,34 | ||||
| 2025-08-12 | 13F | BlackRock, Inc. | 596.006 | 3,66 | 27.083 | 4,64 | ||||
| 2025-08-13 | 13F | Flow Traders U.s. Llc | 0 | -100,00 | 0 | |||||
| 2025-08-14 | 13F | Ancora Advisors, LLC | 52 | -23,53 | 2 | -33,33 | ||||
| 2025-08-19 | 13F | Advisory Services Network, LLC | 53.467 | -0,62 | 2.421 | -0,04 | ||||
| 2025-07-21 | 13F | Ascent Group, LLC | 46.813 | 2,26 | 2.127 | 3,25 | ||||
| 2025-07-31 | 13F | State of New Jersey Common Pension Fund D | 1.621.932 | 0,00 | 73.701 | 0,95 | ||||
| 2025-07-16 | 13F | ORG Partners LLC | 72.939 | 5,73 | 3.314 | 6,94 | ||||
| 2025-08-11 | 13F | United Capital Financial Advisers, Llc | 331.206 | 8,31 | 15.050 | 9,34 | ||||
| 2025-08-06 | 13F | Centerpoint Advisory Group | 15.397 | -2,87 | 700 | -1,96 | ||||
| 2025-07-25 | 13F | Sequoia Financial Advisors, LLC | 4.447 | 202 | ||||||
| 2025-08-05 | 13F | GPS Wealth Strategies Group, LLC | 300 | 0,00 | 14 | 0,00 | ||||
| 2025-08-26 | NP | EVTTX - The E-Valuator Conservative/Moderate (30%-50%) RMS Fund Service Class Shares | 15.812 | 9,40 | 718 | 10,46 | ||||
| 2025-06-26 | NP | FOPC - Frontier Asset Opportunistic Credit ETF | 125.662 | -2,11 | 5.617 | -1,85 | ||||
| 2025-08-05 | 13F | Key FInancial Inc | 75 | 3 | ||||||
| 2025-07-24 | 13F | JB Capital LLC | 32.960 | 1.498 | ||||||
| 2025-08-06 | 13F | AE Wealth Management LLC | 1.042 | 9,45 | 47 | 11,90 | ||||
| 2025-08-26 | NP | EVAGX - The E-Valuator Aggressive Growth (85%-99%) RMS Fund Service Class Shares | 4.794 | -72,72 | 218 | -72,53 | ||||
| 2025-07-29 | 13F | Hoese & Co LLP | 59.519 | 6,90 | 2.704 | 7,90 | ||||
| 2025-08-26 | NP | EVMLX - The E-Valuator Moderate (50%-70%) RMS Fund Service Class Shares | 35.776 | -27,66 | 1.626 | -27,00 | ||||
| 2025-08-26 | NP | EVGLX - The E-Valuator Growth (70%-85%) RMS Fund Service Class Shares | 37.151 | 7,74 | 1.688 | 8,83 | ||||
| 2025-08-14 | 13F | Wells Fargo & Company/mn | 9.250 | 3.004,03 | 420 | 3.130,77 | ||||
| 2025-08-13 | 13F | Argyle Capital Partners, LLC | 9.233 | 0,00 | 420 | 0,96 | ||||
| 2025-08-14 | 13F | Mml Investors Services, Llc | 746.919 | 31,61 | 34 | 32,00 | ||||
| 2025-07-29 | 13F | Riverbend Wealth Management, LLC | 6.587 | 299 | ||||||
| 2025-04-24 | 13F | Kraft, Davis & Associates, LLC | 0 | -100,00 | 0 | |||||
| 2025-08-07 | 13F | Hennion & Walsh Asset Management, Inc. | 794.619 | -29,75 | 36.107 | -29,07 | ||||
| 2025-07-25 | 13F | Investment Advisory Group, LLC | 7.644 | 0,00 | 347 | 0,87 | ||||
| 2025-08-05 | 13F | Scarborough Advisors, LLC | 571 | 26 | ||||||
| 2025-08-14 | 13F | Mariner, LLC | 5.378 | -1,61 | 244 | -0,81 | ||||
| 2025-07-25 | 13F | Envestnet Portfolio Solutions, Inc. | 165.106 | 245,89 | 7.502 | 249,26 | ||||
| 2025-08-14 | 13F | Guardian Wealth Advisors, Llc / Nc | 188 | 0,00 | 9 | 0,00 | ||||
| 2025-07-31 | 13F | Glass Jacobson Investment Advisors llc | 0 | -100,00 | 0 | |||||
| 2025-08-06 | 13F | Commonwealth Equity Services, Llc | 236.912 | 11 | ||||||
| 2025-08-12 | 13F | Steward Partners Investment Advisory, Llc | 60.272 | 19,37 | 2.739 | 20,51 | ||||
| 2025-08-07 | 13F | Shared Vision Wealth Group LLC | 54.119 | 53,47 | 2.450 | 54,38 | ||||
| 2025-08-14 | 13F | Jane Street Group, Llc | 35.406 | -77,23 | 1.609 | -77,03 | ||||
| 2025-09-04 | 13F/A | Advisor Group Holdings, Inc. | 86.348 | 44,21 | 3.924 | 45,55 | ||||
| 2025-07-24 | 13F | MA Private Wealth | 26.874 | 26,60 | 1.221 | 27,85 | ||||
| 2025-07-10 | 13F | Exchange Traded Concepts, Llc | 170.504 | -7,83 | 7.748 | -6,95 | ||||
| 2025-08-04 | 13F | Wealth Management Associates, Inc. | 24.631 | 2,06 | 1.119 | 3,04 | ||||
| 2025-08-14 | 13F | UBS Group AG | 336.739 | 15,54 | 15.301 | 16,65 | ||||
| 2025-07-23 | 13F | Prime Capital Investment Advisors, LLC | 35.134 | -5,17 | 1.596 | -4,26 | ||||
| 2025-08-05 | 13F | Huntington National Bank | 0 | |||||||
| 2025-08-11 | 13F | Nations Financial Group Inc, /ia/ /adv | 14.898 | 27,19 | 677 | 28,27 | ||||
| 2025-07-17 | 13F | Patton Albertson Miller Group, Llc | 25.228 | -40,33 | 1.146 | -39,75 | ||||
| 2025-07-09 | 13F | Keystone Wealth Services, LLC | 25.337 | 0,02 | 1.151 | 0,96 | ||||
| 2025-07-17 | 13F | HB Wealth Management, LLC | 29.676 | -1,75 | 1.348 | -0,81 | ||||
| 2025-05-09 | 13F | Emerald Investment Partners, Llc | 0 | -100,00 | 0 | |||||
| 2025-07-29 | 13F | Fundamentun, Llc | 915.748 | 3,26 | 41.612 | 4,24 | ||||
| 2025-08-14 | 13F | Royal Bank Of Canada | 490.925 | 4,11 | 22.307 | 5,11 | ||||
| 2025-07-23 | 13F | Steel Peak Wealth Management LLC | 12.401 | 5,09 | 564 | 6,03 | ||||
| 2025-07-31 | 13F | Cambridge Investment Research Advisors, Inc. | 442.957 | 6,86 | 20 | 11,11 | ||||
| 2025-08-18 | 13F | Geneos Wealth Management Inc. | 253.227 | 51,42 | 11.507 | 52,86 | ||||
| 2025-07-25 | 13F | NorthRock Partners, LLC | 6.441 | -80,76 | 293 | -80,62 | ||||
| 2025-07-16 | 13F | Eagle Global Advisors Llc | 15.870 | 0,76 | 721 | 1,84 | ||||
| 2025-07-11 | 13F | SILVER OAK SECURITIES, Inc | 32.594 | -1,01 | 1.481 | 0,14 | ||||
| 2025-08-14 | 13F | IHT Wealth Management, LLC | 10.593 | -41,58 | 481 | -41,05 | ||||
| 2025-07-14 | 13F | Caitlin John, LLC | 5.999 | -4,76 | 273 | -3,89 | ||||
| 2025-04-23 | 13F | Keystone Financial Services | 0 | -100,00 | 0 | |||||
| 2025-08-13 | 13F | Kilter Group LLC | 1 | 0 | ||||||
| 2025-08-11 | 13F | Tidemark, LLC | 12.006 | -21,97 | 546 | -21,24 | ||||
| 2025-07-29 | 13F | Liberty Square Wealth Partners Llc | 4.805 | 0,00 | 218 | 0,93 | ||||
| 2025-08-14 | 13F | Icon Wealth Advisors, LLC | 5.710 | 50,86 | 259 | 52,35 | ||||
| 2025-07-17 | 13F | Beacon Capital Management, LLC | 245 | 0,00 | 11 | 0,00 | ||||
| 2025-08-08 | 13F | Pnc Financial Services Group, Inc. | 5.410 | -5,72 | 246 | -5,04 | ||||
| 2025-08-14 | 13F | Integrated Wealth Concepts LLC | 167.173 | 24,61 | 7.596 | 25,80 | ||||
| 2025-04-17 | 13F | KC Investment Advisors, LLC | 0 | -100,00 | 0 | |||||
| 2025-08-12 | 13F | Change Path, LLC | 23.603 | 1.072 | ||||||
| 2025-08-12 | 13F | Global Retirement Partners, LLC | 1.860 | 358,13 | 85 | 366,67 | ||||
| 2025-08-14 | 13F | Ameriprise Financial Inc | 996.346 | 15,25 | 45.267 | 16,35 | ||||
| 2025-08-14 | 13F | Raymond James Financial Inc | 113.763 | -18,17 | 5.169 | -17,39 | ||||
| 2025-08-14 | 13F | Colony Group, LLC | 7.560 | 344 | ||||||
| 2025-08-28 | NP | GPMIX - GuidePath(R) Multi-Asset Income Allocation Fund Service Shares | 30.362 | 1.380 | ||||||
| 2025-08-11 | 13F | Aptus Capital Advisors, LLC | 188 | 0,00 | 9 | 0,00 | ||||
| 2025-08-12 | 13F | FreeGulliver LLC | 53.387 | 1,99 | 2.426 | 2,97 | ||||
| 2025-07-25 | 13F | Atria Wealth Solutions, Inc. | 10.839 | 493 | ||||||
| 2025-05-14 | 13F | WCG Wealth Advisors LLC | 0 | -100,00 | 0 | |||||
| 2025-07-21 | 13F | Ameritas Advisory Services, LLC | 1.123 | 51 | ||||||
| 2025-07-24 | 13F | Us Bancorp \de\ | 6 | 0 | ||||||
| 2025-07-17 | 13F | Janney Montgomery Scott LLC | 508.100 | -1,86 | 23 | 0,00 | ||||
| 2025-04-30 | 13F | Horst & Graben Wealth Management LLC | 0 | -100,00 | 0 | |||||
| 2025-07-21 | 13F | Ameriflex Group, Inc. | 3.285 | 1,26 | 149 | 1,37 | ||||
| 2025-08-11 | 13F | Strategic Wealth Partners, Ltd. | 641 | 29 | ||||||
| 2025-08-13 | 13F | Continuum Advisory, LLC | 0 | -100,00 | 0 | |||||
| 2025-07-25 | 13F | Lion Street Advisors, LLC | 15.000 | -5,08 | 682 | -4,22 | ||||
| 2025-08-13 | 13F | Cerity Partners LLC | 8.614 | -54,76 | 391 | -54,32 | ||||
| 2025-08-07 | 13F | New England Private Wealth Advisors LLC | 6.674 | 1,64 | 303 | 2,71 | ||||
| 2025-06-26 | NP | BYLD - iShares Yield Optimized Bond ETF | 561.855 | 220,78 | 25.115 | 221,56 | ||||
| 2025-07-29 | 13F | Systelligence, LLC | 140.496 | -10,50 | 6.384 | -9,64 | ||||
| 2025-07-22 | 13F | Merit Financial Group, LLC | 248.811 | 29,49 | 11.306 | 30,72 | ||||
| 2025-07-10 | 13F | Sovran Advisors, LLC | 29.726 | 52,90 | 1.336 | 55,17 | ||||
| 2025-04-14 | 13F | Bangor Savings Bank | 0 | -100,00 | 0 | |||||
| 2025-08-06 | 13F | Able Wealth Management LLC | 12.936 | -22,30 | 588 | -21,63 | ||||
| 2025-08-11 | 13F | TD Waterhouse Canada Inc. | 2.167 | -98,14 | 98 | -98,13 | ||||
| 2025-04-24 | 13F | Tsfg, Llc | 0 | -100,00 | 0 | |||||
| 2025-08-14 | 13F | Ausdal Financial Partners, Inc. | 11.288 | 513 | ||||||
| 2025-07-25 | 13F | Apollon Wealth Management, LLC | 19.372 | -2,42 | 880 | -1,46 | ||||
| 2025-04-29 | 13F | Raleigh Capital Management Inc. | 0 | -100,00 | 0 | |||||
| 2025-08-13 | 13F | Vertex Planning Partners, LLC | 13.601 | 3,26 | 618 | 4,39 | ||||
| 2025-08-01 | 13F | Envestnet Asset Management Inc | 3.138.485 | 68,50 | 142.613 | 70,11 | ||||
| 2025-08-12 | 13F | Ade, Llc | 11.294 | 21,30 | 513 | 22,43 | ||||
| 2025-08-13 | 13F | Capital Analysts, Inc. | 1.695 | -10,84 | 0 | |||||
| 2025-08-14 | 13F | Stifel Financial Corp | 145.237 | 7,61 | 6.600 | 8,64 | ||||
| 2025-07-29 | 13F | Swmg, Llc | 42.563 | 2,27 | 1.924 | 3,39 | ||||
| 2025-08-12 | 13F | Integrated Advisors Network LLC | 5.906 | 268 | ||||||
| 2025-08-06 | 13F | Founders Financial Securities Llc | 39.458 | -14,03 | 1.793 | -12,80 | ||||
| 2025-08-11 | 13F | Cornerstone Planning Group LLC | 3 | 0,00 | 0 | |||||
| 2025-05-15 | 13F | Concorde Asset Management, LLC | 0 | -100,00 | 0 | |||||
| 2025-07-24 | 13F | Cyndeo Wealth Partners, LLC | 14.651 | 11,26 | 666 | 12,33 | ||||
| 2025-07-11 | 13F | Farther Finance Advisors, LLC | 29.703 | -19,81 | 1.350 | -18,93 | ||||
| 2025-07-25 | 13F | Midwest Capital Advisors, LLC | 544 | -67,52 | 25 | -68,00 | ||||
| 2025-07-15 | 13F | FLP Wealth Management, LLC | 0 | -100,00 | 0 | |||||
| 2025-08-12 | 13F | Proequities, Inc. | 0 | 0 | ||||||
| 2025-08-14 | 13F | Harwood Advisory Group, LLC | 0 | -100,00 | 0 | |||||
| 2025-08-14 | 13F | Peapack Gladstone Financial Corp | 59.620 | 2,32 | 3 | 0,00 | ||||
| 2025-07-28 | 13F | BRYN MAWR TRUST Co | 725 | 0,00 | 33 | 0,00 | ||||
| 2025-08-12 | 13F | LPL Financial LLC | 2.016.169 | 42,51 | 91.615 | 43,87 | ||||
| 2025-07-28 | 13F | RFG Advisory, LLC | 25.164 | 13,31 | 1.143 | 14,41 | ||||
| 2025-08-08 | 13F | Cetera Investment Advisers | 243.872 | 60,09 | 11.082 | 61,62 | ||||
| 2025-07-08 | 13F | Nbc Securities, Inc. | 594 | 0 | ||||||
| 2025-07-28 | 13F | Harbour Investments, Inc. | 98.181 | 1,75 | 4.461 | 2,74 | ||||
| 2025-08-14 | 13F | Sunbelt Securities, Inc. | 59 | -1,67 | 3 | 0,00 | ||||
| 2025-07-14 | 13F | Park Avenue Securities Llc | 148.338 | 87,24 | 7 | 100,00 | ||||
| 2025-08-26 | NP | EVVLX - The E-Valuator Very Conservative (0%-15%) RMS Fund Service Class Shares | 16.771 | 63,14 | 762 | 64,94 | ||||
| 2025-04-22 | 13F | Synergy Financial Management, LLC | 0 | -100,00 | 0 | |||||
| 2025-07-28 | 13F | Sagespring Wealth Partners, Llc | 27.461 | 24,32 | 1.248 | 25,45 | ||||
| 2025-08-14 | 13F | Atomi Financial Group, Inc. | 0 | -100,00 | 0 | |||||
| 2025-08-14 | 13F | Mercer Global Advisors Inc /adv | 13.249 | -53,32 | 602 | -52,86 | ||||
| 2025-04-01 | 13F | Oliver Lagore Vanvalin Investment Group | 0 | -100,00 | 0 | |||||
| 2025-07-18 | 13F | Precision Wealth Strategies, LLC | 5.063 | 230 | ||||||
| 2025-07-03 | 13F | CPA Asset Management LLC | 129.973 | 8,80 | 5.906 | 9,84 | ||||
| 2025-07-17 | 13F | Kelly Financial Services LLC | 59.595 | 2.708 | ||||||
| 2025-08-08 | 13F | Avantax Advisory Services, Inc. | 6.676 | 26,22 | 303 | 27,31 | ||||
| 2025-08-07 | 13F | 1620 Investment Advisors, Inc. | 14.740 | 5,66 | 670 | 6,70 | ||||
| 2025-08-12 | 13F | BlueStem Wealth Partners, LLC | 171.004 | -37,83 | 7.770 | -37,24 | ||||
| 2025-08-14 | 13F | Citadel Advisors Llc | 127.589 | 353,41 | 5.798 | 357,90 | ||||
| 2025-08-27 | 13F/A | Brinker Capital Investments, LLC | 10.383 | 472 | ||||||
| 2025-07-02 | 13F | Waller Financial Planning Group, Inc | 495.159 | 1,34 | 22.500 | 2,31 | ||||
| 2025-05-08 | 13F | Hoxton Planning & Management, LLC | 0 | -100,00 | 0 | |||||
| 2025-07-17 | 13F | Paradigm Financial Partners, Llc | 60.195 | 10,13 | 2.735 | 11,18 | ||||
| 2025-07-30 | 13F | LGT Financial Advisors LLC | 1.759 | 80 | ||||||
| 2025-07-22 | 13F | Accel Wealth Management | 67.138 | 4,52 | 3.051 | 5,50 | ||||
| 2025-07-23 | 13F | REAP Financial Group, LLC | 687 | 0,00 | 31 | 3,33 | ||||
| 2025-08-14 | 13F | Fmr Llc | 70 | -45,31 | 3 | -40,00 | ||||
| 2025-08-04 | 13F | Pensionmark Financial Group, Llc | 8.660 | 94,39 | 394 | 96,50 | ||||
| 2025-07-17 | 13F | Catalytic Wealth RIA, LLC | 11.709 | 10,32 | 532 | 11,53 | ||||
| 2025-08-14 | 13F | Comerica Bank | 5.562 | 38,91 | 253 | 40,00 | ||||
| 2025-07-31 | 13F | Forte Asset Management Llc | 20.852 | -22,10 | 948 | -21,35 | ||||
| 2025-08-13 | 13F | Mount Yale Investment Advisors, LLC | 510 | 23 | ||||||
| 2025-04-14 | 13F | RWM Asset Management, LLC | 0 | -100,00 | 0 | -100,00 | ||||
| 2025-07-14 | 13F | McGlone Suttner Wealth Management, Inc. | 272.605 | 3,93 | 12.387 | 4,93 | ||||
| 2025-08-06 | 13F | Convergence Financial, LLC | 27.810 | -3,19 | 1.264 | -2,24 | ||||
| 2025-07-24 | 13F | IFP Advisors, Inc | 109.511 | 71,18 | 4.976 | 72,84 | ||||
| 2025-07-23 | 13F | Dohj, Llc | 23.453 | -71,84 | 1.037 | -72,33 | ||||
| 2025-07-29 | 13F | Spirit Of America Management Corp/ny | 5.570 | 0,69 | 252 | 1,21 | ||||
| 2025-08-13 | 13F | GeoWealth Management, LLC | 11.762 | 10,82 | 534 | 11,95 | ||||
| 2025-08-11 | 13F | Principal Securities, Inc. | 2.407 | -17,54 | 109 | -15,50 | ||||
| 2025-08-12 | 13F | Coldstream Capital Management Inc | 0 | -100,00 | 0 | |||||
| 2025-04-30 | 13F | Phillips Financial Management, Llc | 0 | -100,00 | 0 | |||||
| 2025-08-05 | 13F | Dynasty Wealth Management, Llc | 42.514 | -2,53 | 1.932 | -1,63 | ||||
| 2025-07-21 | 13F | Cliftonlarsonallen Wealth Advisors, Llc | 519.201 | -15,08 | 23.592 | -14,26 | ||||
| 2025-08-14 | 13F | Goldman Sachs Group Inc | 86.656 | 1.105,40 | 3.938 | 1.118,89 | ||||
| 2025-08-06 | 13F | First Horizon Advisors, Inc. | 9.856 | 38,19 | 448 | 39,25 | ||||
| 2025-08-13 | 13F | West Wealth Group, LLC | 7.310 | 333 | ||||||
| 2025-08-15 | 13F | Kestra Advisory Services, LLC | 14.748 | 6,73 | 670 | 7,89 | ||||
| 2025-07-28 | 13F | Lunt Capital Management, Inc. | 75.261 | 2,59 | 3.420 | 3,57 | ||||
| 2025-04-15 | 13F | Collier Financial | 0 | -100,00 | 0 | |||||
| 2025-08-14 | 13F | GWM Advisors LLC | 17.609 | 1,74 | 800 | 2,83 | ||||
| 2025-08-04 | 13F | Twin City Private Wealth, Llc | 8.153 | 112,54 | 370 | 115,12 | ||||
| 2025-08-12 | 13F | Park Square Financial Group, LLC | 46 | 2 | ||||||
| 2025-04-23 | 13F | TSA Wealth Managment LLC | 0 | -100,00 | 0 | |||||
| 2025-05-15 | 13F | Sentinus, LLC | 0 | -100,00 | 0 | |||||
| 2025-07-28 | 13F | DORVAL Corp | 231.061 | 13,15 | 10.499 | 13,47 | ||||
| 2025-08-14 | 13F | Tennessee Valley Asset Management Partners | 0 | -100,00 | 0 | |||||
| 2025-08-26 | NP | EVCLX - The E-Valuator Conservative (15%-30%) RMS Fund Service Class Shares | 30.192 | -1,78 | 1.372 | -0,87 | ||||
| 2025-08-18 | 13F/A | National Bank Of Canada /fi/ | 19.547 | 28,99 | 888 | 30,40 | ||||
| 2025-07-29 | 13F | Private Trust Co Na | 419 | -13,79 | 19 | -9,52 | ||||
| 2025-05-08 | 13F | Arkadios Wealth Advisors | 0 | -100,00 | 0 | |||||
| 2025-07-31 | 13F | Leavell Investment Management, Inc. | 4.705 | -3,59 | 214 | -2,74 | ||||
| 2025-08-01 | 13F | Rossby Financial, LCC | 868 | 19,23 | 39 | 21,88 | ||||
| 2025-07-14 | 13F | AdvisorNet Financial, Inc | 553 | 0,00 | 25 | 4,17 | ||||
| 2025-08-19 | 13F | Cape Investment Advisory, Inc. | 97 | -43,60 | 4 | -42,86 | ||||
| 2025-08-05 | 13F | Sigma Planning Corp | 21.600 | -4,80 | 982 | -3,92 | ||||
| 2025-04-28 | 13F | Buffington Mohr McNeal | 5.875 | -83,90 | 264 | -83,69 | ||||
| 2025-07-23 | 13F | Ameliora Wealth Management Ltd. | 548.401 | 5,15 | 24.919 | 6,15 | ||||
| 2025-07-22 | 13F | Miracle Mile Advisors, LLC | 23.322 | 1.060 | ||||||
| 2025-08-04 | 13F | IFG Advisory, LLC | 5.967 | 16,82 | 271 | 18,34 | ||||
| 2025-08-04 | 13F | Atria Investments Llc | 48.626 | 3,56 | 2.210 | 4,54 | ||||
| 2025-08-14 | 13F | Bank Of America Corp /de/ | 1.132.007 | 88,20 | 51.438 | 90,00 | ||||
| 2025-08-05 | 13F | Bank of New York Mellon Corp | 184.007 | 14,58 | 8.361 | 15,68 | ||||
| 2025-08-06 | 13F | Vestmark Advisory Solutions, Inc. | 87.926 | 3.995 | ||||||
| 2025-07-30 | 13F | DecisionMap Wealth Management, LLC | 6.165 | -5,47 | 280 | -4,44 | ||||
| 2025-04-23 | 13F | Mascagni Wealth Management, Inc. | 0 | -100,00 | 0 | -100,00 | ||||
| 2025-08-04 | 13F | Assetmark, Inc | 157.095 | 7.138 | ||||||
| 2025-08-14 | 13F/A | Rockefeller Capital Management L.P. | 37.499 | 136,02 | 1.704 | 138,18 | ||||
| 2025-05-15 | 13F | Hrt Financial Lp | 0 | -100,00 | 0 | |||||
| 2025-08-14 | 13F | Snowden Capital Advisors LLC | 9.352 | -5,99 | 425 | -5,15 | ||||
| 2025-08-13 | 13F | Jones Financial Companies Lllp | 38 | 2 | ||||||
| 2025-08-14 | 13F | Betterment LLC | 687.332 | 8,26 | 31 | 10,71 | ||||
| 2025-04-21 | 13F | Nelson, Van Denburg & Campbell Wealth Management Group, LLC | 0 | -100,00 | 0 | |||||
| 2025-07-24 | 13F | Certus Wealth Management, LLC | 5.997 | -0,23 | 273 | 2,26 | ||||
| 2025-08-11 | 13F | Private Advisor Group, LLC | 234.158 | 3,58 | 10.640 | 4,57 | ||||
| 2025-08-08 | 13F | Capital Investment Advisory Services, LLC | 126 | 1,61 | 6 | 0,00 | ||||
| 2025-08-12 | 13F | Jpmorgan Chase & Co | 317.402 | 47,00 | 14.423 | 48,41 | ||||
| 2025-08-07 | 13F | Resources Investment Advisors, LLC. | 731.608 | 17,14 | 33.244 | 18,26 |
Other Listings
| MX:IGEB |