Grundlæggende statistik
| Institutionelle ejere | 102 total, 102 long only, 0 short only, 0 long/short - change of 10,75% MRQ |
| Gennemsnitlig porteføljeallokering | 0.1191 % - change of -1,02% MRQ |
| Institutionelle aktier (lange) | 6.200.864 (ex 13D/G) - change of 0,14MM shares 2,25% MRQ |
| Institutionel værdi (lang) | $ 138.999 USD ($1000) |
Institutionelt ejerskab og aktionærer
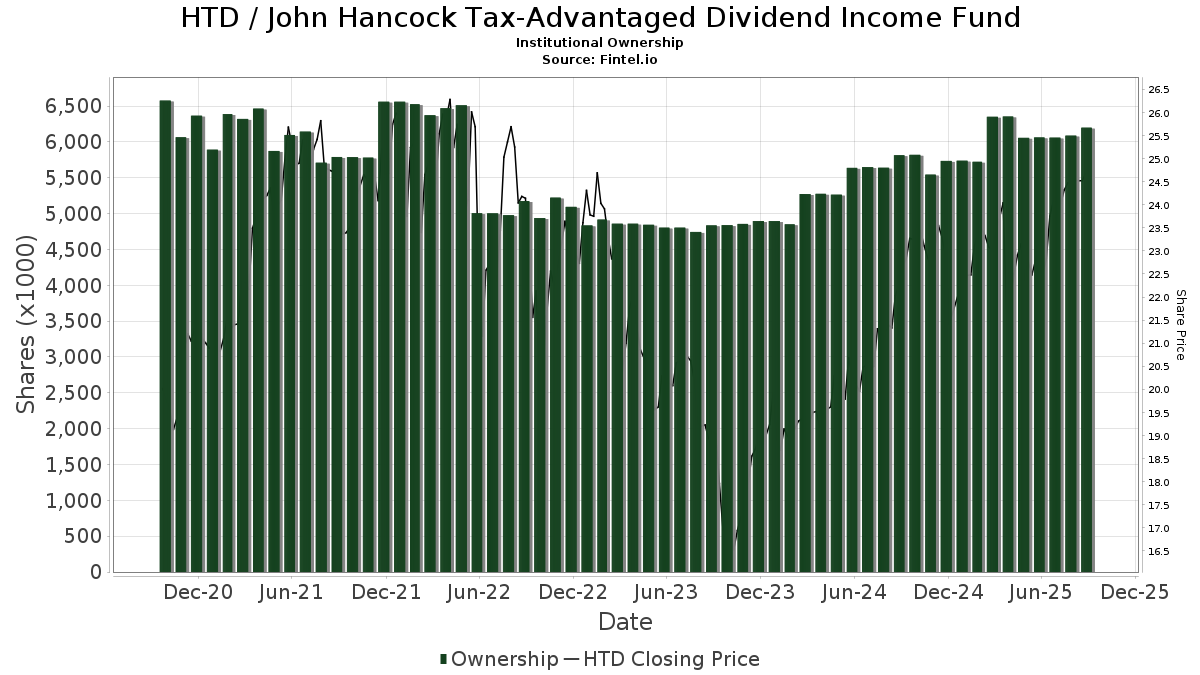
John Hancock Tax-Advantaged Dividend Income Fund (US:HTD) har 102 institutionelle ejere og aktionærer, der har indsendt 13D/G- eller 13F-formularer til Securities Exchange Commission (SEC). Disse institutioner har i alt 6,200,864 aktier. Største aktionærer omfatter UBS Group AG, Invesco Ltd., PCEF - Invesco CEF Income Composite ETF, Captrust Financial Advisors, Morgan Stanley, Guggenheim Capital Llc, Raymond James Financial Inc, Bank Of America Corp /de/, LPL Financial LLC, and Wells Fargo & Company/mn .
John Hancock Tax-Advantaged Dividend Income Fund (NYSE:HTD) institutionel ejerskabsstruktur viser aktuelle positioner i virksomheden efter institutioner og fonde, samt seneste ændringer i positionsstørrelse. Større aktionærer kan omfatte individuelle investorer, investeringsforeninger, hedgefonde eller institutioner. Skema 13D angiver, at investoren besidder (eller besidder) mere end 5 % af virksomheden og har til hensigt (eller har til hensigt at) aktivt at forfølge en ændring i forretningsstrategi. Skema 13G indikerer en passiv investering på over 5%.
The share price as of September 12, 2025 is 24,61 / share. Previously, on September 16, 2024, the share price was 22,53 / share. This represents an increase of 9,23% over that period.
Fondens stemningsscore
Fund Sentiment Score (fka Ownership Accumulation Score) finder de aktier, der bliver mest købt af fonde. Det er resultatet af en sofistikeret, multi-faktor kvantitativ model, der identificerer virksomheder med de højeste niveauer af institutionel akkumulering. Scoringsmodellen bruger en kombination af den samlede stigning i oplyste ejere, ændringerne i porteføljeallokeringer i disse ejere og andre målinger. Tallet går fra 0 til 100, hvor højere tal indikerer et højere niveau af akkumulering for sine jævnaldrende, og 50 er gennemsnittet.
Opdateringsfrekvens: Dagligt
Se Ownership Explorer, som giver en liste over højest rangerende virksomheder.
Institutionel Put/Call-forhold
Ud over at indberette standardaktie- og gældsudstedelser skal institutter med mere end 100 mill. aktiver under forvaltning også oplyse deres put- og call-optionsbeholdninger. Da salgsoptioner generelt indikerer negativ stemning, og købsoptioner indikerer positiv stemning, kan vi få en fornemmelse af den overordnede institutionelle stemning ved at plotte forholdet mellem put og kald. Diagrammet til højre viser det historiske put/call-forhold for dette instrument.
Brug af Put/Call Ratio som en indikator for investorernes stemning overvinder en af de vigtigste mangler ved at bruge totalt institutionelt ejerskab, som er, at en betydelig mængde af aktiver under forvaltning investeres passivt for at spore indekser. Passivt forvaltede fonde køber typisk ikke optioner, så indikatoren for put/call-forholdet følger mere nøje følelsen af aktivt forvaltede fonde.
13F og NPORT arkivering
Detaljer om 13F-arkivering er gratis. Detaljer om NP-ansøgninger kræver et premium-medlemskab. Grønne rækker angiver nye positioner. Røde rækker angiver lukkede positioner. Klik på linket ikon for at se den fulde transaktionshistorik.
Opgrader
for at låse premium-data op og eksportere til Excel ![]() .
.
| Fil dato | Kilde | Investor | Type | Gennemsnitlig pris (Øst) |
Aktier | Δ Aktier (%) |
Rapporteret Værdi ($1000) |
Δ Værdi (%) |
Port Alloc (%) |
|
|---|---|---|---|---|---|---|---|---|---|---|
| 2025-08-08 | 13F | Cornerstone Advisors, LLC | 10.292 | 241 | ||||||
| 2025-07-08 | 13F | Nbc Securities, Inc. | 4.025 | 0,00 | 0 | |||||
| 2025-07-11 | 13F | Seacrest Wealth Management, Llc | 0 | -100,00 | 0 | |||||
| 2025-07-17 | 13F | Presper Financial Architects, LLC | 27.574 | 1 | ||||||
| 2025-08-01 | 13F | Envestnet Asset Management Inc | 20.014 | -11,60 | 468 | -13,49 | ||||
| 2025-09-11 | 13F | Milestones Private Investment Advisors LLC | 11.311 | 265 | ||||||
| 2025-07-11 | 13F | Farther Finance Advisors, LLC | 150 | 4 | ||||||
| 2025-07-21 | 13F | Ameriflex Group, Inc. | 500 | 0,00 | 11 | 0,00 | ||||
| 2025-08-14 | 13F | UBS Group AG | 717.942 | -0,79 | 16.793 | -3,03 | ||||
| 2025-07-29 | 13F | Private Trust Co Na | 2.000 | 0,00 | 47 | -2,13 | ||||
| 2025-08-27 | NP | RYDEX VARIABLE TRUST - Multi-Hedge Strategies Fund Variable Annuity | 135 | -19,16 | 3 | 0,00 | ||||
| 2025-08-07 | 13F | Allworth Financial LP | 2.303 | 1,19 | 54 | 3,92 | ||||
| 2025-08-04 | 13F | Wolverine Asset Management Llc | 8.036 | 188 | ||||||
| 2025-08-14 | 13F | Comerica Bank | 3.700 | -13,95 | 87 | -15,69 | ||||
| 2025-08-14 | 13F | Cnh Partners Llc | 119.615 | -24,38 | 2.798 | -25,91 | ||||
| 2025-08-19 | 13F | Newbridge Financial Services Group, Inc. | 96.535 | 2.258 | ||||||
| 2025-08-14 | 13F | Stifel Financial Corp | 127.526 | -0,86 | 2.983 | -3,12 | ||||
| 2025-08-08 | 13F | Avalon Trust Co | 897 | 21 | ||||||
| 2025-08-08 | 13F | Calamos Advisors LLC | 22.448 | -8,00 | 525 | -9,95 | ||||
| 2025-08-13 | 13F | Lido Advisors, LLC | 17.567 | 0,00 | 411 | -2,38 | ||||
| 2025-04-08 | 13F | Parallel Advisors, LLC | 0 | -100,00 | 0 | |||||
| 2025-05-08 | 13F | Endeavor Private Wealth, Inc. | 0 | -100,00 | 0 | |||||
| 2025-07-08 | 13F | Morris Retirement Advisors, LLC | 28.208 | -1,96 | 660 | -4,22 | ||||
| 2025-08-06 | 13F | Founders Financial Securities Llc | 18.915 | 0,00 | 442 | 3,27 | ||||
| 2025-08-13 | 13F | Walleye Capital LLC | 27.100 | 11,71 | 634 | 9,14 | ||||
| 2025-08-08 | 13F | Avantax Advisory Services, Inc. | 12.295 | -2,41 | 288 | -4,65 | ||||
| 2025-07-18 | 13F | PFG Investments, LLC | 14.960 | 24,12 | 350 | 21,18 | ||||
| 2025-08-04 | 13F | Live Oak Private Wealth LLC | 102.602 | 0,00 | 2.400 | -2,28 | ||||
| 2025-07-25 | 13F | Concord Wealth Partners | 83 | 0,00 | 2 | 0,00 | ||||
| 2025-08-22 | NP | Cornerstone Total Return Fund Inc | 6.589 | -40,61 | 154 | -31,25 | ||||
| 2025-04-29 | 13F | Truist Financial Corp | 0 | -100,00 | 0 | |||||
| 2025-08-14 | 13F | Royal Bank Of Canada | 159.735 | -3,56 | 3.736 | -5,75 | ||||
| 2025-07-28 | 13F | Mutual Advisors, LLC | 24.362 | 1,60 | 589 | 8,47 | ||||
| 2025-08-14 | 13F | McIlrath & Eck, LLC | 500 | 0,00 | 12 | 0,00 | ||||
| 2025-08-14 | 13F | Wells Fargo & Company/mn | 270.810 | -2,87 | 6.334 | -5,07 | ||||
| 2025-08-12 | 13F | Proequities, Inc. | 0 | 0 | ||||||
| 2025-07-28 | NP | PCEF - Invesco CEF Income Composite ETF This fund is a listed as child fund of Invesco Ltd. and if that institution has disclosed ownership in this security, then these positions will not be double counted when calculating total shares and total value | 487.719 | -0,71 | 11.247 | -2,56 | ||||
| 2025-08-05 | 13F | GPS Wealth Strategies Group, LLC | 7.502 | 0,00 | 175 | -2,23 | ||||
| 2025-08-08 | 13F | Kingsview Wealth Management, LLC | 12.868 | 1,40 | 301 | -0,99 | ||||
| 2025-08-14 | 13F | Bank Of America Corp /de/ | 295.497 | -1,50 | 6.912 | -3,72 | ||||
| 2025-05-13 | 13F | Elequin Capital Lp | 0 | -100,00 | 0 | |||||
| 2025-08-14 | 13F | 1607 Capital Partners, LLC | 24.431 | -14,97 | 571 | -16,89 | ||||
| 2025-07-31 | 13F | Cambridge Investment Research Advisors, Inc. | 22.705 | -26,09 | 1 | |||||
| 2025-08-12 | 13F | Global Retirement Partners, LLC | 1.764 | -72,79 | 41 | -71,13 | ||||
| 2025-08-14 | 13F | GWM Advisors LLC | 16.802 | 0,54 | 393 | -1,50 | ||||
| 2025-06-27 | NP | Calamos ETF Trust - Calamos CEF Income & Arbitrage ETF | 22.448 | -11,54 | 514 | -10,45 | ||||
| 2025-07-18 | 13F | Institute for Wealth Management, LLC. | 8.992 | 0,00 | 210 | -2,33 | ||||
| 2025-08-11 | 13F | Private Advisor Group, LLC | 13.633 | -0,21 | 319 | -2,45 | ||||
| 2025-08-18 | 13F | Geneos Wealth Management Inc. | 11.700 | 100,00 | 274 | 96,40 | ||||
| 2025-07-15 | 13F | North Star Investment Management Corp. | 1.000 | 0,00 | 23 | 0,00 | ||||
| 2025-07-17 | 13F | Janney Montgomery Scott LLC | 84.010 | 31,41 | 2 | 0,00 | ||||
| 2025-07-29 | 13F | First National Bank of Mount Dora, Trust Investment Services | 27.800 | 0,00 | 650 | -2,26 | ||||
| 2025-08-11 | 13F | Principal Securities, Inc. | 222 | -52,87 | 5 | -50,00 | ||||
| 2025-07-29 | 13F | Mezzasalma Advisors, LLC | 12.039 | 1,82 | 282 | -0,35 | ||||
| 2025-05-06 | 13F | Venturi Wealth Management, LLC | 0 | -100,00 | 0 | |||||
| 2025-09-04 | 13F/A | Advisor Group Holdings, Inc. | 166.155 | 29,95 | 3.887 | 27,03 | ||||
| 2025-08-13 | 13F | Northwestern Mutual Wealth Management Co | 1.517 | -59,87 | 35 | -61,11 | ||||
| 2025-08-12 | 13F | LPL Financial LLC | 275.252 | -5,61 | 6.438 | -7,74 | ||||
| 2025-08-15 | 13F | Captrust Financial Advisors | 476.855 | -2,93 | 11.154 | -5,12 | ||||
| 2025-07-21 | 13F | Ameritas Advisory Services, LLC | 522 | 12 | ||||||
| 2025-08-11 | 13F | Nations Financial Group Inc, /ia/ /adv | 22.090 | 3,51 | 517 | 1,18 | ||||
| 2025-08-14 | 13F | Ausdal Financial Partners, Inc. | 8.764 | -9,51 | 205 | -11,69 | ||||
| 2025-08-07 | 13F | Readystate Asset Management Lp | 26.741 | 625 | ||||||
| 2025-08-14 | 13F | Karpus Management, Inc. | 226.036 | -1,86 | 5.287 | -4,08 | ||||
| 2025-08-15 | 13F | Morgan Stanley | 395.174 | 0,04 | 9.243 | -2,21 | ||||
| 2025-04-09 | 13F | Capital CS Group, LLC | 0 | -100,00 | 0 | |||||
| 2025-07-22 | 13F | Powell Investment Advisors, LLC | 10.100 | 0,00 | 236 | -2,07 | ||||
| 2025-08-06 | 13F | Smh Capital Advisors Inc | 8.728 | -2,19 | 204 | -4,23 | ||||
| 2025-08-22 | NP | Cornerstone Strategic Value Fund Inc | 3.703 | -73,15 | 87 | -71,62 | ||||
| 2025-07-17 | 13F | Beacon Capital Management, LLC | 2.877 | 0,00 | 67 | -1,47 | ||||
| 2025-08-13 | 13F | Jones Financial Companies Lllp | 0 | -100,00 | 0 | |||||
| 2025-07-16 | 13F | St Germain D J Co Inc | 1.917 | 0,00 | 45 | -2,22 | ||||
| 2025-05-15 | 13F | WPG Advisers, LLC | 0 | -100,00 | 0 | |||||
| 2025-07-24 | 13F | Conning Inc. | 11.150 | 0,00 | 261 | -2,26 | ||||
| 2025-08-13 | 13F | Guggenheim Capital Llc | 363.179 | -10,68 | 8.495 | -12,70 | ||||
| 2025-05-13 | 13F | HighTower Advisors, LLC | 0 | -100,00 | 0 | |||||
| 2025-05-15 | 13F | Polar Asset Management Partners Inc. | 0 | -100,00 | 0 | |||||
| 2025-08-20 | NP | ADANX - AQR Diversified Arbitrage Fund Class N | 32.728 | -18,53 | 766 | -20,40 | ||||
| 2025-08-04 | 13F | Creative Financial Designs Inc /adv | 600 | 0,00 | 14 | 0,00 | ||||
| 2025-07-14 | 13F | Argentarii, LLC | 10.823 | 0,00 | 253 | -1,94 | ||||
| 2025-08-05 | 13F | Welch & Forbes Llc | 50.000 | 0,00 | 1.170 | -2,26 | ||||
| 2025-08-19 | 13F | Advisory Services Network, LLC | 9.164 | 0,00 | 222 | 1,37 | ||||
| 2025-08-08 | 13F | Pnc Financial Services Group, Inc. | 5.962 | -26,19 | 139 | -27,98 | ||||
| 2025-07-10 | 13F | Wealth Enhancement Advisory Services, Llc | 42.329 | 0,35 | 1.011 | 0,10 | ||||
| 2025-04-25 | 13F | WASHINGTON TRUST Co | 0 | -100,00 | 0 | |||||
| 2025-08-29 | 13F | Evolution Wealth Management Inc. | 670 | 16 | ||||||
| 2025-08-04 | 13F | Spire Wealth Management | 25.404 | 22,09 | 594 | 19,52 | ||||
| 2025-08-13 | 13F | Congress Wealth Management LLC / DE / | 29.728 | 17,87 | 695 | 15,26 | ||||
| 2025-08-14 | 13F | Cohen & Steers, Inc. | 72.835 | 0,00 | 2 | 0,00 | ||||
| 2025-08-07 | 13F | CENTRAL TRUST Co | 88.223 | 0,00 | 2.064 | -2,27 | ||||
| 2025-08-15 | 13F | Provenance Wealth Advisors, LLC | 0 | -100,00 | 0 | -100,00 | ||||
| 2025-08-14 | 13F | Ameriprise Financial Inc | 24.904 | -3,46 | 583 | -5,67 | ||||
| 2025-08-04 | 13F | Creekmur Asset Management LLC | 0 | 0 | ||||||
| 2025-08-14 | 13F | Wiley Bros.-aintree Capital, Llc | 17.717 | 414 | ||||||
| 2025-08-07 | 13F | Hennion & Walsh Asset Management, Inc. | 42.806 | -2,88 | 1.001 | -5,03 | ||||
| 2025-08-07 | 13F | Samalin Investment Counsel, LLC | 49.758 | -4,10 | 1.164 | -6,29 | ||||
| 2025-08-08 | 13F | Fortis Group Advisors, LLC | 9.090 | 221 | ||||||
| 2025-07-24 | 13F | Us Bancorp \de\ | 10.701 | 0,00 | 250 | -2,34 | ||||
| 2025-07-14 | 13F | Sowell Financial Services LLC | 9.519 | -2,08 | 223 | -4,31 | ||||
| 2025-07-25 | NP | FCEF - First Trust CEF Income Opportunity ETF This fund is a listed as child fund of First Trust Advisors Lp and if that institution has disclosed ownership in this security, then these positions will not be double counted when calculating total shares and total value | 62.098 | 4,86 | 1.432 | 2,88 | ||||
| 2025-08-14 | 13F | Abbot Financial Management, Inc. | 15.600 | 0,00 | 365 | -2,41 | ||||
| 2025-08-13 | 13F | First Trust Advisors Lp | 120.175 | 2,28 | 2.811 | -0,04 | ||||
| 2025-08-05 | 13F | Shaker Financial Services, LLC | 23.443 | 548 | ||||||
| 2025-08-12 | 13F | Steward Partners Investment Advisory, Llc | 7.500 | 1,69 | 175 | -0,57 | ||||
| 2025-08-06 | 13F | Commonwealth Equity Services, Llc | 46.577 | 1,38 | 1 | 0,00 | ||||
| 2025-04-28 | 13F | Redmont Wealth Advisors Llc | 2.612 | 63 | ||||||
| 2025-07-17 | 13F | Oakworth Capital, Inc. | 1.500 | 0,00 | 35 | 0,00 | ||||
| 2025-08-27 | NP | RYMSX - Guggenheim Multi-Hedge Strategies Fund Class P | 80 | -37,50 | 2 | -66,67 | ||||
| 2025-07-21 | 13F | Kennebec Savings Bank | 1.155 | 0,00 | 27 | 0,00 | ||||
| 2025-08-13 | 13F | Invesco Ltd. | 545.627 | 5,18 | 12.762 | 2,81 | ||||
| 2025-07-15 | 13F | Fifth Third Bancorp | 3.958 | 6.724,14 | 93 | 9.100,00 | ||||
| 2025-07-25 | 13F | Cwm, Llc | 500 | 0,00 | 0 | |||||
| 2025-08-12 | 13F | Jpmorgan Chase & Co | 42 | -95,57 | 1 | -100,00 | ||||
| 2025-05-12 | 13F | Fmr Llc | 0 | -100,00 | 0 | |||||
| 2025-08-14 | 13F | Raymond James Financial Inc | 311.297 | 4,25 | 7.281 | 1,90 | ||||
| 2025-04-21 | 13F | ORG Partners LLC | 0 | -100,00 | 0 | |||||
| 2025-08-08 | 13F | Cetera Investment Advisers | 163.056 | 2,19 | 3.814 | -0,13 | ||||
| 2025-08-13 | 13F | Cheviot Value Management, LLC | 200 | 0,00 | 5 | 0,00 | ||||
| 2025-08-06 | 13F | North Capital, Inc. | 1.679 | 0,00 | 39 | -2,50 |