Grundlæggende statistik
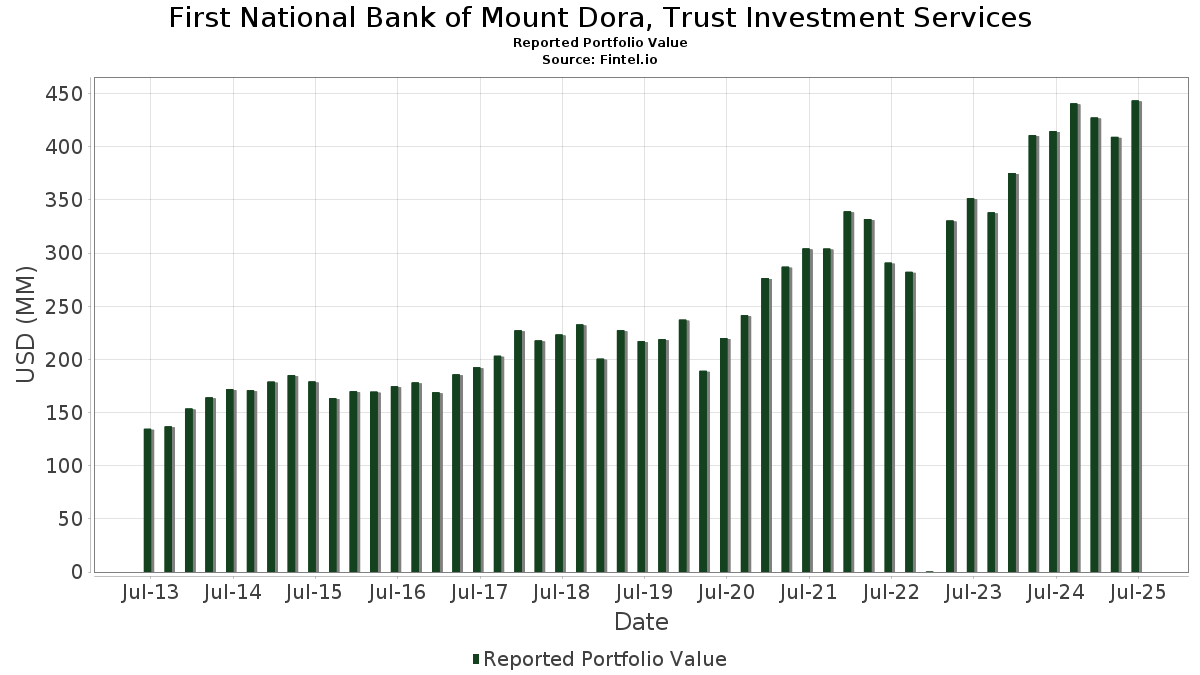
| Porteføljeværdi | $ 443.452.755 |
| Nuværende stillinger | 130 |
Seneste beholdninger, ydeevne, AUM (fra 13F, 13D)
First National Bank of Mount Dora, Trust Investment Services har afsløret 130 samlede besiddelser i deres seneste SEC-arkivering. Den seneste porteføljeværdi er beregnet til at være $ 443.452.755 USD. Faktiske aktiver under forvaltning (AUM) er denne værdi plus kontanter (som ikke er oplyst). First National Bank of Mount Dora, Trust Investment Servicess største beholdninger er NVIDIA Corporation (US:NVDA) , SPDR S&P 500 ETF (US:SPY) , Microsoft Corporation (US:MSFT) , Broadcom Inc. (US:AVGO) , and Apple Inc. (US:AAPL) .
Top øger dette kvartal
Vi bruger ændringen i porteføljeallokeringen, fordi dette er den mest meningsfulde metrik. Ændringer kan skyldes handler eller ændringer i aktiekurser.
| Sikkerhed | Aktier (MM) |
Værdi (MM$) |
Portefølje % | ΔPortefølje % |
|---|---|---|---|---|
| 0,44 | 9,82 | 2,2155 | 2,2155 | |
| 0,06 | 16,55 | 3,7316 | 1,2700 | |
| 0,13 | 20,81 | 4,6931 | 1,1700 | |
| 0,01 | 8,63 | 1,9462 | 0,3371 | |
| 0,01 | 1,08 | 0,2430 | 0,0676 | |
| 0,10 | 10,23 | 2,3068 | 0,0609 | |
| 0,00 | 0,21 | 0,0470 | 0,0470 | |
| 0,02 | 4,53 | 1,0218 | 0,0316 | |
| 0,00 | 0,21 | 0,0261 | 0,0261 | |
| 0,00 | 0,30 | 0,0672 | 0,0068 |
Top falder i dette kvartal
Vi bruger ændringen i porteføljeallokeringen, fordi dette er den mest meningsfulde metrik. Ændringer kan skyldes handler eller ændringer i aktiekurser.
| Sikkerhed | Aktier (MM) |
Værdi (MM$) |
Portefølje % | ΔPortefølje % |
|---|---|---|---|---|
| 0,07 | 13,97 | 1,7016 | -1,9973 | |
| 0,01 | 11,02 | 1,3420 | -1,5020 | |
| 0,01 | 12,76 | 1,5544 | -1,4292 | |
| 0,04 | 10,29 | 1,2539 | -1,4155 | |
| 0,09 | 9,87 | 1,2029 | -1,4109 | |
| 0,05 | 8,73 | 1,0631 | -1,3718 | |
| 0,14 | 4,86 | 0,5923 | -1,1845 | |
| 0,03 | 17,21 | 2,0971 | -1,0680 | |
| 0,04 | 12,84 | 1,5641 | -1,0594 | |
| 0,03 | 18,85 | 2,2970 | -0,9062 |
13F og Fondsarkivering
Denne formular blev indsendt den 2025-07-29 for rapporteringsperioden 2025-06-30. Klik på linkikonet for at se den fulde transaktionshistorik.
Opgrader for at låse op for premium-data og eksportere til Excel ![]() .
.
| Sikkerhed | Type | Gennemsnitlig aktiekurs | Aktier (MM) |
Δ Aktier (%) |
Δ Aktier (%) |
Værdi ($MM) |
Portefølje (%) |
ΔPortefølje (%) |
|
|---|---|---|---|---|---|---|---|---|---|
| NVDA / NVIDIA Corporation | 0,13 | -0,99 | 20,81 | 44,34 | 4,6931 | 1,1700 | |||
| SPY / SPDR S&P 500 ETF | 0,03 | 30,21 | 18,85 | 43,82 | 2,2970 | -0,9062 | |||
| MSFT / Microsoft Corporation | 0,03 | 0,29 | 17,21 | 32,89 | 2,0971 | -1,0680 | |||
| AVGO / Broadcom Inc. | 0,06 | -0,23 | 16,55 | 64,26 | 3,7316 | 1,2700 | |||
| AAPL / Apple Inc. | 0,07 | -0,11 | 13,97 | -7,74 | 1,7016 | -1,9973 | |||
| JPM / JPMorgan Chase & Co. | 0,04 | 1,17 | 12,84 | 19,57 | 1,5641 | -1,0594 | |||
| COST / Costco Wholesale Corporation | 0,01 | -0,17 | 12,76 | 4,50 | 1,5544 | -1,4292 | |||
| ORCL / Oracle Corporation | 0,05 | 4,42 | 11,44 | 63,29 | 1,3938 | -0,3182 | |||
| LLY / Eli Lilly and Company | 0,01 | 0,27 | 11,02 | -5,36 | 1,3420 | -1,5020 | |||
| PGR / The Progressive Corporation | 0,04 | -0,09 | 10,29 | -5,79 | 1,2539 | -1,4155 | |||
| WMT / Walmart Inc. | 0,10 | -0,08 | 10,23 | 11,29 | 2,3068 | 0,0609 | |||
| GOOG / Alphabet Inc. | 0,06 | 3,51 | 10,14 | 17,53 | 1,2356 | -0,8729 | |||
| XOM / Exxon Mobil Corporation | 0,09 | 1,83 | 9,87 | -7,70 | 1,2029 | -1,4109 | |||
| TMUS / T-Mobile US, Inc. | 0,04 | 0,40 | 9,86 | -10,31 | 2,2235 | -0,4626 | |||
| SCHF / Schwab Strategic Trust - Schwab International Equity ETF | 0,44 | 9,82 | 2,2155 | 2,2155 | |||||
| TRI / Thomson Reuters Corporation | 0,05 | -0,37 | 9,54 | 15,97 | 1,1623 | -0,8477 | |||
| TXN / Texas Instruments Incorporated | 0,05 | -0,65 | 9,41 | 14,79 | 1,1463 | -0,8567 | |||
| ABBV / AbbVie Inc. | 0,05 | -1,16 | 8,73 | -12,43 | 1,0631 | -1,3718 | |||
| META / Meta Platforms, Inc. | 0,01 | 2,34 | 8,63 | 31,06 | 1,9462 | 0,3371 | |||
| LIN / Linde plc | 0,02 | 0,51 | 7,24 | 1,27 | 1,6323 | -0,1141 | |||
| AMZN / Amazon.com, Inc. | 0,03 | -35,41 | 7,00 | -25,52 | 1,5779 | -0,7175 | |||
| DE / Deere & Company | 0,01 | -0,90 | 6,71 | 7,36 | 0,8170 | -0,7093 | |||
| ADBE / Adobe Inc. | 0,02 | 0,39 | 6,60 | 1,27 | 0,8046 | -0,7890 | |||
| TJX / The TJX Companies, Inc. | 0,05 | 0,10 | 6,53 | 1,48 | 0,7952 | -0,7762 | |||
| PEG / Public Service Enterprise Group Incorporated | 0,08 | -0,11 | 6,47 | 2,18 | 0,7885 | -0,7593 | |||
| MCD / McDonald's Corporation | 0,02 | 1,04 | 6,44 | -5,49 | 0,7845 | -0,8803 | |||
| HD / The Home Depot, Inc. | 0,02 | -11,83 | 6,27 | -11,79 | 1,4136 | -0,3228 | |||
| UPS / United Parcel Service, Inc. | 0,06 | -0,11 | 6,18 | -8,34 | 0,7528 | -0,8943 | |||
| V / Visa Inc. | 0,02 | -1,19 | 5,82 | 0,10 | 0,7092 | -0,7117 | |||
| FTNT / Fortinet, Inc. | 0,05 | 2,23 | 5,80 | 12,28 | 0,7062 | -0,5553 | |||
| NEE / NextEra Energy, Inc. | 0,07 | 4,65 | 5,12 | 2,48 | 0,6241 | -0,5974 | |||
| PG / The Procter & Gamble Company | 0,03 | -1,52 | 5,12 | -7,94 | 0,6241 | -0,7354 | |||
| ORLY / O'Reilly Automotive, Inc. | 0,05 | 1.091,49 | 4,93 | -25,04 | 1,1128 | -0,4957 | |||
| ICE / Intercontinental Exchange, Inc. | 0,03 | -0,86 | 4,93 | 5,44 | 0,6001 | -0,5413 | |||
| CMCSA / Comcast Corporation | 0,14 | -30,87 | 4,86 | -33,15 | 0,5923 | -1,1845 | |||
| AMAT / Applied Materials, Inc. | 0,03 | 1,51 | 4,74 | 28,07 | 0,5775 | -0,3270 | |||
| VIG / Vanguard Specialized Funds - Vanguard Dividend Appreciation ETF | 0,02 | 1,98 | 4,58 | 7,59 | 0,5582 | -0,4823 | |||
| HON / Honeywell International Inc. | 0,02 | 1,66 | 4,53 | 11,82 | 1,0218 | 0,0316 | |||
| WM / Waste Management, Inc. | 0,02 | 0,36 | 4,45 | -0,83 | 0,5416 | -0,5535 | |||
| SPGI / S&P Global Inc. | 0,01 | -1,39 | 4,27 | 2,33 | 0,5197 | -0,4988 | |||
| VTI / Vanguard Index Funds - Vanguard Total Stock Market ETF | 0,01 | 7,79 | 4,06 | 19,21 | 0,4945 | -0,3376 | |||
| SHW / The Sherwin-Williams Company | 0,01 | -0,25 | 3,77 | -1,92 | 0,4596 | -0,4802 | |||
| MMC / Marsh & McLennan Companies, Inc. | 0,02 | -1,57 | 3,72 | -11,80 | 0,4533 | -0,5777 | |||
| LMT / Lockheed Martin Corporation | 0,01 | 0,09 | 3,68 | 3,75 | 0,4488 | -0,4186 | |||
| RSP / Invesco Exchange-Traded Fund Trust - Invesco S&P 500 Equal Weight ETF | 0,02 | 0,00 | 3,62 | 4,93 | 0,4412 | -0,4022 | |||
| PCAR / PACCAR Inc | 0,04 | 1,84 | 3,54 | -0,56 | 0,4312 | -0,4386 | |||
| HCA / HCA Healthcare, Inc. | 0,01 | 0,75 | 3,49 | 11,72 | 0,4252 | -0,3383 | |||
| BRK.B / Berkshire Hathaway Inc. | 0,01 | -0,17 | 3,40 | -8,94 | 0,4145 | -0,4985 | |||
| VRTX / Vertex Pharmaceuticals Incorporated | 0,01 | -0,79 | 3,25 | -8,90 | 0,7320 | -0,1386 | |||
| CTAS / Cintas Corporation | 0,01 | 2,73 | 2,98 | 11,36 | 0,3633 | -0,2908 | |||
| ALL / The Allstate Corporation | 0,01 | 2,41 | 2,95 | -0,44 | 0,3594 | -0,3646 | |||
| LHX / L3Harris Technologies, Inc. | 0,01 | -5,75 | 2,71 | 12,95 | 0,3304 | -0,2563 | |||
| LEN / Lennar Corporation | 0,02 | 0,11 | 2,67 | -3,51 | 0,3253 | -0,3510 | |||
| SCHD / Schwab Strategic Trust - Schwab U.S. Dividend Equity ETF | 0,08 | 0,00 | 2,18 | -5,25 | 0,2662 | -0,2971 | |||
| ITW / Illinois Tool Works Inc. | 0,01 | -4,78 | 2,16 | -5,09 | 0,2635 | -0,2932 | |||
| SCHB / Schwab Strategic Trust - Schwab U.S. Broad Market ETF | 0,08 | 0,00 | 1,95 | 10,66 | 0,2379 | -0,1932 | |||
| JNJ / Johnson & Johnson | 0,01 | -4,39 | 1,85 | -11,94 | 0,4177 | -0,0962 | |||
| MUB / iShares Trust - iShares National Muni Bond ETF | 0,01 | -7,24 | 1,48 | -8,10 | 0,1798 | -0,2125 | |||
| AEP / American Electric Power Company, Inc. | 0,01 | -0,42 | 1,43 | -5,47 | 0,1748 | -0,1960 | |||
| VOE / Vanguard Index Funds - Vanguard Mid-Cap Value ETF | 0,01 | 0,00 | 1,31 | 2,42 | 0,1598 | -0,1530 | |||
| XLK / The Select Sector SPDR Trust - The Technology Select Sector SPDR Fund | 0,01 | -8,85 | 1,27 | 11,81 | 0,1547 | -0,1228 | |||
| MRK / Merck & Co., Inc. | 0,01 | -8,40 | 1,13 | -19,21 | 0,2551 | -0,0871 | |||
| APH / Amphenol Corporation | 0,01 | -0,31 | 1,08 | 50,21 | 0,2430 | 0,0676 | |||
| MDY / SPDR S&P MidCap 400 ETF Trust | 0,00 | -1,02 | 1,05 | 5,12 | 0,1276 | -0,1159 | |||
| VLO / Valero Energy Corporation | 0,01 | -9,15 | 1,02 | -7,54 | 0,1241 | -0,1451 | |||
| VBR / Vanguard Index Funds - Vanguard Small-Cap Value ETF | 0,01 | 0,00 | 1,01 | 4,76 | 0,1234 | -0,1131 | |||
| ARCC / Ares Capital Corporation | 0,05 | 0,00 | 1,01 | -0,88 | 0,1231 | -0,1260 | |||
| PSX / Phillips 66 | 0,01 | -2,75 | 1,00 | -6,11 | 0,1218 | -0,1382 | |||
| GS / The Goldman Sachs Group, Inc. | 0,00 | 0,00 | 0,90 | 29,68 | 0,1097 | -0,0601 | |||
| VXUS / Vanguard STAR Funds - Vanguard Total International Stock ETF | 0,01 | 0,00 | 0,90 | 11,28 | 0,1094 | -0,0878 | |||
| EQIX / Equinix, Inc. | 0,00 | -12,57 | 0,86 | -14,64 | 0,1051 | -0,1421 | |||
| HIG / The Hartford Insurance Group, Inc. | 0,01 | -2,54 | 0,86 | -0,12 | 0,1042 | -0,1050 | |||
| C / Citigroup Inc. | 0,01 | -3,64 | 0,83 | 15,60 | 0,1011 | -0,0744 | |||
| EA / Electronic Arts Inc. | 0,01 | -18,26 | 0,83 | -9,64 | 0,1006 | -0,1227 | |||
| VYM / Vanguard Whitehall Funds - Vanguard High Dividend Yield ETF | 0,01 | 0,00 | 0,81 | 3,43 | 0,0992 | -0,0932 | |||
| IVV / iShares Trust - iShares Core S&P 500 ETF | 0,00 | 0,00 | 0,79 | 10,38 | 0,0960 | -0,0782 | |||
| CVX / Chevron Corporation | 0,01 | -5,22 | 0,78 | -18,94 | 0,0950 | -0,1399 | |||
| VIGI / Vanguard Whitehall Funds - Vanguard International Dividend Appreciation ETF | 0,01 | 0,00 | 0,78 | 8,68 | 0,1751 | 0,0005 | |||
| KO / The Coca-Cola Company | 0,01 | 3,70 | 0,78 | 2,51 | 0,0944 | -0,0905 | |||
| VZ / Verizon Communications Inc. | 0,02 | -16,28 | 0,77 | -20,14 | 0,1744 | -0,0622 | |||
| VOO / Vanguard Index Funds - Vanguard S&P 500 ETF | 0,00 | 0,00 | 0,71 | 10,58 | 0,0866 | -0,0706 | |||
| APD / Air Products and Chemicals, Inc. | 0,00 | -9,89 | 0,71 | -13,75 | 0,0864 | -0,1147 | |||
| MSI / Motorola Solutions, Inc. | 0,00 | -20,61 | 0,70 | -23,77 | 0,0852 | -0,1390 | |||
| HTD / John Hancock Tax-Advantaged Dividend Income Fund | 0,03 | 0,00 | 0,65 | -2,26 | 0,0792 | -0,0833 | |||
| WPC / W. P. Carey Inc. | 0,01 | 0,00 | 0,64 | -1,23 | 0,1449 | -0,0139 | |||
| RTX / RTX Corporation | 0,00 | 0,40 | 0,63 | 10,60 | 0,0763 | -0,0620 | |||
| VYMI / Vanguard Whitehall Funds - Vanguard International High Dividend Yield ETF | 0,01 | 0,00 | 0,57 | 8,75 | 0,1291 | 0,0004 | |||
| HTGC / Hercules Capital, Inc. | 0,03 | 0,00 | 0,53 | -4,81 | 0,0651 | -0,0721 | |||
| VNQI / Vanguard International Equity Index Funds - Vanguard Global ex-U.S. Real Estate ETF | 0,01 | 0,00 | 0,53 | 14,10 | 0,0641 | -0,0486 | |||
| CCI / Crown Castle Inc. | 0,01 | -1,62 | 0,52 | -3,00 | 0,1168 | -0,0137 | |||
| ADP / Automatic Data Processing, Inc. | 0,00 | -8,20 | 0,49 | -7,43 | 0,0593 | -0,0690 | |||
| VIVA.X / Vanguard Index Funds - Vanguard Value ETF | 0,00 | 0,00 | 0,48 | 2,36 | 0,0583 | -0,0560 | |||
| NSC / Norfolk Southern Corporation | 0,00 | -13,12 | 0,47 | -5,99 | 0,0574 | -0,0652 | |||
| VXF / Vanguard Index Funds - Vanguard Extended Market ETF | 0,00 | 0,00 | 0,43 | 12,01 | 0,0523 | -0,0415 | |||
| PEP / PepsiCo, Inc. | 0,00 | 0,00 | 0,42 | -11,92 | 0,0513 | -0,0656 | |||
| KMB / Kimberly-Clark Corporation | 0,00 | -9,28 | 0,42 | -17,84 | 0,0511 | -0,0736 | |||
| MPC / Marathon Petroleum Corporation | 0,00 | 0,00 | 0,42 | 13,93 | 0,0509 | -0,0386 | |||
| GILD / Gilead Sciences, Inc. | 0,00 | -7,14 | 0,40 | -8,12 | 0,0895 | -0,0160 | |||
| VB / Vanguard Index Funds - Vanguard Small-Cap ETF | 0,00 | -3,00 | 0,39 | 3,72 | 0,0476 | -0,0445 | |||
| BDX / Becton, Dickinson and Company | 0,00 | -15,09 | 0,39 | -36,24 | 0,0472 | -0,1011 | |||
| VO / Vanguard Index Funds - Vanguard Mid-Cap ETF | 0,00 | 0,00 | 0,39 | 8,12 | 0,0471 | -0,0402 | |||
| SCHA / Schwab Strategic Trust - Schwab U.S. Small-Cap ETF | 0,02 | 0,00 | 0,38 | 7,87 | 0,0468 | -0,0402 | |||
| SYY / Sysco Corporation | 0,01 | 3,04 | 0,38 | 4,07 | 0,0468 | -0,0435 | |||
| WELL / Welltower Inc. | 0,00 | 0,00 | 0,38 | 0,27 | 0,0460 | -0,0459 | |||
| GLD / SPDR Gold Trust | 0,00 | 0,00 | 0,37 | 5,75 | 0,0832 | -0,0020 | |||
| FI / Fiserv, Inc. | 0,00 | -5,23 | 0,31 | -26,07 | 0,0704 | -0,0327 | |||
| LH / Labcorp Holdings Inc. | 0,00 | -21,77 | 0,30 | -11,76 | 0,0366 | -0,0465 | |||
| TSLA / Tesla, Inc. | 0,00 | -1,57 | 0,30 | 20,73 | 0,0672 | 0,0068 | |||
| EMN / Eastman Chemical Company | 0,00 | -14,18 | 0,30 | -27,38 | 0,0363 | -0,0638 | |||
| GOOGL / Alphabet Inc. | 0,00 | -1,53 | 0,29 | 12,21 | 0,0664 | 0,0023 | |||
| VSS / Vanguard International Equity Index Funds - Vanguard FTSE All-World ex-US Small-Cap ETF | 0,00 | 0,00 | 0,28 | 16,53 | 0,0344 | -0,0249 | |||
| COP / ConocoPhillips | 0,00 | -5,00 | 0,28 | -18,79 | 0,0634 | -0,0212 | |||
| BBY / Best Buy Co., Inc. | 0,00 | -9,76 | 0,27 | -17,68 | 0,0330 | -0,0474 | |||
| CLX / The Clorox Company | 0,00 | -9,07 | 0,27 | -25,90 | 0,0608 | -0,0281 | |||
| SBCF / Seacoast Banking Corporation of Florida | 0,01 | -12,13 | 0,27 | -5,67 | 0,0601 | -0,0089 | |||
| LOW / Lowe's Companies, Inc. | 0,00 | -1,18 | 0,26 | -6,14 | 0,0318 | -0,0360 | |||
| CSCO / Cisco Systems, Inc. | 0,00 | 0,00 | 0,25 | 12,50 | 0,0308 | -0,0241 | |||
| SCHM / Schwab Strategic Trust - Schwab U.S. Mid-Cap ETF | 0,01 | 0,00 | 0,25 | 7,23 | 0,0308 | -0,0269 | |||
| TMO / Thermo Fisher Scientific Inc. | 0,00 | -12,36 | 0,25 | -28,57 | 0,0305 | -0,0551 | |||
| GOOD / Gladstone Commercial Corporation | 0,02 | 0,00 | 0,24 | -4,44 | 0,0290 | -0,0318 | |||
| CAG / Conagra Brands, Inc. | 0,01 | -9,52 | 0,24 | -30,50 | 0,0289 | -0,0545 | |||
| PSA / Public Storage | 0,00 | -25,56 | 0,22 | -27,04 | 0,0274 | -0,0479 | |||
| RQI / Cohen & Steers Quality Income Realty Fund, Inc. | 0,02 | 0,00 | 0,22 | -0,90 | 0,0268 | -0,0274 | |||
| TYG / Tortoise Energy Infrastructure Corporation | 0,00 | 0,00 | 0,21 | 1,90 | 0,0262 | -0,0253 | |||
| IVW / iShares Trust - iShares S&P 500 Growth ETF | 0,00 | 0,21 | 0,0261 | 0,0261 | |||||
| DIS / The Walt Disney Company | 0,00 | 0,21 | 0,0470 | 0,0470 | |||||
| NML / Neuberger Berman Energy Infrastructure and Income Fund Inc. | 0,02 | 0,00 | 0,16 | 0,00 | 0,0192 | -0,0193 | |||
| KYN / Kayne Anderson Energy Infrastructure Fund, Inc. | 0,01 | 0,00 | 0,13 | -0,75 | 0,0161 | -0,0165 | |||
| PSEC / Prospect Capital Corporation | 0,02 | 0,00 | 0,05 | -22,58 | 0,0059 | -0,0094 | |||
| SVC / Service Properties Trust | 0,02 | 0,00 | 0,04 | -7,50 | 0,0046 | -0,0054 | |||
| BMY / Bristol-Myers Squibb Company | 0,00 | -100,00 | 0,00 | 0,0000 | |||||
| UNH / UnitedHealth Group Incorporated | 0,00 | -100,00 | 0,00 | 0,0000 |