Grundlæggende statistik
| Institutionelle ejere | 202 total, 199 long only, 0 short only, 3 long/short - change of -49,25% MRQ |
| Gennemsnitlig porteføljeallokering | 0.3502 % - change of 194,75% MRQ |
| Institutionelle aktier (lange) | 113.286.091 (ex 13D/G) - change of -2,60MM shares -2,24% MRQ |
| Institutionel værdi (lang) | $ 1.578.377 USD ($1000) |
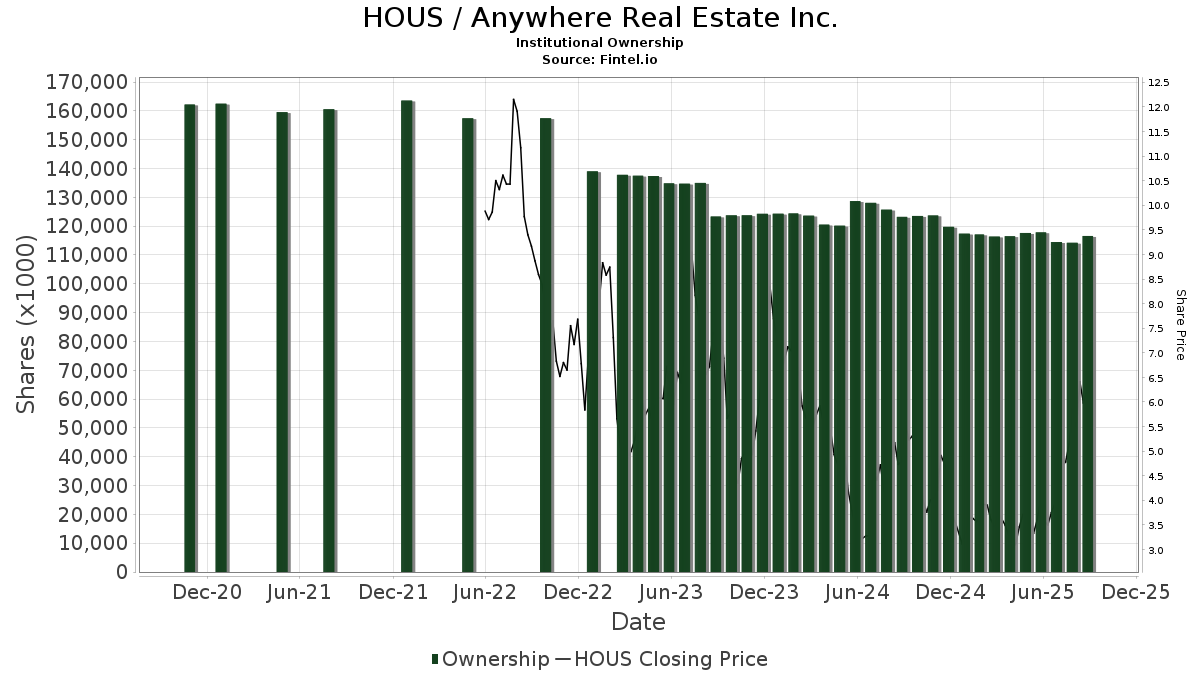
Institutionelt ejerskab og aktionærer
Anywhere Real Estate Inc. (US:HOUS) har 202 institutionelle ejere og aktionærer, der har indsendt 13D/G- eller 13F-formularer til Securities Exchange Commission (SEC). Disse institutioner har i alt 113,286,091 aktier. Største aktionærer omfatter Vanguard Group Inc, Angelo Gordon & Co., L.p., BlackRock, Inc., Dimensional Fund Advisors Lp, Nomura Holdings Inc, Charles Schwab Investment Management Inc, Magnetar Financial LLC, Alliancebernstein L.p., D. E. Shaw & Co., Inc., and Goldman Sachs Group Inc .
Anywhere Real Estate Inc. (NYSE:HOUS) institutionel ejerskabsstruktur viser aktuelle positioner i virksomheden efter institutioner og fonde, samt seneste ændringer i positionsstørrelse. Større aktionærer kan omfatte individuelle investorer, investeringsforeninger, hedgefonde eller institutioner. Skema 13D angiver, at investoren besidder (eller besidder) mere end 5 % af virksomheden og har til hensigt (eller har til hensigt at) aktivt at forfølge en ændring i forretningsstrategi. Skema 13G indikerer en passiv investering på over 5%.
The share price as of January 9, 2026 is 0,00 / share. Previously, on March 31, 2025, the share price was 3,33 / share. This represents a decline of 100,00% over that period.
Fondens stemningsscore
Fund Sentiment Score (fka Ownership Accumulation Score) finder de aktier, der bliver mest købt af fonde. Det er resultatet af en sofistikeret, multi-faktor kvantitativ model, der identificerer virksomheder med de højeste niveauer af institutionel akkumulering. Scoringsmodellen bruger en kombination af den samlede stigning i oplyste ejere, ændringerne i porteføljeallokeringer i disse ejere og andre målinger. Tallet går fra 0 til 100, hvor højere tal indikerer et højere niveau af akkumulering for sine jævnaldrende, og 50 er gennemsnittet.
Opdateringsfrekvens: Dagligt
Se Ownership Explorer, som giver en liste over højest rangerende virksomheder.
AI+ Ask Fintel’s AI assistant about Anywhere Real Estate Inc..
Select a question to share a public post with an AI-crafted answer.
Thinking of good questions…
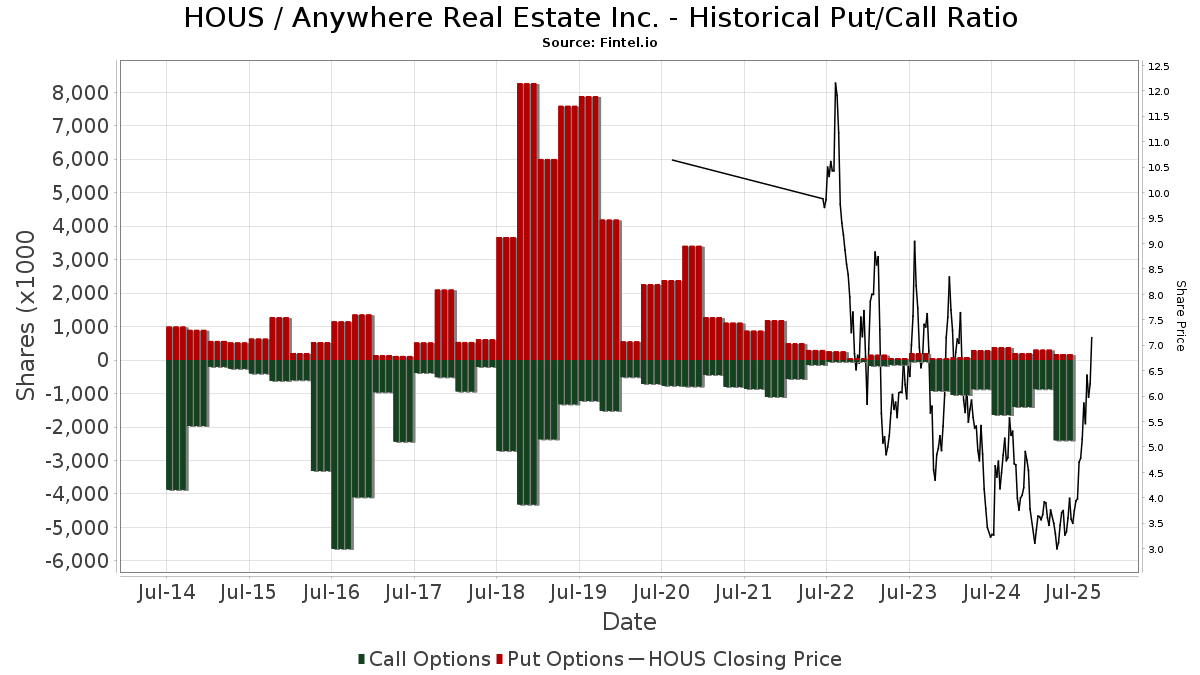
Institutionel Put/Call-forhold
Ud over at indberette standardaktie- og gældsudstedelser skal institutter med mere end 100 mill. aktiver under forvaltning også oplyse deres put- og call-optionsbeholdninger. Da salgsoptioner generelt indikerer negativ stemning, og købsoptioner indikerer positiv stemning, kan vi få en fornemmelse af den overordnede institutionelle stemning ved at plotte forholdet mellem put og kald. Diagrammet til højre viser det historiske put/call-forhold for dette instrument.
Brug af Put/Call Ratio som en indikator for investorernes stemning overvinder en af de vigtigste mangler ved at bruge totalt institutionelt ejerskab, som er, at en betydelig mængde af aktiver under forvaltning investeres passivt for at spore indekser. Passivt forvaltede fonde køber typisk ikke optioner, så indikatoren for put/call-forholdet følger mere nøje følelsen af aktivt forvaltede fonde.
13D/G-arkivering
Vi præsenterer 13D/G ansøgninger separat fra 13F ansøgninger på grund af den forskellige behandling af SEC. 13D/G-ansøgninger kan indgives af grupper af investorer (med én ledende), hvorimod 13F-ansøgninger ikke kan. Dette resulterer i situationer, hvor en investor kan indsende en 13D/G, der rapporterer én værdi for de samlede aktier (der repræsenterer alle de aktier, der ejes af investorgruppen), men derefter indsender en 13F, der rapporterer en anden værdi for de samlede aktier (der udelukkende repræsenterer deres egne) ejendomsret). Det betyder, at aktieejerskab af 13D/G-arkiver og 13F-arkiveringer ofte ikke er direkte sammenlignelige, så vi præsenterer dem separat.
Bemærk: Fra den 16. maj 2021 viser vi ikke længere ejere, der ikke har indsendt en 13D/G inden for det seneste år. Tidligere viste vi den fulde historie af 13D/G-arkiver. Generelt skal enheder, der er forpligtet til at indgive 13D/G-ansøgninger, indgive mindst årligt, før de indsender en afsluttende ansøgning. Dog forlader fonde nogle gange positioner uden at indsende en afsluttende ansøgning (dvs. de afvikler), så visning af den fulde historie resulterede nogle gange i forvirring om det nuværende ejerskab. For at undgå forvirring viser vi nu kun 'aktuelle' ejere - det vil sige - ejere, der har anmeldt inden for det seneste år.
Upgrade to unlock premium data.
| Fil dato | Form | Investor | Forrige Aktier |
Seneste Aktier |
Δ Aktier (Procent) |
Ejendomsret (Procent) |
Δ Ejerskab (Procent) |
|
|---|---|---|---|---|---|---|---|---|
| 2026-01-13 | TPG GP A, LLC | 9,692,993 | 0 | -100.00 | 0.00 | -100.00 | ||
| 2025-11-14 | D. E. SHAW & CO, L.P. | 5,603,088 | 5,164,061 | -7.84 | 4.60 | -8.00 | ||
| 2025-08-14 | NOMURA HOLDINGS INC | 7,101,590 | 5,953,281 | -16.17 | 5.30 | -17.19 | ||
| 2025-04-24 | BlackRock, Inc. | 11,305,507 | 7,478,452 | -33.85 | 6.70 | -34.31 | ||
| 2025-03-21 | BARCLAYS PLC | 6,219,718 | 6,219,718 | 0.00 | 5.59 | 0.00 |
13F og NPORT arkivering
Detaljer om 13F-arkivering er gratis. Detaljer om NP-ansøgninger kræver et premium-medlemskab. Grønne rækker angiver nye positioner. Røde rækker angiver lukkede positioner. Klik på linket ikon for at se den fulde transaktionshistorik.
Opgrader
for at låse premium-data op og eksportere til Excel ![]() .
.
| Fil dato | Kilde | Investor | Type | Gennemsnitlig pris (Øst) |
Aktier | Δ Aktier (%) |
Rapporteret Værdi ($1000) |
Δ Værdi (%) |
Port Alloc (%) |
|
|---|---|---|---|---|---|---|---|---|---|---|
| 2025-11-13 | 13F | Dynamic Technology Lab Private Ltd | 0 | -100,00 | 0 | |||||
| 2025-11-13 | 13F | Nemes Rush Group LLC | 0 | -100,00 | 0 | -100,00 | ||||
| 2026-02-17 | 13F | Prelude Capital Management, Llc | 257.357 | 112,20 | 3.644 | 183,80 | ||||
| 2025-11-21 | 13F/A | CIBC Bancorp USA Inc. | 411.250 | 4.355 | ||||||
| 2026-02-17 | 13F | Occudo Quantitative Strategies Lp | 0 | -100,00 | 0 | |||||
| 2025-11-14 | 13F | Numerai GP LLC | 0 | -100,00 | 0 | -100,00 | ||||
| 2026-02-09 | 13F | Catalyst Funds Management Pty Ltd | 0 | -100,00 | 0 | |||||
| 2026-01-29 | 13F | Pictet Asset Management Holding SA | 16.084 | 228 | ||||||
| 2026-02-17 | 13F | Lombard Odier Asset Management (USA) Corp | Call | 0 | -100,00 | 0 | ||||
| 2026-01-29 | 13F | Quent Capital, LLC | 751 | 0,00 | 11 | 42,86 | ||||
| 2026-02-12 | 13F | Mint Tower Capital Management B.V. | 25.000 | 0,00 | 0 | |||||
| 2026-02-12 | 13F | Quadrant Capital Group Llc | 280 | 141,38 | 4 | 200,00 | ||||
| 2026-02-12 | 13F | MetLife Investment Management, LLC | 56.951 | 12,72 | 806 | 50,65 | ||||
| 2026-02-13 | 13F | Verition Fund Management LLC | 468.766 | 11,21 | 6.638 | 48,71 | ||||
| 2026-01-27 | 13F | Institute for Wealth Management, LLC. | 50.000 | 0,00 | 708 | 33,84 | ||||
| 2026-02-23 | 13F | Virtu Financial LLC | 155.351 | 2 | ||||||
| 2026-02-17 | 13F | Nomura Holdings Inc | 5.738.624 | 2,73 | 81.259 | 37,36 | ||||
| 2026-02-05 | 13F | Amalgamated Bank | 3.316 | -9,74 | 0 | |||||
| 2026-02-12 | 13F | Federated Hermes, Inc. | 1.916 | 27 | ||||||
| 2026-02-13 | 13F | Neuberger Berman Group LLC | 0 | -100,00 | 0 | |||||
| 2026-02-13 | 13F | Charles Schwab Investment Management Inc | 5.038.709 | 9,44 | 71.348 | 46,33 | ||||
| 2026-02-13 | 13F | Ubs Asset Management Americas Inc | 128.685 | 1.822 | ||||||
| 2026-02-17 | 13F | Bank Of America Corp /de/ | 230.277 | -62,33 | 3.261 | -49,64 | ||||
| 2026-02-11 | 13F | Allianz Asset Management GmbH | 810.118 | 207,26 | 11.471 | 310,85 | ||||
| 2026-02-13 | 13F | Wells Fargo & Company/mn | 123.876 | 48,95 | 1.754 | 99,32 | ||||
| 2025-11-14 | 13F | Paloma Partners Management Co | Call | 0 | -100,00 | 0 | ||||
| 2026-02-10 | 13F | Bank of New York Mellon Corp | 379.840 | 6,89 | 5.379 | 42,92 | ||||
| 2026-02-12 | 13F | Penserra Capital Management LLC | 17.089 | -73,47 | 0 | |||||
| 2025-11-21 | 13F | Nebula Research & Development LLC | 0 | -100,00 | 0 | |||||
| 2026-02-17 | 13F | Canyon Capital Advisors Llc | 926.699 | 5,62 | 13.122 | 41,23 | ||||
| 2025-10-27 | 13F | First Horizon Corp | 0 | -100,00 | 0 | |||||
| 2026-02-03 | 13F | Ballentine Partners, LLC | 14.823 | 3,77 | 210 | 38,41 | ||||
| 2026-02-13 | 13F | Marshall Wace, Llp | 0 | -100,00 | 0 | |||||
| 2026-02-13 | 13F | Pinnacle Wealth Planning Services, Inc. | 119 | 2 | ||||||
| 2026-02-12 | 13F | Hrt Financial Lp | 167.341 | 2 | ||||||
| 2026-02-17 | 13F | Public Employees Retirement System Of Ohio | 18.476 | -19,26 | 262 | 7,85 | ||||
| 2026-02-17 | 13F | Taconic Capital Advisors LP | 412.400 | 5.840 | ||||||
| 2025-11-13 | 13F | EntryPoint Capital, LLC | 0 | -100,00 | 0 | |||||
| 2026-02-11 | 13F | Deutsche Bank Ag\ | 248.348 | -23,09 | 3.517 | 2,84 | ||||
| 2026-02-09 | 13F | Legal & General Group Plc | 145.024 | 311,81 | 2.054 | 451,88 | ||||
| 2026-02-10 | 13F | Bnp Paribas Arbitrage, Sa | 23.330 | -23,04 | 330 | 2,80 | ||||
| 2026-02-09 | 13F | Geode Capital Management, Llc | 2.628.895 | 0,69 | 37.231 | 34,63 | ||||
| 2026-02-11 | 13F | Simplex Trading, Llc | 0 | -100,00 | 0 | |||||
| 2026-02-02 | 13F | Allegheny Financial Group LTD | 0 | -100,00 | 0 | |||||
| 2026-02-17 | 13F | Saba Capital Management, L.P. | 75.000 | -75,78 | 1.062 | -67,61 | ||||
| 2026-02-12 | 13F | Bank Of Montreal /can/ | 128.365 | 0,84 | 1.818 | 34,79 | ||||
| 2026-01-29 | 13F | Riverbend Wealth Management, LLC | 11.352 | 0,00 | 161 | 33,33 | ||||
| 2026-02-06 | 13F | Covestor Ltd | 581 | -57,06 | 0 | |||||
| 2026-02-17 | 13F | Tower Research Capital LLC (TRC) | 11.124 | 162,85 | 158 | 256,82 | ||||
| 2025-10-15 | 13F | Harbor Capital Advisors, Inc. | 0 | -100,00 | 0 | |||||
| 2025-11-14 | 13F | Point72 Asia (Singapore) Pte. Ltd. | 14.311 | 152 | ||||||
| 2026-02-13 | 13F | State Street Corp | 2.381.820 | 7,70 | 33.727 | 44,01 | ||||
| 2025-11-14 | 13F | Cubist Systematic Strategies, LLC | Call | 13.900 | 147 | |||||
| 2025-11-14 | 13F | Cubist Systematic Strategies, LLC | 16.948 | -88,19 | 179 | -65,51 | ||||
| 2026-02-17 | 13F | State Of Wisconsin Investment Board | 60.950 | -82,05 | 863 | -76,00 | ||||
| 2026-02-06 | 13F | Pnc Financial Services Group, Inc. | 1.373 | -3,51 | 19 | 26,67 | ||||
| 2026-02-11 | 13F | Franklin Resources Inc | 181.900 | -76,29 | 2.576 | -68,31 | ||||
| 2026-02-17 | 13F | Greenland Capital Management LP | 16.000 | -68,00 | 227 | -57,28 | ||||
| 2025-11-12 | 13F | American Century Companies Inc | 0 | -100,00 | 0 | -100,00 | ||||
| 2026-02-05 | 13F | Dana Investment Advisors, Inc. | 641.078 | -31,71 | 9.078 | -8,69 | ||||
| 2026-02-17 | 13F | Two Sigma Advisers, Lp | 60.000 | -47,90 | 850 | -30,35 | ||||
| 2025-11-14 | 13F | Walleye Capital LLC | 0 | -100,00 | 0 | |||||
| 2026-01-23 | 13F | Transcend Wealth Collective, Llc | 200.238 | 0,00 | 2.835 | 33,73 | ||||
| 2025-11-14 | 13F | Walleye Capital LLC | Put | 0 | -100,00 | 0 | ||||
| 2026-02-17 | 13F | Whitebox Advisors Llc | 347.880 | -32,17 | 4.926 | -9,32 | ||||
| 2026-01-22 | 13F | Financial Consulate, Inc | 33 | 0 | ||||||
| 2026-01-26 | 13F | Cwm, Llc | 33.844 | 0,14 | 0 | |||||
| 2026-02-12 | 13F | Towle & Co | 1.135.724 | -6,48 | 16.082 | 25,05 | ||||
| 2026-02-13 | 13F | Healthcare Of Ontario Pension Plan Trust Fund | 984.120 | 13.935 | ||||||
| 2026-02-12 | 13F | Senvest Management, LLC | 2.991.223 | 42.356 | ||||||
| 2026-02-17 | 13F | Parallax Volatility Advisers, L.P. | 0 | -100,00 | 0 | |||||
| 2026-02-17 | 13F | Parallax Volatility Advisers, L.P. | Call | 0 | -100,00 | 0 | ||||
| 2026-02-17 | 13F | TIG Advisors, LLC | 0 | -100,00 | 0 | -100,00 | ||||
| 2026-02-17 | 13F | Two Sigma Securities, Llc | 0 | -100,00 | 0 | |||||
| 2026-02-17 | 13F | Man Group plc | 777.390 | -22,26 | 11.008 | 3,94 | ||||
| 2026-02-03 | 13F | Credit Industriel Et Commercial | 450.000 | 6.372 | ||||||
| 2026-01-29 | 13F | Vanguard Group Inc | 9.698.928 | -1,13 | 137.337 | 32,20 | ||||
| 2025-11-06 | 13F | Whipplewood Advisors, LLC | 0 | -100,00 | 0 | |||||
| 2026-02-13 | 13F | Squarepoint Ops LLC | 987.285 | 223,16 | 13.980 | 332,12 | ||||
| 2025-11-07 | 13F | Readystate Asset Management Lp | 0 | -100,00 | 0 | |||||
| 2026-02-13 | 13F/A | Texas Permanent School Fund | 0 | -100,00 | 0 | |||||
| 2026-02-11 | 13F | Group One Trading, L.p. | 19.947 | 282 | ||||||
| 2025-11-14 | 13F | Capstone Investment Advisors, Llc | 21.442 | -78,57 | 227 | -37,29 | ||||
| 2026-02-13 | 13F | FJ Capital Management LLC | 0 | -100,00 | 0 | |||||
| 2026-02-17 | 13F | SummitTX Capital, L.P. | 0 | -100,00 | 0 | |||||
| 2026-02-06 | 13F | IFP Advisors, Inc | 250 | -2,34 | 4 | 50,00 | ||||
| 2026-03-20 | 13F | Purpose Unlimited Inc. | 110.000 | 1.558 | ||||||
| 2026-01-29 | 13F | Calamos Advisors LLC | 2.000.000 | 526,75 | 28.320 | 738,12 | ||||
| 2026-02-13 | 13F | Ieq Capital, Llc | 25.881 | -34,69 | 366 | -12,65 | ||||
| 2026-02-06 | 13F | Gsa Capital Partners Llp | 0 | -100,00 | 0 | |||||
| 2026-02-13 | 13F | Barclays Plc | 200.197 | -86,07 | 2.835 | -61,17 | ||||
| 2026-02-17 | 13F | Voloridge Investment Management, Llc | 0 | -100,00 | 0 | |||||
| 2026-02-17 | 13F | Sixth Street Partners Management Company, L.P. | 0 | -100,00 | 0 | |||||
| 2026-01-28 | 13F | Teacher Retirement System Of Texas | 14.141 | 200 | ||||||
| 2026-02-10 | 13F | State of Wyoming | 0 | -100,00 | 0 | |||||
| 2026-02-14 | 13F | Rockefeller Capital Management L.P. | 534 | 256,00 | 8 | 600,00 | ||||
| 2026-02-17 | 13F | Janus Henderson Group Plc | 45.700 | 646 | ||||||
| 2026-02-13 | 13F | Financial Network Wealth Advisors LLC | 469 | 0,00 | 7 | 50,00 | ||||
| 2025-11-14 | 13F | Point72 Europe (London) LLP | 763 | 8 | ||||||
| 2026-02-11 | 13F | Jpmorgan Chase & Co | 245.833 | -10,59 | 3.481 | 19,55 | ||||
| 2026-02-17 | 13F | Keebeck Alpha, LP | 100.705 | 112,69 | 1.426 | 184,43 | ||||
| 2026-02-13 | 13F | Morgan Stanley | 642.816 | 180,28 | 9.102 | 274,88 | ||||
| 2025-11-13 | 13F | Quinn Opportunity Partners LLC | 0 | -100,00 | 0 | |||||
| 2026-02-13 | 13F | Panagora Asset Management Inc | 0 | -100,00 | 0 | |||||
| 2025-11-14 | 13F | Union Square Park Capital Management, LLC | 0 | -100,00 | 0 | -100,00 | ||||
| 2026-02-13 | 13F | Landscape Capital Management, L.l.c. | 0 | -100,00 | 0 | |||||
| 2026-02-13 | 13F | Martingale Asset Management L P | 0 | -100,00 | 0 | |||||
| 2026-01-28 | 13F | N.E.W. Advisory Services LLC | 1.375 | 0,00 | 19 | 35,71 | ||||
| 2026-02-17 | 13F | Creative Planning | 43.988 | 30,65 | 623 | 74,72 | ||||
| 2026-02-13 | 13F | Gator Capital Management, LLC | 2.311.110 | -9,86 | 32.725 | 20,53 | ||||
| 2026-02-17 | 13F | Susquehanna International Group, Llp | Put | 10.400 | -88,99 | 147 | -85,30 | |||
| 2026-02-17 | 13F | Susquehanna International Group, Llp | Call | 114.200 | -74,33 | 1.617 | -65,68 | |||
| 2026-02-17 | 13F | Bridgeway Capital Management Inc | 717.817 | -29,47 | 10.164 | -5,70 | ||||
| 2026-02-17 | 13F | Susquehanna International Group, Llp | 55.432 | -92,10 | 785 | -89,45 | ||||
| 2026-02-06 | 13F | EverSource Wealth Advisors, LLC | 5.210 | 0,00 | 74 | 32,73 | ||||
| 2025-10-30 | 13F | Twin Peaks Wealth Advisors, LLC | 0 | -100,00 | 0 | |||||
| 2026-02-02 | 13F | Strs Ohio | 18.600 | -3,63 | 263 | 28,92 | ||||
| 2026-02-17 | 13F | Cetera Investment Advisers | 10.223 | -70,19 | 145 | -60,33 | ||||
| 2026-02-13 | 13F | Intrepid Financial Planning Group LLC | 10.000 | 0,00 | 142 | 34,29 | ||||
| 2026-02-17 | 13F | Advisor Group Holdings, Inc. | 321 | -77,46 | 5 | -55,56 | ||||
| 2025-11-14 | 13F | Point72 (DIFC) Ltd | 4.410 | -44,39 | 47 | 64,29 | ||||
| 2026-02-13 | 13F | Police & Firemen's Retirement System of New Jersey | 26.852 | -11,17 | 380 | 18,75 | ||||
| 2026-02-13 | 13F | Kilter Group LLC | 0 | -100,00 | 0 | |||||
| 2026-03-12 | 13F/A | Peak6 Llc | Call | 0 | -100,00 | 0 | -100,00 | |||
| 2025-11-14 | 13F | Wolverine Trading, Llc | Call | 109.800 | 1.201 | |||||
| 2025-11-14 | 13F | Wolverine Trading, Llc | Put | 10.000 | 109 | |||||
| 2026-02-17 | 13F | Lazard Asset Management Llc | 0 | -100,00 | 0 | |||||
| 2026-02-12 | 13F | BlackRock, Inc. | 8.646.051 | -11,41 | 122.428 | 18,46 | ||||
| 2025-10-20 | 13F | Los Angeles Capital Management Llc | 0 | -100,00 | 0 | -100,00 | ||||
| 2026-02-13 | 13F | Bridgewater Associates, LP | 213.691 | 189,39 | 3.026 | 287,32 | ||||
| 2026-01-29 | 13F | Comerica Bank | 227 | 0,00 | 3 | 50,00 | ||||
| 2026-02-13 | 13F | Hudson Bay Capital Management LP | 0 | -100,00 | 0 | |||||
| 2026-02-17 | 13F | Alliancebernstein L.p. | 3.488.671 | 113,26 | 49.400 | 185,16 | ||||
| 2026-02-17 | 13F | Omni Event Management Ltd | 1.910.543 | 306,50 | 27.053 | 443,56 | ||||
| 2025-11-14 | 13F | Northwestern Mutual Wealth Management Co | 0 | -100,00 | 0 | |||||
| 2026-02-05 | 13F | New York Life Investment Management Llc | 709.781 | 10.050 | ||||||
| 2026-02-12 | 13F | Dimensional Fund Advisors Lp | 6.241.641 | 5,28 | 88.382 | 40,76 | ||||
| 2025-10-17 | 13F | Fortitude Family Office, LLC | 0 | -100,00 | 0 | |||||
| 2026-02-10 | 13F | Acadian Asset Management Llc | 11.476 | 0,00 | 0 | |||||
| 2026-02-26 | 13F | TD Capital Management LLC | 1.709 | 0,00 | 24 | 33,33 | ||||
| 2026-02-11 | 13F | CenterBook Partners LP | 387.940 | 5.493 | ||||||
| 2026-02-02 | 13F | Wolverine Asset Management Llc | 420.235 | -4,71 | 5.951 | 27,41 | ||||
| 2026-02-17 | 13F | Engineers Gate Manager LP | 141.023 | -28,32 | 1.997 | -4,18 | ||||
| 2026-02-17 | 13F | Two Sigma Investments, Lp | 210.166 | 0,00 | 2.976 | 33,71 | ||||
| 2026-02-17 | 13F | XTX Topco Ltd | 0 | -100,00 | 0 | |||||
| 2026-01-13 | 13F | Matrix Trust Co | 1.117 | 0 | ||||||
| 2026-02-17 | 13F | Magnetar Financial LLC | 3.956.298 | 93,35 | 56.021 | 158,53 | ||||
| 2026-02-10 | 13F | Connor, Clark & Lunn Investment Management Ltd. | 1.359.713 | -19,82 | 19.254 | 7,21 | ||||
| 2026-02-11 | 13F | Barrow Hanley Mewhinney & Strauss Llc | 0 | -100,00 | 0 | |||||
| 2026-02-12 | 13F | Jane Street Group, Llc | 0 | -100,00 | 0 | |||||
| 2026-02-12 | 13F | Jane Street Group, Llc | Call | 0 | -100,00 | 0 | ||||
| 2026-01-16 | 13F | FNY Investment Advisers, LLC | 20.420 | 2,10 | 0 | |||||
| 2026-02-17 | 13F | Aquatic Capital Management LLC | 0 | -100,00 | 0 | |||||
| 2026-02-10 | 13F | Quantbot Technologies LP | 22.940 | 325 | ||||||
| 2026-02-12 | 13F | Renaissance Technologies Llc | 496.045 | -5,07 | 7.024 | 26,93 | ||||
| 2026-01-08 | 13F | Wealth Enhancement Advisory Services, Llc | 17.952 | 0,55 | 259 | 48,00 | ||||
| 2026-01-28 | 13F | Eos Management, L.P. | 30.000 | 0,00 | 425 | 33,75 | ||||
| 2026-02-20 | 13F/A | Prestige Wealth Management Group LLC | 0 | -100,00 | 0 | |||||
| 2026-02-10 | 13F | Goldman Sachs Group Inc | 3.187.582 | 159,22 | 45.136 | 246,61 | ||||
| 2026-02-19 | 13F | Invesco Ltd. | 191.842 | -62,93 | 2.716 | -50,44 | ||||
| 2025-12-29 | 13F | Swiss Life Asset Management Ltd | 0 | -100,00 | 0 | -100,00 | ||||
| 2025-11-07 | 13F | Shell Asset Management Co | 0 | -100,00 | 0 | |||||
| 2026-02-17 | 13F | D. E. Shaw & Co., Inc. | 3.327.642 | -35,56 | 47.119 | -13,84 | ||||
| 2026-02-17 | 13F | Caption Management, LLC | Call | 0 | -100,00 | 0 | ||||
| 2026-02-17 | 13F | Royal Bank Of Canada | 3.574 | 75,97 | 50 | 138,10 | ||||
| 2026-02-11 | 13F | Empowered Funds, LLC | 624.914 | -33,41 | 8.849 | -10,97 | ||||
| 2026-02-12 | 13F | Voya Investment Management Llc | 19.573 | -4,99 | 277 | 27,06 | ||||
| 2026-02-13 | 13F | Aigen Investment Management, Lp | 0 | -100,00 | 0 | |||||
| 2026-02-17 | 13F | Jump Financial, LLC | 0 | -100,00 | 0 | |||||
| 2026-02-17 | 13F | Susquehanna Portfolio Strategies, LLC | 87.300 | 0,00 | 1.236 | 33,77 | ||||
| 2026-02-17 | 13F | Cnh Partners Llc | 1.870.356 | 98,21 | 26.484 | 165,03 | ||||
| 2026-02-17 | 13F | Millennium Management Llc | 1.483.414 | 350,88 | 21.005 | 502,90 | ||||
| 2025-12-09 | 13F/A | Tudor Investment Corp Et Al | 0 | -100,00 | 0 | |||||
| 2026-02-02 | 13F | Wolverine Asset Management Llc | Put | 0 | -100,00 | 0 | -100,00 | |||
| 2026-02-17 | 13F | Caption Management, LLC | 0 | -100,00 | 0 | |||||
| 2026-02-20 | 13F | Sunbelt Securities, Inc. | 58 | 0,00 | 1 | |||||
| 2026-02-17 | 13F | Water Island Capital Llc | 444.821 | -2,58 | 6.299 | 30,26 | ||||
| 2025-11-14 | 13F | Foursixthree Capital Lp | 0 | -100,00 | 0 | -100,00 | ||||
| 2026-02-17 | 13F | Citadel Advisors Llc | Call | 62.300 | -64,94 | 882 | -53,11 | |||
| 2026-02-17 | 13F | Citadel Advisors Llc | 434.528 | -52,94 | 6.153 | -37,08 | ||||
| 2025-11-12 | 13F/A | Norges Bank | 0 | -100,00 | 0 | |||||
| 2026-02-17 | 13F | Jones Financial Companies Lllp | 1.318 | 0,00 | 19 | 38,46 | ||||
| 2026-01-05 | 13F | GAMMA Investing LLC | 753 | 746,07 | 11 | |||||
| 2025-11-14 | 13F | Centiva Capital, LP | 0 | -100,00 | 0 | |||||
| 2026-02-17 | 13F | Aristeia Capital Llc | 0 | -100,00 | 0 | |||||
| 2026-01-29 | 13F | Dunhill Financial, LLC | 2 | 0 | ||||||
| 2026-02-13 | 13F | Parkside Financial Bank & Trust | 140 | 0,00 | 2 | 0,00 | ||||
| 2026-02-13 | 13F | Soros Fund Management Llc | 0 | -100,00 | 0 | |||||
| 2026-02-13 | 13F | Rhumbline Advisers | 149.758 | -14,49 | 2.121 | 14,35 | ||||
| 2026-02-17 | 13F | Adage Capital Partners Gp, L.l.c. | 0 | -100,00 | 0 | |||||
| 2026-02-05 | 13F | Gabelli Funds Llc | 99.607 | 31,31 | 1.410 | 75,59 | ||||
| 2026-02-11 | 13F | Gwn Securities Inc. | 0 | -100,00 | 0 | |||||
| 2026-02-17 | 13F | Citadel Advisors Llc | Put | 12.900 | -85,95 | 183 | -81,28 | |||
| 2026-02-17 | 13F | Advisory Services Network, LLC | 0 | -100,00 | 0 | |||||
| 2026-02-11 | 13F | Cerity Partners LLC | 0 | -100,00 | 0 | |||||
| 2026-02-17 | 13F | DV Trading LLC | 1.000 | 14 | ||||||
| 2026-02-12 | 13F | Swiss National Bank | 187.700 | 2.658 | ||||||
| 2026-01-08 | 13F | True Wealth Design, LLC | 693 | 0,00 | 10 | 28,57 | ||||
| 2026-02-17 | 13F | LMR Partners LLP | 25.612 | 363 | ||||||
| 2026-02-17 | 13F | Stonehill Capital Management Llc | 953.635 | 0,00 | 14 | 30,00 | ||||
| 2026-02-17 | 13F | Northern Trust Corp | 904.109 | 1,42 | 12.802 | 35,61 | ||||
| 2026-02-17 | 13F | Brevan Howard Capital Management LP | 0 | -100,00 | 0 | |||||
| 2026-02-11 | 13F | Winton Capital Group Ltd | 0 | -100,00 | 0 | |||||
| 2026-01-30 | 13F | Us Bancorp \de\ | 1.419 | 22,01 | 20 | 66,67 | ||||
| 2026-02-05 | 13F | Alpine Associates Management Inc. | 1.397.243 | 109,38 | 19.785 | 179,99 | ||||
| 2026-01-21 | 13F | Prime Capital Investment Advisors, LLC | 0 | -100,00 | 0 | |||||
| 2026-02-13 | 13F | Alberta Investment Management Corp | 0 | -100,00 | 0 | |||||
| 2026-02-13 | 13F | Public Employees Retirement Association Of Colorado | 12.708 | 0,00 | 0 | |||||
| 2026-01-16 | 13F | DiNuzzo Private Wealth, Inc. | 6 | 0,00 | 1 | |||||
| 2026-02-17 | 13F | Quantinno Capital Management LP | 32.883 | 6,33 | 466 | 42,20 | ||||
| 2025-11-07 | 13F | May Hill Capital, LLC | 0 | -100,00 | 0 | |||||
| 2025-11-05 | 13F | Bessemer Group Inc | 0 | -100,00 | 0 | |||||
| 2026-02-11 | 13F | Parallel Advisors, LLC | 372 | 0,00 | 5 | 66,67 | ||||
| 2026-02-11 | 13F | Highbridge Capital Management Llc | 0 | -100,00 | 0 | |||||
| 2026-02-17 | 13F | One William Street Capital Management, L.p. | 0 | -100,00 | 0 | |||||
| 2026-02-13 | 13F | Caxton Associates Llp | 26.180 | -5,09 | 371 | 26,71 | ||||
| 2026-02-02 | 13F | Highland Capital Management, Llc | 19.303 | 273 | ||||||
| 2026-02-06 | 13F | Mraz, Amerine & Associates, Inc. | 10.000 | 0,00 | 142 | 34,29 | ||||
| 2026-02-06 | 13F | ProShare Advisors LLC | 47.443 | 4,18 | 672 | 39,21 | ||||
| 2026-01-15 | 13F | Nisa Investment Advisors, Llc | 1.083 | 331,47 | 15 | 650,00 | ||||
| 2026-02-05 | 13F | GABELLI & Co INVESTMENT ADVISERS, INC. | 98.581 | 3,53 | 1.396 | 38,39 | ||||
| 2026-01-28 | 13F | Arizona State Retirement System | 26.489 | 375 | ||||||
| 2026-02-17 | 13F | Kintayl Capital LP | 205.110 | 167,93 | 2.904 | 258,52 | ||||
| 2026-02-17 | 13F | Schonfeld Strategic Advisors LLC | 0 | -100,00 | 0 | |||||
| 2026-01-29 | 13F | UBS Group AG | 1.430.978 | 136,67 | 20.263 | 216,45 | ||||
| 2026-02-13 | 13F | Natixis | 330.000 | 4.673 | ||||||
| 2025-10-31 | 13F | Frazier Financial Advisors, LLC | 0 | -100,00 | 0 | -100,00 | ||||
| 2026-02-13 | 13F | BNP Paribas Asset Management Holding S.A. | 1.650 | 0 | ||||||
| 2026-03-12 | 13F/A | Peak6 Llc | 11.323 | 160 | ||||||
| 2026-02-05 | 13F | Berman McAleer LLC | 10.291 | -50,00 | 146 | -33,18 | ||||
| 2026-02-13 | 13F | SRS Capital Advisors, Inc. | 0 | -100,00 | 0 | |||||
| 2026-02-17 | 13F | Qube Research & Technologies Ltd | 1.004.056 | -5,81 | 14.217 | 25,95 | ||||
| 2026-01-20 | 13F | Signaturefd, Llc | 235 | 100,85 | 3 | 200,00 | ||||
| 2026-02-12 | 13F | New York State Common Retirement Fund | 33.510 | 71,76 | 475 | 130,10 | ||||
| 2026-02-17 | 13F | Fmr Llc | 28.437 | -97,52 | 403 | -96,68 | ||||
| 2026-02-17 | 13F | MIRAE ASSET GLOBAL ETFS HOLDINGS Ltd. | 49.022 | 0,78 | 694 | 34,76 | ||||
| 2026-02-17 | 13F | Zacks Investment Management | 17.834 | -26,66 | 253 | -1,95 | ||||
| 2026-02-17 | 13F | California State Teachers Retirement System | 90.787 | 1.175,64 | 1.286 | 1.613,33 | ||||
| 2026-01-23 | 13F | Avion Wealth | 153 | 0,00 | 0 | |||||
| 2026-02-17 | 13F | Equitec Proprietary Markets, Llc | Call | 0 | -100,00 | 0 | ||||
| 2025-11-14 | 13F | Raymond James Financial Inc | 0 | -100,00 | 0 | |||||
| 2026-01-23 | 13F | Farther Finance Advisors, LLC | 2.375 | 1.124,23 | 34 | 1.550,00 | ||||
| 2026-02-17 | 13F | Verdad Advisers, LP | 35.911 | 508 | ||||||
| 2026-02-10 | 13F | Intech Investment Management Llc | 54.137 | 36,35 | 767 | 82,38 | ||||
| 2026-02-17 | 13F | Balyasny Asset Management Llc | 1.364.727 | 19.325 | ||||||
| 2026-02-10 | 13F | Rothschild Investment Llc | 124 | 3,33 | 2 | 0,00 | ||||
| 2026-02-17 | 13F | Oxford Asset Management Llp | 41.297 | 110,29 | 585 | 722,54 | ||||
| 2026-02-17 | 13F | RPD Fund Management LLC | 0 | -100,00 | 0 | |||||
| 2026-02-10 | 13F | MUFG Securities EMEA plc | 0 | -100,00 | 0 | |||||
| 2026-01-28 | 13F | DekaBank Deutsche Girozentrale | 32.853 | 0,00 | 0 | |||||
| 2026-02-17 | 13F | Algert Global Llc | 83.892 | -80,07 | 1 | -75,00 | ||||
| 2026-01-27 | 13F | Optas, LLC | 17.093 | 0,00 | 242 | 33,70 | ||||
| 2026-02-13 | 13F | Sterling Capital Management LLC | 6.146 | -15,90 | 87 | 12,99 | ||||
| 2025-11-04 | 13F | Thrivent Financial For Lutherans | 0 | -100,00 | 0 | |||||
| 2026-02-17 | 13F | Angelo Gordon & Co., L.p. | 9.692.993 | 0,00 | 137.253 | 33,71 | ||||
| 2026-02-17 | 13F | Trexquant Investment LP | 0 | -100,00 | 0 | |||||
| 2026-02-13 | 13F | Arrowstreet Capital, Limited Partnership | 1.001.752 | -31,75 | 14.185 | -8,74 | ||||
| 2025-11-12 | 13F | HAP Trading, LLC | Call | 212.600 | 1.551 | |||||
| 2026-01-06 | 13F | Investors Research Corp | 700 | -96,02 | 10 | -95,16 | ||||
| 2026-02-17 | 13F | Susquehanna Fundamental Investments, Llc | 109.397 | 0,00 | 1.549 | 33,77 | ||||
| 2026-02-17 | 13F | Russell Investments Group, Ltd. | 12.635 | -78,25 | 179 | -71,06 | ||||
| 2025-11-12 | 13F | HAP Trading, LLC | 97.192 | 1.029 | ||||||
| 2026-02-13 | 13F | Prudential Financial Inc | 0 | -100,00 | 0 | |||||
| 2026-02-13 | 13F | Sei Investments Co | 208.811 | 1.936,39 | 2.957 | 2.637,04 | ||||
| 2026-02-17 | 13F | Pentwater Capital Management LP | 350.000 | 191,67 | 4.956 | 290,24 | ||||
| 2026-02-17 | 13F | Metavasi Capital LP | 0 | -100,00 | 0 | |||||
| 2026-02-17 | 13F | Birnam Oak Advisors, LP | 507.463 | 70,90 | 7.186 | 128,53 | ||||
| 2026-02-17 | 13F | Price T Rowe Associates Inc /md/ | 103.204 | -10,31 | 1 | 0,00 | ||||
| 2026-01-09 | 13F | SG Americas Securities, LLC | 47.845 | 23,58 | 1 | |||||
| 2026-02-09 | 13F | Hartland & Co., LLC | 0 | -100,00 | 0 | |||||
| 2025-11-14 | 13F | King Street Capital Management, L.p. | 0 | -100,00 | 0 | -100,00 | ||||
| 2026-01-27 | 13F | Zurcher Kantonalbank (Zurich Cantonalbank) | 33.083 | 468 | ||||||
| 2026-02-11 | 13F | Ameritas Investment Partners, Inc. | 8.817 | 125 | ||||||
| 2026-02-13 | 13F | Y-Intercept (Hong Kong) Ltd | 171.764 | 82,56 | 2.432 | 144,18 | ||||
| 2026-02-17 | 13F | Optiver Holding B.V. | 411 | -47,44 | 6 | -37,50 | ||||
| 2026-02-17 | 13F | Aqr Capital Management Llc | 316.631 | -47,69 | 4.483 | -30,06 | ||||
| 2026-02-17 | 13F | ExodusPoint Capital Management, LP | Call | 0 | -100,00 | 0 | -100,00 | |||
| 2026-02-17 | 13F | Vazirani Asset Management LLC | 25.000 | 354 | ||||||
| 2026-01-22 | 13F | Trium Capital LLP | 958.378 | 13.571 | ||||||
| 2026-02-17 | 13F | ExodusPoint Capital Management, LP | 0 | -100,00 | 0 | -100,00 | ||||
| 2026-02-02 | 13F | Mutual Advisors, LLC | 109.050 | 0,00 | 1.544 | 39,98 | ||||
| 2026-02-09 | 13F | Quest Partners LLC | 40.132 | -55,58 | 568 | -40,59 | ||||
| 2026-01-22 | 13F | Benefit Street Partners LLC | 644.730 | 9.129 | ||||||
| 2026-02-13 | 13F | DLD Asset Management, LP | 0 | -100,00 | 0 | |||||
| 2026-02-17 | 13F | Nomura Holdings Inc | Call | 240.000 | -20,00 | 3.398 | 6,96 | |||
| 2026-02-05 | 13F | Abacus Wealth Partners, LLC | 28.232 | 400 | ||||||
| 2026-02-13 | 13F | Manufacturers Life Insurance Company, The | 0 | -100,00 | 0 | |||||
| 2026-02-17 | 13F | Jain Global LLC | 26.606 | 377 | ||||||
| 2026-02-11 | 13F | Hughes Financial Services, LLC | 161 | 0,00 | 2 | 100,00 | ||||
| 2026-02-12 | 13F | Cibc World Markets Corp | 406.982 | -1,46 | 5.763 | 285,42 | ||||
| 2026-02-17 | 13F | PenderFund Capital Management Ltd. | 8.500 | 54,55 | 120 | 106,90 | ||||
| 2026-02-12 | 13F | Nuveen, LLC | 346.602 | 42,55 | 4.908 | 90,64 | ||||
| 2026-02-13 | 13F | Citigroup Inc | 2.621.933 | 234,19 | 37.127 | 346,87 | ||||
| 2026-02-12 | 13F | State Board Of Administration Of Florida Retirement System | 44.010 | -8,85 | 623 | 21,92 | ||||
| 2026-02-05 | 13F | Allworth Financial LP | 490 | 25,64 | 7 | 50,00 | ||||
| 2026-02-17 | 13F | Graham Capital Management, L.P. | 48.831 | 691 | ||||||
| 2026-02-13 | 13F | Quarry LP | 123.997 | 10,94 | 1.756 | 48,35 | ||||
| 2026-02-17 | 13F | Css Llc/il | 23.416 | 129,57 | 332 | 206,48 | ||||
| 2026-02-13 | 13F | Victory Capital Management Inc | 11.832 | -86,39 | 168 | -81,85 | ||||
| 2026-02-03 | 13F | SBI Securities Co., Ltd. | 112 | 0,00 | 2 | 0,00 | ||||
| 2026-03-06 | 13F | Hsbc Holdings Plc | 0 | -100,00 | 0 |