Grundlæggende statistik
| Institutionelle ejere | 280 total, 280 long only, 0 short only, 0 long/short - change of 5,62% MRQ |
| Gennemsnitlig porteføljeallokering | 0.4734 % - change of -20,15% MRQ |
| Institutionelle aktier (lange) | 102.015.434 (ex 13D/G) - change of 0,18MM shares 0,18% MRQ |
| Institutionel værdi (lang) | $ 4.644.299 USD ($1000) |
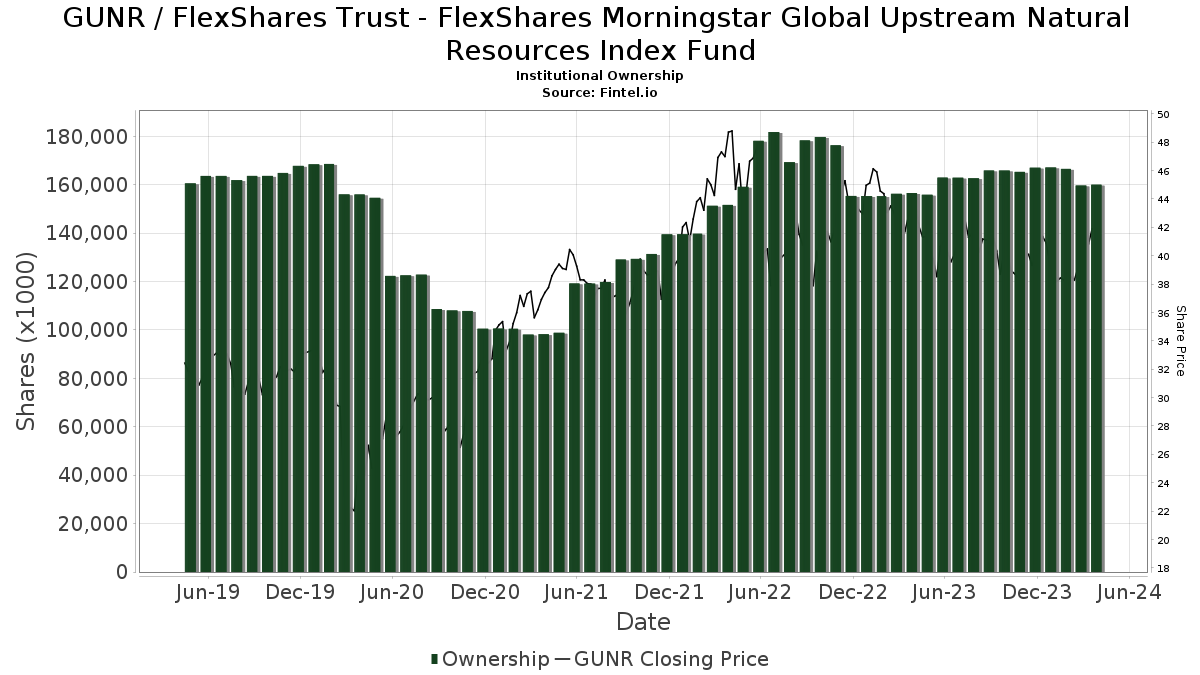
Institutionelt ejerskab og aktionærer
FlexShares Trust - FlexShares Morningstar Global Upstream Natural Resources Index Fund (US:GUNR) har 280 institutionelle ejere og aktionærer, der har indsendt 13D/G- eller 13F-formularer til Securities Exchange Commission (SEC). Disse institutioner har i alt 102,015,434 aktier. Største aktionærer omfatter Northern Trust Corp, Evoke Wealth, Llc, Common Fund For Nonprofit Organizations, Valmark Advisers, Inc., Morgan Stanley, 1832 Asset Management L.P., First Interstate Bank, Connable Office Inc, Moller Financial Services, and Aaron Wealth Advisors LLC .
FlexShares Trust - FlexShares Morningstar Global Upstream Natural Resources Index Fund (ARCA:GUNR) institutionel ejerskabsstruktur viser aktuelle positioner i virksomheden efter institutioner og fonde, samt seneste ændringer i positionsstørrelse. Større aktionærer kan omfatte individuelle investorer, investeringsforeninger, hedgefonde eller institutioner. Skema 13D angiver, at investoren besidder (eller besidder) mere end 5 % af virksomheden og har til hensigt (eller har til hensigt at) aktivt at forfølge en ændring i forretningsstrategi. Skema 13G indikerer en passiv investering på over 5%.
The share price as of February 27, 2026 is 55,64 / share. Previously, on March 3, 2025, the share price was 37,23 / share. This represents an increase of 49,45% over that period.
Fondens stemningsscore
Fund Sentiment Score (fka Ownership Accumulation Score) finder de aktier, der bliver mest købt af fonde. Det er resultatet af en sofistikeret, multi-faktor kvantitativ model, der identificerer virksomheder med de højeste niveauer af institutionel akkumulering. Scoringsmodellen bruger en kombination af den samlede stigning i oplyste ejere, ændringerne i porteføljeallokeringer i disse ejere og andre målinger. Tallet går fra 0 til 100, hvor højere tal indikerer et højere niveau af akkumulering for sine jævnaldrende, og 50 er gennemsnittet.
Opdateringsfrekvens: Dagligt
Se Ownership Explorer, som giver en liste over højest rangerende virksomheder.
AI+ Ask Fintel’s AI assistant about FlexShares Trust - FlexShares Morningstar Global Upstream Natural Resources Index Fund.
Select a question to share a public post with an AI-crafted answer.
Thinking of good questions…
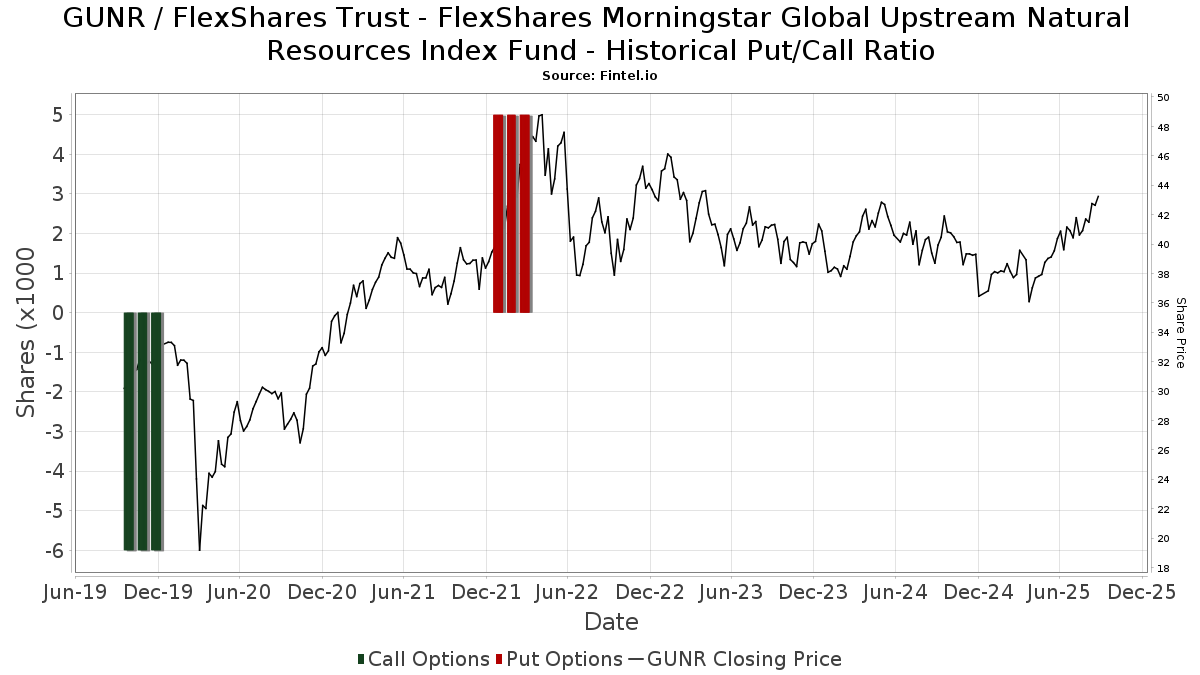
Institutionel Put/Call-forhold
Ud over at indberette standardaktie- og gældsudstedelser skal institutter med mere end 100 mill. aktiver under forvaltning også oplyse deres put- og call-optionsbeholdninger. Da salgsoptioner generelt indikerer negativ stemning, og købsoptioner indikerer positiv stemning, kan vi få en fornemmelse af den overordnede institutionelle stemning ved at plotte forholdet mellem put og kald. Diagrammet til højre viser det historiske put/call-forhold for dette instrument.
Brug af Put/Call Ratio som en indikator for investorernes stemning overvinder en af de vigtigste mangler ved at bruge totalt institutionelt ejerskab, som er, at en betydelig mængde af aktiver under forvaltning investeres passivt for at spore indekser. Passivt forvaltede fonde køber typisk ikke optioner, så indikatoren for put/call-forholdet følger mere nøje følelsen af aktivt forvaltede fonde.
13F og NPORT arkivering
Detaljer om 13F-arkivering er gratis. Detaljer om NP-ansøgninger kræver et premium-medlemskab. Grønne rækker angiver nye positioner. Røde rækker angiver lukkede positioner. Klik på linket ikon for at se den fulde transaktionshistorik.
Opgrader
for at låse premium-data op og eksportere til Excel ![]() .
.
| Fil dato | Kilde | Investor | Type | Gennemsnitlig pris (Øst) |
Aktier | Δ Aktier (%) |
Rapporteret Værdi ($1000) |
Δ Værdi (%) |
Port Alloc (%) |
|
|---|---|---|---|---|---|---|---|---|---|---|
| 2026-01-23 | 13F | S. R. Schill & Associates | 113.254 | -1,36 | 5.193 | 3,30 | ||||
| 2026-01-28 | 13F | Geneos Wealth Management Inc. | 32 | 1 | ||||||
| 2026-02-17 | 13F | North Capital, Inc. | 0 | -100,00 | 0 | |||||
| 2026-02-03 | 13F | F/M Investments LLC | 5.879 | 0,00 | 270 | 4,67 | ||||
| 2026-02-10 | 13F | Bnp Paribas Arbitrage, Sa | 318 | 15 | ||||||
| 2026-02-11 | 13F | CNB Bank | 2.150 | 0,00 | 99 | 4,26 | ||||
| 2026-02-13 | 13F | MAI Capital Management | 184.555 | 6,59 | 8.462 | 11,64 | ||||
| 2026-02-04 | 13F | MONECO Advisors, LLC | 45.329 | -1,79 | 2.078 | 2,87 | ||||
| 2026-02-02 | 13F | Millstone Evans Group, LLC | 174 | 0,00 | 8 | 0,00 | ||||
| 2026-02-12 | 13F | Stelac Advisory Services LLC | 30.342 | 49,90 | 1.392 | 57,00 | ||||
| 2026-01-30 | 13F | Caldwell Trust Co | 1.383 | 98,42 | 63 | 110,00 | ||||
| 2026-02-05 | 13F | United Bank | 175.309 | -1,06 | 8.038 | 3,62 | ||||
| 2026-02-17 | 13F | Creative Planning | 41.075 | 26,62 | 1.883 | 32,61 | ||||
| 2026-01-29 | 13F | UBS Group AG | 233.310 | 6,80 | 10.697 | 11,85 | ||||
| 2026-02-17 | 13F | Redwood Park Advisors LLC | 45.587 | 32,79 | 2.090 | 39,15 | ||||
| 2026-01-29 | 13F | Cornerstone National Bank & Trust Co | 123.053 | -1,23 | 5.642 | 3,43 | ||||
| 2026-02-17 | 13F | Signature Equity Partners, LLC | 69 | 3 | ||||||
| 2026-02-12 | 13F | Rossby Financial, LCC | 9.826 | 451 | ||||||
| 2026-02-11 | 13F | Parallel Advisors, LLC | 0 | -100,00 | 0 | |||||
| 2025-11-06 | 13F | Ameritas Advisory Services, LLC | 0 | -100,00 | 0 | |||||
| 2026-02-17 | 13F | Qube Research & Technologies Ltd | 0 | -100,00 | 0 | |||||
| 2026-02-17 | 13F | Laird Norton Trust Company, Llc | 12.901 | 592 | ||||||
| 2026-02-17 | 13F | Hancock Whitney Corp | 7.128 | -8,40 | 327 | -4,12 | ||||
| 2026-02-12 | 13F | CIBC Private Wealth Group, LLC | 1.419 | -0,98 | 65 | 4,84 | ||||
| 2025-11-19 | 13F | Sunbelt Securities, Inc. | 0 | -100,00 | 0 | |||||
| 2026-02-09 | 13F | Barry Investment Advisors, LLC | 575.792 | 25,61 | 26.400 | 31,59 | ||||
| 2026-02-20 | 13F | Cambient Family Office, Llc | 121.444 | 5.568 | ||||||
| 2026-02-12 | 13F | Hollencrest Capital Management | 5.273 | 0,00 | 242 | 4,78 | ||||
| 2026-02-13 | 13F | Fort Point Capital Partners LLC | 8.553 | 0,00 | 422 | 12,57 | ||||
| 2026-02-17 | 13F | Bank Of America Corp /de/ | 460.801 | 3,05 | 21.128 | 7,92 | ||||
| 2026-02-13 | 13F | Gts Securities Llc | 31.394 | 1.439 | ||||||
| 2026-02-10 | 13F | Foundations Investment Advisors, LLC | 65.485 | 3.002 | ||||||
| 2026-02-19 | 13F | Atomi Financial Group, Inc. | 5.175 | 0,00 | 237 | 4,87 | ||||
| 2026-02-13 | 13F | Y-Intercept (Hong Kong) Ltd | 25.814 | 0,00 | 1.184 | 4,69 | ||||
| 2026-01-26 | 13F | Austin Wealth Management, LLC | 159.736 | 2,75 | 7.522 | 11,41 | ||||
| 2026-02-05 | 13F | Park Square Financial Group, LLC | 15 | 50,00 | 1 | |||||
| 2026-02-17 | 13F | Northern Trust Corp | 66.012.371 | -1,57 | 3.026.667 | 3,08 | ||||
| 2026-02-13 | 13F | Baird Financial Group, Inc. | 8.824 | -9,72 | 405 | -5,39 | ||||
| 2026-01-22 | 13F | Harwood Advisory Group, LLC | 33 | 0,00 | 2 | 0,00 | ||||
| 2025-11-07 | 13F | Beacon Capital Management, LLC | 0 | -100,00 | 0 | |||||
| 2026-02-13 | 13F | Stifel Financial Corp | 28.565 | 9,15 | 1.310 | 14,32 | ||||
| 2026-02-02 | 13F | CENTRAL TRUST Co | 404.960 | 7,97 | 18.567 | 13,08 | ||||
| 2026-02-06 | 13F | HighTower Advisors, LLC | 27.476 | -3,39 | 1.260 | 1,12 | ||||
| 2026-01-21 | 13F | Sound Income Strategies, LLC | 338 | 0,00 | 17 | 14,29 | ||||
| 2026-02-13 | 13F | Missouri Trust & Investment Co | 70.676 | -0,35 | 3.240 | 4,35 | ||||
| 2026-02-06 | 13F | Evoke Wealth, Llc | 4.546.036 | 8,10 | 208.436 | 13,22 | ||||
| 2026-01-02 | 13F | Boltwood Capital Management | 115.703 | -1,27 | 5.305 | 3,39 | ||||
| 2026-02-12 | 13F | Triumph Capital Management | 250 | 0,00 | 11 | 10,00 | ||||
| 2026-01-23 | 13F | Smallwood Wealth Investment Management, LLC | 54.332 | -6,16 | 2.491 | -1,70 | ||||
| 2026-02-17 | 13F | Jones Financial Companies Lllp | 7.150 | 25,75 | 328 | 31,33 | ||||
| 2026-01-16 | 13F | Verus Wealth Management, Llc | 5.015 | 0,00 | 230 | 4,57 | ||||
| 2026-02-06 | 13F | Cedar Wealth Management, LLC | 0 | -100,00 | 0 | |||||
| 2026-02-06 | 13F | IFP Advisors, Inc | 15.254 | 1.512,47 | 699 | 1.604,88 | ||||
| 2026-02-10 | 13F | Principia Wealth Advisory, LLC | 747 | -55,72 | 34 | -53,42 | ||||
| 2026-01-30 | 13F | Activest Wealth Management | 185 | 0,54 | 9 | 0,00 | ||||
| 2026-02-04 | 13F | Purkiss Capital Advisors LLC | 48.480 | -6,57 | 2.223 | -2,16 | ||||
| 2026-01-23 | 13F | Nbt Bank N A /ny | 914.168 | -2,57 | 41.917 | 2,03 | ||||
| 2026-02-17 | 13F | Aqr Capital Management Llc | 0 | -100,00 | 0 | |||||
| 2026-01-29 | 13F | Dunhill Financial, LLC | 62 | 0,00 | 3 | 0,00 | ||||
| 2026-02-04 | 13F | Brio Consultants, LLC | 183.981 | 5,77 | 8.436 | 10,77 | ||||
| 2026-02-17 | 13F | Ameriprise Financial Inc | 320.126 | 1,72 | 14.653 | 6,35 | ||||
| 2026-01-21 | 13F | Clayton Financial Group LLC | 9.795 | 449 | ||||||
| 2026-02-17 | 13F | Glenmede Trust Co Na | 4.611 | 211 | ||||||
| 2025-11-07 | 13F | TCTC Holdings, LLC | 0 | -100,00 | 0 | |||||
| 2026-01-14 | 13F | Quad-Cities Investment Group, LLC | 8.487 | 9,28 | 389 | 14,75 | ||||
| 2026-02-06 | 13F | Gables Capital Management Inc. | 4.970 | 0,00 | 228 | 4,61 | ||||
| 2026-02-04 | 13F | Pensionmark Financial Group, Llc | 5.902 | 3,98 | 259 | 4,44 | ||||
| 2026-01-29 | 13F | Nbc Securities, Inc. | 135 | 0,00 | 6 | 20,00 | ||||
| 2026-01-08 | 13F | Versant Capital Management, Inc | 764.886 | 36,17 | 35.070 | 42,61 | ||||
| 2026-02-12 | 13F | Douglass Winthrop Advisors, LLC | 16.466 | 5,63 | 755 | 10,56 | ||||
| 2026-01-20 | 13F | American National Bank | 648 | 0,00 | 30 | 3,57 | ||||
| 2026-01-21 | 13F | Kentucky Trust Co | 493 | 0,00 | 23 | 4,76 | ||||
| 2026-02-05 | 13F | Navalign, LLC | 372.219 | 1,06 | 17.066 | 5,84 | ||||
| 2025-11-14 | 13F | Strategic Wealth Partners, Ltd. | 65 | 3 | ||||||
| 2026-01-13 | 13F | Mather Group, Llc. | 10.400 | 0,00 | 477 | 4,62 | ||||
| 2026-02-05 | 13F | Allworth Financial LP | 6.872 | 0,22 | 315 | 5,00 | ||||
| 2026-02-09 | 13F | Huntington National Bank | 357 | 4,69 | ||||||
| 2026-02-05 | 13F | Stephens Inc /ar/ | 40.260 | 1.846 | ||||||
| 2026-02-06 | 13F | Creative Financial Designs Inc /adv | 14 | 100,00 | 1 | |||||
| 2026-02-13 | 13F | Ubs Asset Management Americas Inc | 950 | 44 | ||||||
| 2026-02-11 | 13F | Jpmorgan Chase & Co | 37.825 | 7,21 | 1.734 | 12,31 | ||||
| 2026-02-12 | 13F | Colonial Trust Advisors | 61 | 3 | ||||||
| 2026-02-11 | 13F | Vestor Capital, Llc | 2.612 | -7,08 | 0 | |||||
| 2026-02-13 | 13F | Wells Fargo & Company/mn | 109.254 | 12,97 | 5.009 | 18,30 | ||||
| 2026-02-13 | 13F | AlTi Global, Inc. | 56.120 | 0,70 | 2.573 | 5,49 | ||||
| 2026-01-23 | 13F | Transcend Wealth Collective, Llc | 31.428 | -1,10 | 1.441 | 3,52 | ||||
| 2026-01-28 | 13F | Arkansas Financial Group, Inc. | 176.300 | -5,42 | 8.083 | -0,94 | ||||
| 2026-02-13 | 13F | Mml Investors Services, Llc | 52.179 | 7,27 | 2.392 | 12,35 | ||||
| 2026-02-04 | 13F | Dogwood Wealth Management LLC | 103 | 0,00 | 5 | 0,00 | ||||
| 2026-01-28 | 13F | Provident Wealth Management, LLC | 11.642 | -7,42 | 534 | -3,09 | ||||
| 2026-02-10 | 13F | Pasadena Private Wealth, LLC | 196.997 | 16,40 | 9.032 | 21,91 | ||||
| 2026-02-18 | 13F | GWM Advisors LLC | 0 | -100,00 | 0 | |||||
| 2026-02-12 | 13F | BRYN MAWR TRUST Co | 30 | -92,35 | 1 | -94,12 | ||||
| 2026-01-27 | 13F | Busey Wealth Management | 17.510 | 0,00 | 803 | 4,70 | ||||
| 2026-02-05 | 13F | Plancorp, LLC | 4.669 | 0,00 | 214 | 4,90 | ||||
| 2026-02-13 | 13F | Carter Financial Group, INC. | 4.863 | -4,27 | 223 | 0,00 | ||||
| 2026-02-03 | 13F | Connable Office Inc | 1.248.153 | 33,21 | 57.228 | 39,51 | ||||
| 2026-02-09 | 13F | Clune & Associates, Ltd. | 21.887 | 17,50 | 1.004 | 23,07 | ||||
| 2026-01-21 | 13F | Walkner Condon Financial Advisors LLC | 68.648 | 0,77 | 3.146 | 5,68 | ||||
| 2026-02-12 | 13F | Bank Of Montreal /can/ | 13.851 | 38,41 | 635 | 44,98 | ||||
| 2026-02-09 | 13F | Harbour Investments, Inc. | 82 | -10,87 | 4 | -25,00 | ||||
| 2026-02-10 | 13F/A | Northwestern Mutual Wealth Management Co | 60.184 | 13,41 | 2.759 | 18,77 | ||||
| 2026-01-30 | 13F | Pekin Hardy Strauss, Inc. | 14.165 | 0,32 | 649 | 5,02 | ||||
| 2026-02-13 | 13F | Quarry LP | 30 | 1 | ||||||
| 2026-02-27 | 13F | Beacon Advisors Holdings, Llc | 17.870 | 819 | ||||||
| 2026-02-06 | 13F | Fortis Group Advisors, LLC | 184 | 0,00 | 8 | 0,00 | ||||
| 2026-02-09 | 13F | King Luther Capital Management Corp | 825 | -5,71 | ||||||
| 2026-02-05 | 13F | Bessemer Group Inc | 192.673 | 2,12 | 9 | 0,00 | ||||
| 2025-11-04 | 13F | L.m. Kohn & Company | 0 | -100,00 | 0 | |||||
| 2026-02-12 | 13F | Jane Street Group, Llc | 0 | -100,00 | 0 | |||||
| 2026-02-18 | 13F | Beacon Pointe Advisors, LLC | 98.488 | -1,18 | 4.516 | 3,48 | ||||
| 2026-01-21 | 13F | Ledyard National Bank | 182.966 | 0,76 | 8.389 | 5,52 | ||||
| 2026-02-11 | 13F | XML Financial, LLC | 13.107 | 601 | ||||||
| 2026-02-10 | 13F | Daiwa Securities Group Inc. | 5.600 | 0,00 | 0 | |||||
| 2026-02-04 | 13F | LRI Investments, LLC | 28.687 | 6,83 | 1.315 | 11,91 | ||||
| 2026-01-08 | 13F | Wealth Enhancement Advisory Services, Llc | 54.832 | -10,92 | 2.591 | -4,43 | ||||
| 2026-02-13 | 13F | Colony Group, LLC | 41.925 | -6,91 | 1.922 | -2,49 | ||||
| 2026-02-13 | 13F | Golden State Wealth Management, LLC | 770 | 0,65 | 35 | 6,06 | ||||
| 2026-02-02 | 13F | Forza Wealth Management, LLC | 11.238 | 0,00 | 515 | 4,67 | ||||
| 2026-02-17 | 13F | Marquette Associates, Inc. | 101 | -11,40 | 5 | 0,00 | ||||
| 2026-02-11 | 13F | Franklin Resources Inc | 84.920 | -6,54 | 3.894 | -2,11 | ||||
| 2026-02-17 | 13F | Royal Bank Of Canada | 193.134 | -1,10 | 8.856 | 3,58 | ||||
| 2026-01-21 | 13F | TOWER TRUST & INVESTMENT Co | 2.014 | 7,24 | 92 | 12,20 | ||||
| 2026-01-26 | 13F | Whittier Trust Co | 13.354 | 0,00 | 631 | 7,69 | ||||
| 2026-01-13 | 13F | CoreCap Advisors, LLC | 168.502 | 2,69 | 7.726 | 7,53 | ||||
| 2026-01-13 | 13F | Well Done, LLC | 9.430 | 0,00 | 432 | 4,85 | ||||
| 2026-02-10 | 13F | WASHINGTON TRUST Co | 7.885 | 0,00 | 362 | 4,64 | ||||
| 2026-02-03 | 13F | Bokf, Na | 21.041 | -6,91 | 965 | -2,53 | ||||
| 2026-02-13 | 13F | Citigroup Inc | 39 | -99,74 | 2 | -99,85 | ||||
| 2026-02-10 | 13F | Horizon Bancorp Inc /in/ | 59.543 | -2,82 | 3 | 0,00 | ||||
| 2026-02-13 | 13F | Avos Capital Management, LLC | 158.284 | 0,05 | 7.257 | 4,78 | ||||
| 2026-01-28 | 13F | N.E.W. Advisory Services LLC | 607 | 0,00 | 28 | 3,85 | ||||
| 2026-01-29 | 13F | Comerica Bank | 22.149 | -13,89 | 1.016 | -9,86 | ||||
| 2026-01-26 | 13F | Private Trust Co Na | 111 | 63,24 | 5 | 150,00 | ||||
| 2026-02-12 | 13F | BlackRock, Inc. | 18.134 | 478,62 | 831 | 506,57 | ||||
| 2025-11-13 | 13F | West Michigan Advisors, Llc | 0 | -100,00 | 0 | |||||
| 2026-01-29 | 13F | Warren Street Wealth Advisors, LLC | 11.457 | 0,00 | 525 | 4,79 | ||||
| 2025-11-14 | 13F | Old Mission Capital Llc | 0 | -100,00 | 0 | |||||
| 2026-02-12 | 13F | Bradley Foster & Sargent Inc/ct | 15.800 | 0,00 | 724 | 4,78 | ||||
| 2026-01-26 | 13F | Cwm, Llc | 8.940 | 40,30 | 0 | |||||
| 2026-02-12 | 13F | Litman Gregory Asset Management LLC | 447 | 20 | ||||||
| 2026-02-13 | 13F | Resources Investment Advisors, LLC. | 14.636 | 0,00 | 671 | 4,84 | ||||
| 2026-02-12 | 13F | Hm Payson & Co | 2.644 | 0,00 | 121 | 5,22 | ||||
| 2026-01-30 | 13F | Keybank National Association/oh | 23.719 | -6,59 | 1.088 | -2,16 | ||||
| 2026-02-04 | 13F | Boston Private Wealth Llc | 25.781 | -6,61 | 1.182 | -2,15 | ||||
| 2026-02-18 | 13F | EP Wealth Advisors, Inc. | 17.736 | -5,19 | 813 | 8,40 | ||||
| 2026-02-09 | 13F | Studio Investment Management Llc | 27.381 | -2,33 | 1.255 | 2,28 | ||||
| 2026-01-05 | 13F | Park National Corp /oh/ | 31.873 | -3,39 | 1.461 | 1,18 | ||||
| 2026-02-24 | 13F | Nolet Wealth Management, LLC | 5.650 | 259 | ||||||
| 2026-02-12 | 13F | Insigneo Advisory Services, Llc | 19.076 | -5,18 | 875 | -0,68 | ||||
| 2026-01-12 | 13F | CVA Family Office, LLC | 53.211 | -0,41 | 2.440 | 4,28 | ||||
| 2026-02-13 | 13F | Heritage Wealth Advisors | 0 | -100,00 | 0 | |||||
| 2025-11-14 | 13F | Skopos Labs, Inc. | 0 | -100,00 | 0 | |||||
| 2026-02-02 | 13F | Essex Savings Bank | 5.537 | -4,96 | 254 | -0,78 | ||||
| 2026-02-13 | 13F | Commerce Bank | 9.861 | 0,00 | 452 | 4,87 | ||||
| 2026-01-14 | 13F | Wealthcare Capital Partners, LLC | 0 | -100,00 | 0 | |||||
| 2026-01-23 | 13F | DHJJ Financial Advisors, Ltd. | 105 | 0,00 | 5 | 0,00 | ||||
| 2026-02-10 | 13F | DiMeo Schneider & Associates, L.L.C. | 22.281 | 0,00 | 1.022 | 4,72 | ||||
| 2026-02-17 | 13F | Herold Advisors, Inc. | 0 | -100,00 | 0 | |||||
| 2026-01-29 | 13F | First Interstate Bank | 1.486.823 | 1,88 | 68.171 | 6,70 | ||||
| 2026-02-09 | 13F | Hartland & Co., LLC | 10.915 | 0,00 | 500 | 4,82 | ||||
| 2026-02-13 | 13F | Kestra Advisory Services, LLC | 0 | -100,00 | 0 | |||||
| 2025-12-15 | 13F | Farmers National Bank | 277.533 | 2,52 | 12.150 | 11,91 | ||||
| 2026-02-10 | 13F | Madison Wealth Partners, Inc | 6.182 | -8,47 | 283 | -4,07 | ||||
| 2026-02-04 | 13F | BEAM Asset Management, LLC | 19.361 | -9,66 | 888 | -5,44 | ||||
| 2026-01-23 | 13F | Fifth Third Securities, Inc. | 4.446 | 204 | ||||||
| 2026-02-12 | 13F | Steward Partners Investment Advisory, Llc | 350 | 0,00 | 16 | 6,67 | ||||
| 2025-11-14 | 13F | Eqis Capital Management, Inc. | 0 | -100,00 | 0 | |||||
| 2026-01-30 | 13F | Sigma Planning Corp | 7.165 | 13,21 | 329 | 18,41 | ||||
| 2026-02-11 | 13F | Cerity Partners LLC | 13.297 | -31,97 | 610 | -28,77 | ||||
| 2025-11-13 | 13F | LaSalle St. Investment Advisors, LLC | 0 | -100,00 | 0 | |||||
| 2026-02-02 | 13F | Fifth Third Bancorp | 16 | -98,87 | 1 | -100,00 | ||||
| 2026-02-09 | 13F | Nicolet Bankshares Inc | 25.409 | -9,17 | 1.165 | -4,82 | ||||
| 2026-01-29 | 13F | Resonant Capital Advisors, LLC | 8.467 | 0,00 | 388 | 4,86 | ||||
| 2026-02-06 | 13F | Envestnet Portfolio Solutions, Inc. | 204.988 | -2,73 | 9.399 | 1,86 | ||||
| 2026-01-20 | 13F | Savvy Advisors, Inc. | 4.578 | 210 | ||||||
| 2026-02-17 | 13F | Mercer Global Advisors Inc /adv | 422.135 | 0,18 | 19.355 | 4,91 | ||||
| 2026-01-14 | 13F | Pathway Financial Advisors LLC | 377.290 | 2,03 | 17.827 | 10,12 | ||||
| 2026-01-08 | 13F | Moller Financial Services | 1.076.286 | -2,48 | 49.348 | 2,13 | ||||
| 2026-02-13 | 13F | Garrison Point Advisors, Llc | 19.617 | 2,54 | 899 | 7,41 | ||||
| 2026-01-08 | 13F | Fermata Advisors, LLC | 111.583 | 3,08 | 5.116 | 7,96 | ||||
| 2026-02-17 | 13F | Common Fund For Nonprofit Organizations | 3.979.018 | -9,47 | 182.438 | -5,19 | ||||
| 2026-02-06 | 13F | McKinley Carter Wealth Services, Inc. | 5.585 | 0,00 | 256 | 4,92 | ||||
| 2026-02-12 | 13F | Commonwealth Equity Services, Llc | 61.220 | 46,59 | 2.807 | 280.500,00 | ||||
| 2025-11-13 | 13F | Barometer Capital Management Inc. | 0 | -100,00 | 0 | -100,00 | ||||
| 2026-01-22 | 13F | Brookwood Investment Group LLC | 34.616 | 1.587 | ||||||
| 2026-02-17 | 13F | Spears Abacus Advisors LLC | 6.053 | 278 | ||||||
| 2026-02-12 | 13F | Wealthspire Advisors, LLC | 0 | -100,00 | 0 | |||||
| 2026-02-06 | 13F | Pnc Financial Services Group, Inc. | 16.677 | -1,85 | 765 | 2,83 | ||||
| 2026-02-17 | 13F | Advisory Services Network, LLC | 15.138 | -48,75 | 694 | -46,33 | ||||
| 2026-01-20 | 13F | AdvisorNet Financial, Inc | 61 | 0,00 | 3 | 0,00 | ||||
| 2026-02-09 | 13F | Valued Retirements, Inc. | 13.543 | -8,50 | 621 | 4,55 | ||||
| 2026-01-30 | 13F | Sageworth Trust Co of South Dakota | 8.168 | 0,00 | 375 | 4,76 | ||||
| 2026-01-12 | 13F | AllSquare Wealth Management LLC | 5.624 | -8,16 | 246 | 0,41 | ||||
| 2026-02-17 | 13F | Advisor Group Holdings, Inc. | 16.487 | -51,14 | 756 | -48,47 | ||||
| 2026-02-13 | 13F | Entrewealth, Llc | 40.399 | 5,40 | 2.084 | 24,20 | ||||
| 2026-02-13 | 13F | SRS Capital Advisors, Inc. | 137 | 6 | ||||||
| 2026-01-20 | 13F | Wealthcare Capital Management Llc | 0 | -100,00 | 0 | |||||
| 2026-02-05 | 13F | Pinnacle Associates Ltd | 6.418 | -4,61 | 294 | 0,00 | ||||
| 2026-02-19 | 13F | Birchwood Financial Partners, Inc. | 350 | 16 | ||||||
| 2026-02-19 | 13F | CI Private Wealth, LLC | 38.794 | 61,38 | 1.779 | 69,01 | ||||
| 2026-01-16 | 13F | Trust Co Of Vermont | 636 | 0,00 | 29 | 7,41 | ||||
| 2026-01-29 | 13F | Concurrent Investment Advisors, LLC | 23.814 | 3,76 | 1.092 | 8,67 | ||||
| 2026-02-11 | 13F | M Holdings Securities, Inc. | 217.707 | 10 | ||||||
| 2026-01-08 | 13F | Grove Bank & Trust | 3.180 | 146 | ||||||
| 2026-02-05 | 13F | Td Private Client Wealth Llc | 7.195 | -13,07 | 330 | -9,12 | ||||
| 2026-01-21 | 13F | Sowell Financial Services LLC | 5.326 | 0,15 | 244 | 5,17 | ||||
| 2026-02-12 | 13F | Trace Wealth Advisors, LLC | 10.839 | -28,55 | 497 | -25,30 | ||||
| 2025-11-05 | 13F | Waterloo Capital, L.P. | 0 | -100,00 | 0 | |||||
| 2026-01-22 | 13F | Colony Family Offices, LLC | 417.956 | 1,41 | 19.163 | 6,21 | ||||
| 2026-01-29 | 13F | St Germain D J Co Inc | 500 | -17,36 | 23 | -15,38 | ||||
| 2026-02-17 | 13F | Raymond James Financial Inc | 369.220 | -0,63 | 16.929 | 4,06 | ||||
| 2026-01-26 | 13F | Mirae Asset Global Investments Co., Ltd. | 11.700 | 0,00 | 536 | 4,69 | ||||
| 2026-01-21 | 13F | Greenleaf Trust | 10.909 | -64,98 | 500 | -63,32 | ||||
| 2026-02-17 | 13F | Susquehanna International Group, Llp | 10.910 | 500 | ||||||
| 2026-02-11 | 13F | Etesian Wealth Advisors, Inc. | 41.676 | -9,41 | 1.911 | -5,16 | ||||
| 2026-02-17 | 13F | Ancora Advisors, LLC | 79 | 4 | ||||||
| 2026-02-11 | 13F | VeraBank, N.A. | 55.327 | -7,67 | 2.537 | -3,32 | ||||
| 2025-11-12 | 13F | Headlands Technologies LLC | 0 | -100,00 | 0 | |||||
| 2026-02-13 | 13F | Morgan Stanley | 1.946.464 | 6,40 | 89.245 | 11,43 | ||||
| 2025-10-22 | 13F | West Paces Advisors Inc. | 0 | -100,00 | 0 | |||||
| 2025-09-25 | NP | ASET - FlexShares Real Assets Allocation Index Fund | 18.495 | 3,01 | 746 | 10,03 | ||||
| 2025-11-14 | 13F | Flow Traders U.s. Llc | 0 | -100,00 | 0 | |||||
| 2026-02-13 | 13F | 1832 Asset Management L.P. | 1.650.224 | 74,44 | 75.663 | 82,69 | ||||
| 2026-02-17 | 13F | Consultiva Wealth Management, Corp. | 1.000 | 0,00 | 46 | 4,65 | ||||
| 2025-10-15 | 13F | Capital Wealth Management, Llc | 0 | -100,00 | 0 | |||||
| 2026-01-20 | 13F | Independence Bank of Kentucky | 915 | -9,85 | 42 | -6,82 | ||||
| 2025-11-10 | 13F | Fortis Advisors, LLC | 0 | -100,00 | 0 | |||||
| 2026-02-17 | 13F | Citadel Advisors Llc | 40.490 | 712,56 | 1.856 | 751,38 | ||||
| 2026-01-26 | 13F | Whittier Trust Co Of Nevada Inc | 68 | 0,00 | 3 | 50,00 | ||||
| 2026-02-09 | 13F | Texas Capital Bank Wealth Management Services Inc | 8.305 | 0,00 | 381 | 4,68 | ||||
| 2026-02-10 | 13F | Basepoint Wealth LLC | 62 | 3 | ||||||
| 2026-02-13 | 13F | Umb Bank N A/mo | 5.277 | 6,33 | 242 | 11,06 | ||||
| 2025-11-13 | 13F | Glenmede Investment Management, LP | 7.411 | 324 | ||||||
| 2026-02-17 | 13F | Align Financial, LLC | 186.289 | 186 | ||||||
| 2026-02-02 | 13F | Cornerstone Planning Group LLC | 73 | 0,00 | 4 | 0,00 | ||||
| 2026-01-20 | 13F | Wall Street Access Asset Management, LLC | 214 | 0,00 | 10 | 0,00 | ||||
| 2026-01-23 | 13F | Rsm Us Wealth Management Llc | 20.211 | 49,90 | 933 | 57,97 | ||||
| 2026-02-13 | 13F | VPR Management LLC | 497.600 | 0,00 | 22.815 | 4,73 | ||||
| 2026-01-14 | 13F | Wealthcare Advisory Partners LLC | 50.847 | -72,45 | 2.331 | -71,15 | ||||
| 2026-02-17 | 13F | Cetera Investment Advisers | 146.761 | 8,57 | 6.729 | 13,72 | ||||
| 2026-01-07 | 13F | Magnus Financial Group LLC | 4.708 | 0,71 | 216 | 5,39 | ||||
| 2025-11-14 | 13F | Sofos Investments, Inc. | 0 | -100,00 | 0 | |||||
| 2026-02-11 | 13F | LPL Financial LLC | 312.214 | 3,72 | 14.315 | 8,63 | ||||
| 2026-02-05 | 13F | Plante Moran Financial Advisors, LLC | 1.046 | 48 | ||||||
| 2026-02-13 | 13F | Monograph Wealth Advisors, Llc | 8.310 | -2,86 | 381 | 1,87 | ||||
| 2026-01-05 | 13F | Park Avenue Securities Llc | 9.277 | 20,90 | 0 | |||||
| 2026-02-02 | 13F | Verus Financial Partners, Inc. | 6.550 | 0,69 | 336 | 17,96 | ||||
| 2026-01-27 | 13F | PFG Advisors | 0 | -100,00 | 0 | |||||
| 2026-01-29 | 13F | Simon Quick Advisors, Llc | 37.286 | 5,48 | 1.710 | 10,47 | ||||
| 2026-01-22 | 13F | Comprehensive Money Management Services LLC | 6.682 | 0,00 | 306 | 4,79 | ||||
| 2026-02-03 | 13F | Sequoia Financial Advisors, LLC | 9.618 | 2,24 | 441 | 7,30 | ||||
| 2026-02-10 | 13F | Bank of New York Mellon Corp | 4.518 | 207 | ||||||
| 2026-01-23 | 13F | Lunt Capital Management, Inc. | 15.655 | -0,67 | 718 | 4,06 | ||||
| 2026-02-17 | 13F | Custos Family Office, LLC | 0 | -100,00 | 0 | |||||
| 2026-01-13 | 13F | First Financial Corp /in/ | 25.965 | 0,00 | 1.190 | 4,75 | ||||
| 2026-02-10 | 13F | Calton & Associates, Inc. | 14.698 | 15,14 | 674 | 20,61 | ||||
| 2026-02-06 | 13F | Global Retirement Partners, LLC | 1.138 | 10,81 | 52 | 18,18 | ||||
| 2026-02-04 | 13F | Community Bank, N.A. | 2.060 | -17,10 | 94 | -12,96 | ||||
| 2026-02-09 | 13F | Key FInancial Inc | 2.032 | -1,02 | 93 | 4,49 | ||||
| 2026-02-12 | 13F | Renaissance Technologies Llc | 5.300 | -67,48 | 243 | -65,92 | ||||
| 2026-02-10 | 13F | IAG Wealth Partners, LLC | 157.262 | 5,20 | 7.210 | 10,18 | ||||
| 2026-02-13 | 13F | Nicolet Advisory Services, Llc | 13.545 | -12,92 | 648 | -5,41 | ||||
| 2026-02-05 | 13F | Hills Bank & Trust Co | 543.984 | -0,59 | 24.942 | 4,11 | ||||
| 2026-02-09 | 13F | Fft Wealth Management Llc | 5.851 | 0,00 | 268 | 4,69 | ||||
| 2026-01-14 | 13F | Spire Wealth Management | 34.891 | -0,20 | 1.600 | 4,51 | ||||
| 2025-11-14 | 13F | Tower Research Capital LLC (TRC) | 0 | -100,00 | 0 | |||||
| 2025-10-24 | 13F | Hemington Wealth Management | 0 | -100,00 | 0 | |||||
| 2026-02-11 | 13F | Cornerstone Advisors Asset Management, Inc | 4.486 | 206 | ||||||
| 2026-02-17 | 13F | Angeles Wealth Management, Llc | 4.664 | 214 | ||||||
| 2026-01-30 | 13F | Us Bancorp \de\ | 5.873 | 4,67 | 269 | 9,80 | ||||
| 2026-01-23 | 13F | Assetmark, Inc | 37 | 236,36 | 2 | |||||
| 2026-02-11 | 13F | Capital Analysts, Inc. | 9.966 | 51,57 | 0 | |||||
| 2026-02-17 | 13F | Clark Capital Management Group, Inc. | 114.928 | 33,27 | 5.269 | 39,58 | ||||
| 2025-11-04 | 13F | Guerra Advisors Inc | 70 | 3 | ||||||
| 2026-01-28 | 13F | Chicago Partners Investment Group LLC | 9.902 | 0,00 | 504 | 16,40 | ||||
| 2026-02-03 | 13F | International Assets Investment Management, Llc | 68 | 3 | ||||||
| 2026-02-05 | 13F | Cambridge Investment Research Advisors, Inc. | 43.404 | 23,88 | 2 | 0,00 | ||||
| 2026-02-05 | 13F | Gamco Investors, Inc. Et Al | 16.502 | -6,30 | 757 | -1,95 | ||||
| 2026-01-20 | 13F | Thurston, Springer, Miller, Herd & Titak, Inc. | 137 | 6 | ||||||
| 2026-02-18 | 13F | Hanlon Investment Management, Inc. | 6.941 | -3,74 | 318 | 0,95 | ||||
| 2026-02-17 | 13F | Blair William & Co/il | 23.890 | 350,16 | 1.095 | 371,98 | ||||
| 2026-02-17 | 13F | Wealth Watch Advisors, INC | 28 | 1 | ||||||
| 2026-01-22 | 13F | Granite Harbor Advisors, Inc. | 28.229 | 0,00 | 1.294 | 4,78 | ||||
| 2026-01-23 | 13F | Avion Wealth | 144 | 0,00 | 0 | |||||
| 2026-02-13 | 13F | Seven Mile Advisory | 9.438 | 0,00 | 433 | 4,60 | ||||
| 2026-02-04 | 13F | Pure Financial Advisors, Inc. | 534.840 | -1,88 | 24.522 | 2,76 | ||||
| 2026-02-17 | 13F | Bienville Capital Management, LLC | 6.343 | 0,43 | 291 | 5,07 | ||||
| 2026-01-12 | 13F | Fiduciary Financial Group, Llc | 9.688 | 4,91 | 444 | 9,90 | ||||
| 2026-01-20 | 13F | Signaturefd, Llc | 1 | 0,00 | 0 | |||||
| 2026-02-13 | 13F | National Bank Of Canada /fi/ | 7.920 | 363 | ||||||
| 2026-02-14 | 13F | Rockefeller Capital Management L.P. | 38.265 | -9,42 | 1.755 | -5,14 | ||||
| 2026-01-23 | 13F | Farther Finance Advisors, LLC | 1.613 | 5,70 | 74 | 10,61 | ||||
| 2026-02-10 | 13F | Envestnet Asset Management Inc | 246.973 | 2,40 | 11.324 | 7,25 | ||||
| 2026-02-06 | 13F | Larson Financial Group LLC | 918 | 0,44 | 42 | 5,00 | ||||
| 2026-02-10 | 13F | Argent Trust Co | 7.103 | -1,59 | 326 | 2,85 | ||||
| 2026-01-26 | 13F | AE Wealth Management LLC | 589 | -23,70 | 27 | -18,18 | ||||
| 2025-10-27 | 13F | Kiker Wealth Management, LLC | 0 | -100,00 | 0 | |||||
| 2026-02-06 | 13F | Cullen/frost Bankers, Inc. | 90.652 | -16,01 | 4.156 | -12,04 | ||||
| 2026-01-16 | 13F | Kendall Capital Management | 24.054 | 8,71 | 1.103 | 13,84 | ||||
| 2026-01-23 | 13F | Legacy Bridge, LLC | 1.182 | 0,00 | 54 | 5,88 | ||||
| 2026-02-03 | 13F | Sageworth Trust Co | 61.217 | 0,00 | 2.807 | 4,70 | ||||
| 2026-02-05 | 13F | AlphaCore Capital LLC | 490 | 22 | ||||||
| 2025-11-13 | 13F | SCS Capital Management LLC | 0 | -100,00 | 0 | |||||
| 2026-02-17 | 13F | Roehl & Yi Investment Advisors, LLC | 138.542 | 6.352 | ||||||
| 2026-02-13 | 13F | Smartleaf Asset Management LLC | 25.981 | -8,21 | 1.199 | -3,31 | ||||
| 2026-01-20 | 13F | Stratos Wealth Partners, LTD. | 34.663 | 2,87 | 1.589 | 7,73 | ||||
| 2026-01-22 | 13F | Vavra Capital Management, LLC | 5.000 | 229 | ||||||
| 2026-02-04 | 13F | Fourth Dimension Wealth, LLC | 13 | 0,00 | 1 | |||||
| 2026-02-11 | 13F | Dorsey & Whitney Trust CO LLC | 10.613 | 0,00 | 487 | 4,74 | ||||
| 2026-01-23 | 13F | Stephenson National Bank & Trust | 208.188 | -3,11 | 9.545 | 1,48 | ||||
| 2026-02-12 | 13F | Principal Securities, Inc. | 8.629 | 35,42 | 396 | 42,09 | ||||
| 2026-02-05 | 13F | Security National Bank | 945 | 43 | ||||||
| 2026-01-30 | 13F | Wealthfront Advisers Llc | 71.827 | 14,59 | 3.293 | 20,01 | ||||
| 2026-01-21 | 13F | Aaron Wealth Advisors LLC | 941.998 | 5,34 | 43.191 | 10,32 | ||||
| 2026-01-26 | 13F | Valmark Advisers, Inc. | 3.592.669 | 1,59 | 164.724 | 6,39 | ||||
| 2026-02-17 | 13F | Awm Capital, Llc | 5.628 | 0,68 | 258 | 5,74 | ||||
| 2026-02-17 | 13F | Fmr Llc | 18.991 | 15,20 | 871 | 20,67 | ||||
| 2026-02-09 | 13F | Hantz Financial Services, Inc. | 0 | -100,00 | 0 | |||||
| 2026-02-09 | 13F | Prospera Financial Services Inc | 7.892 | -0,65 | 362 | 4,03 |