Grundlæggende statistik
| Institutionelle ejere | 182 total, 182 long only, 0 short only, 0 long/short - change of 0,00% MRQ |
| Gennemsnitlig porteføljeallokering | 0.2063 % - change of -9,99% MRQ |
| Institutionelle aktier (lange) | 30.543.111 (ex 13D/G) - change of 0,07MM shares 0,22% MRQ |
| Institutionel værdi (lang) | $ 757.437 USD ($1000) |
Institutionelt ejerskab og aktionærer
The Gabelli Dividend & Income Trust (US:GDV) har 182 institutionelle ejere og aktionærer, der har indsendt 13D/G- eller 13F-formularer til Securities Exchange Commission (SEC). Disse institutioner har i alt 30,543,111 aktier. Største aktionærer omfatter Morgan Stanley, Saba Capital Management, L.P., Karpus Management, Inc., Raymond James Financial Inc, Wells Fargo & Company/mn, Allspring Global Investments Holdings, LLC, GABELLI & Co INVESTMENT ADVISERS, INC., Sit Investment Associates Inc, Bank Of America Corp /de/, and CEFS - Saba Closed-End Funds ETF .
The Gabelli Dividend & Income Trust (NYSE:GDV) institutionel ejerskabsstruktur viser aktuelle positioner i virksomheden efter institutioner og fonde, samt seneste ændringer i positionsstørrelse. Større aktionærer kan omfatte individuelle investorer, investeringsforeninger, hedgefonde eller institutioner. Skema 13D angiver, at investoren besidder (eller besidder) mere end 5 % af virksomheden og har til hensigt (eller har til hensigt at) aktivt at forfølge en ændring i forretningsstrategi. Skema 13G indikerer en passiv investering på over 5%.
The share price as of September 16, 2025 is 27,11 / share. Previously, on September 17, 2024, the share price was 24,13 / share. This represents an increase of 12,35% over that period.

Fondens stemningsscore
Fund Sentiment Score (fka Ownership Accumulation Score) finder de aktier, der bliver mest købt af fonde. Det er resultatet af en sofistikeret, multi-faktor kvantitativ model, der identificerer virksomheder med de højeste niveauer af institutionel akkumulering. Scoringsmodellen bruger en kombination af den samlede stigning i oplyste ejere, ændringerne i porteføljeallokeringer i disse ejere og andre målinger. Tallet går fra 0 til 100, hvor højere tal indikerer et højere niveau af akkumulering for sine jævnaldrende, og 50 er gennemsnittet.
Opdateringsfrekvens: Dagligt
Se Ownership Explorer, som giver en liste over højest rangerende virksomheder.
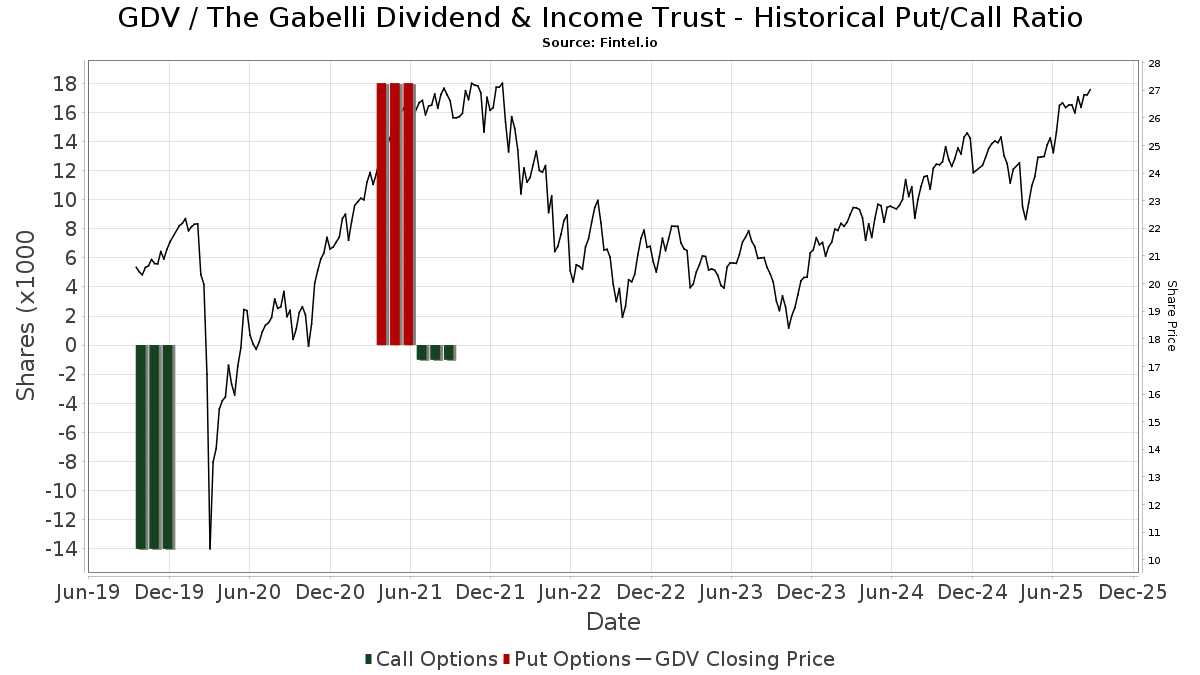
Institutionel Put/Call-forhold
Ud over at indberette standardaktie- og gældsudstedelser skal institutter med mere end 100 mill. aktiver under forvaltning også oplyse deres put- og call-optionsbeholdninger. Da salgsoptioner generelt indikerer negativ stemning, og købsoptioner indikerer positiv stemning, kan vi få en fornemmelse af den overordnede institutionelle stemning ved at plotte forholdet mellem put og kald. Diagrammet til højre viser det historiske put/call-forhold for dette instrument.
Brug af Put/Call Ratio som en indikator for investorernes stemning overvinder en af de vigtigste mangler ved at bruge totalt institutionelt ejerskab, som er, at en betydelig mængde af aktiver under forvaltning investeres passivt for at spore indekser. Passivt forvaltede fonde køber typisk ikke optioner, så indikatoren for put/call-forholdet følger mere nøje følelsen af aktivt forvaltede fonde.
13D/G-arkivering
Vi præsenterer 13D/G ansøgninger separat fra 13F ansøgninger på grund af den forskellige behandling af SEC. 13D/G-ansøgninger kan indgives af grupper af investorer (med én ledende), hvorimod 13F-ansøgninger ikke kan. Dette resulterer i situationer, hvor en investor kan indsende en 13D/G, der rapporterer én værdi for de samlede aktier (der repræsenterer alle de aktier, der ejes af investorgruppen), men derefter indsender en 13F, der rapporterer en anden værdi for de samlede aktier (der udelukkende repræsenterer deres egne) ejendomsret). Det betyder, at aktieejerskab af 13D/G-arkiver og 13F-arkiveringer ofte ikke er direkte sammenlignelige, så vi præsenterer dem separat.
Bemærk: Fra den 16. maj 2021 viser vi ikke længere ejere, der ikke har indsendt en 13D/G inden for det seneste år. Tidligere viste vi den fulde historie af 13D/G-arkiver. Generelt skal enheder, der er forpligtet til at indgive 13D/G-ansøgninger, indgive mindst årligt, før de indsender en afsluttende ansøgning. Dog forlader fonde nogle gange positioner uden at indsende en afsluttende ansøgning (dvs. de afvikler), så visning af den fulde historie resulterede nogle gange i forvirring om det nuværende ejerskab. For at undgå forvirring viser vi nu kun 'aktuelle' ejere - det vil sige - ejere, der har anmeldt inden for det seneste år.
Upgrade to unlock premium data.
| Fil dato | Form | Investor | Forrige Aktier |
Seneste Aktier |
Δ Aktier (Procent) |
Ejendomsret (Procent) |
Δ Ejerskab (Procent) |
|
|---|---|---|---|---|---|---|---|---|
| 2025-03-19 | Saba Capital Management, L.P. | 5,474,107 | 6,324,742 | 15.54 | 7.09 | 16.42 | ||
| 2024-11-07 | MORGAN STANLEY | 5,808,260 | 6,825,012 | 17.51 | 7.60 | 18.75 | ||
| 2024-10-18 | GAMCO INVESTORS, INC. ET AL |
13F og NPORT arkivering
Detaljer om 13F-arkivering er gratis. Detaljer om NP-ansøgninger kræver et premium-medlemskab. Grønne rækker angiver nye positioner. Røde rækker angiver lukkede positioner. Klik på linket ikon for at se den fulde transaktionshistorik.
Opgrader
for at låse premium-data op og eksportere til Excel ![]() .
.
| Fil dato | Kilde | Investor | Type | Gennemsnitlig pris (Øst) |
Aktier | Δ Aktier (%) |
Rapporteret Værdi ($1000) |
Δ Værdi (%) |
Port Alloc (%) |
|
|---|---|---|---|---|---|---|---|---|---|---|
| 2025-07-31 | 13F | Curio Wealth, Llc | 0 | -100,00 | 0 | |||||
| 2025-08-13 | 13F | Russell Investments Group, Ltd. | 1.009 | -5,88 | 26 | 4,00 | ||||
| 2025-08-14 | 13F | Colony Group, LLC | 34.437 | 1,78 | 896 | 9,68 | ||||
| 2025-08-12 | 13F | MAI Capital Management | 89 | 2,30 | 2 | 0,00 | ||||
| 2025-08-14 | 13F | Integrated Wealth Concepts LLC | 78.236 | -2,27 | 2.035 | 5,33 | ||||
| 2025-08-05 | 13F | Huntington National Bank | 0 | |||||||
| 2025-05-12 | 13F | Fmr Llc | 0 | -100,00 | 0 | |||||
| 2025-07-29 | NP | Putnam High Income Securities Fund | 151.344 | 0,00 | 3.759 | 0,13 | ||||
| 2025-08-06 | 13F | Hallmark Capital Management Inc | 1.000 | 0,00 | 26 | 8,33 | ||||
| 2025-08-14 | 13F | Mml Investors Services, Llc | 15.776 | -8,59 | 0 | |||||
| 2025-04-21 | 13F | Nelson, Van Denburg & Campbell Wealth Management Group, LLC | 0 | -100,00 | 0 | |||||
| 2025-08-14 | 13F | McIlrath & Eck, LLC | 1.185 | 0,00 | 31 | 7,14 | ||||
| 2025-08-01 | 13F | Private Wealth Partners, LLC | 113.409 | -9,93 | 2.950 | -2,93 | ||||
| 2025-08-04 | 13F | Assetmark, Inc | 553 | -53,84 | 14 | -50,00 | ||||
| 2025-07-16 | 13F | Dakota Wealth Management | 37.713 | 7,10 | 981 | 15,43 | ||||
| 2025-08-14 | 13F | Capstone Investment Advisors, Llc | 262.242 | 0,00 | 6.821 | 7,79 | ||||
| 2025-07-10 | 13F | Stolper Co | 41.561 | 1,68 | 1 | |||||
| 2025-08-07 | 13F | Readystate Asset Management Lp | 27.172 | 53,71 | 707 | 65,73 | ||||
| 2025-08-13 | 13F | Baird Financial Group, Inc. | 11.675 | -7,92 | 304 | -0,66 | ||||
| 2025-08-04 | 13F | Wolverine Asset Management Llc | 31.236 | 67,49 | 812 | 80,44 | ||||
| 2025-07-21 | 13F | Quent Capital, LLC | 0 | -100,00 | 0 | |||||
| 2025-08-14 | 13F | Wetherby Asset Management Inc | 7.736 | 201 | ||||||
| 2025-07-08 | 13F | Parallel Advisors, LLC | 1.874 | 49 | ||||||
| 2025-08-13 | 13F | Jones Financial Companies Lllp | 0 | -100,00 | 0 | |||||
| 2025-07-24 | 13F | IFP Advisors, Inc | 1.308 | 8,37 | 34 | 17,24 | ||||
| 2025-08-08 | 13F | Cetera Investment Advisers | 38.298 | -7,44 | 996 | -0,20 | ||||
| 2025-07-14 | 13F | Park Avenue Securities Llc | 83.531 | -4,57 | 2 | 0,00 | ||||
| 2025-08-11 | 13F | Private Advisor Group, LLC | 188.742 | 3,41 | 4.909 | 11,47 | ||||
| 2025-07-17 | 13F | Sound Income Strategies, LLC | 3.830 | 0,47 | 100 | 8,79 | ||||
| 2025-08-14 | 13F | Raymond James Financial Inc | 1.359.134 | 2,34 | 35.351 | 10,31 | ||||
| 2025-08-14 | 13F | Warren Averett Asset Management, LLC | 33.186 | -3,37 | 863 | 4,23 | ||||
| 2025-08-13 | 13F | Thomas J. Herzfeld Advisors, Inc. | 233 | 1,75 | 6 | 20,00 | ||||
| 2025-08-06 | 13F | Wedbush Securities Inc | 11.120 | -16,21 | 0 | |||||
| 2025-08-14 | 13F | Aqr Capital Management Llc | 11.739 | 305 | ||||||
| 2025-08-14 | 13F | Css Llc/il | 32.657 | -32,26 | 849 | -27,00 | ||||
| 2025-07-11 | 13F | Farther Finance Advisors, LLC | 1.831 | 38,08 | 48 | 46,88 | ||||
| 2025-07-23 | 13F | Morton Capital Management LLC/CA | 14.138 | 0,07 | 368 | 7,94 | ||||
| 2025-07-10 | 13F | Wealth Enhancement Advisory Services, Llc | 159.224 | -5,69 | 4.240 | 4,10 | ||||
| 2025-07-18 | 13F | Trust Co Of Vermont | 500 | 0,00 | 13 | 8,33 | ||||
| 2025-08-04 | 13F | Spire Wealth Management | 408 | 0,00 | 11 | 11,11 | ||||
| 2025-08-14 | 13F | Cnh Partners Llc | 0 | -100,00 | 0 | |||||
| 2025-08-13 | 13F | Guggenheim Capital Llc | 55.863 | 0,53 | 1.453 | 8,36 | ||||
| 2025-07-28 | 13F | Harbour Investments, Inc. | 1.250 | 1,71 | 33 | 10,34 | ||||
| 2025-08-12 | 13F | Bokf, Na | 0 | -100,00 | 0 | |||||
| 2025-08-14 | 13F | Wells Fargo & Company/mn | 1.261.289 | -10,48 | 32.806 | -3,51 | ||||
| 2025-08-13 | 13F | First Trust Advisors Lp | 107.154 | 2,03 | 2.787 | 9,98 | ||||
| 2025-08-06 | 13F | Smh Capital Advisors Inc | 9.046 | -3,19 | 235 | 4,44 | ||||
| 2025-08-14 | 13F | Royal Bank Of Canada | 555.700 | 0,81 | 14.454 | 8,66 | ||||
| 2025-08-11 | 13F | HighTower Advisors, LLC | 61.727 | -18,65 | 1.606 | -12,30 | ||||
| 2025-08-11 | 13F | Nations Financial Group Inc, /ia/ /adv | 13.442 | -5,30 | 350 | 2,05 | ||||
| 2025-08-05 | 13F | Tsfg, Llc | 183 | 0,00 | 0 | |||||
| 2025-08-14 | 13F | Private Wealth Advisors, LLC | 9.412 | 1,51 | 245 | 9,42 | ||||
| 2025-05-08 | 13F | Us Bancorp \de\ | 0 | -100,00 | 0 | |||||
| 2025-08-08 | 13F | City Of London Investment Management Co Ltd | 36.176 | -20,76 | 941 | -14,62 | ||||
| 2025-07-25 | 13F | Concurrent Investment Advisors, LLC | 0 | -100,00 | 0 | |||||
| 2025-08-14 | 13F | Federation des caisses Desjardins du Quebec | 1.000 | 0,00 | 26 | 8,33 | ||||
| 2025-07-15 | 13F | Fifth Third Bancorp | 1.000 | 0,00 | 26 | 8,33 | ||||
| 2025-08-18 | 13F | Geneos Wealth Management Inc. | 5.754 | 151,05 | 150 | 170,91 | ||||
| 2025-08-13 | 13F | Cresset Asset Management, LLC | 10.926 | 0,25 | 284 | 8,40 | ||||
| 2025-07-11 | 13F | Pinnacle Bancorp, Inc. | 1.433 | 37 | ||||||
| 2025-08-07 | 13F | Vista Investment Partners Ii, Llc | 11.656 | -1,03 | 303 | 6,69 | ||||
| 2025-08-05 | 13F | Shaker Financial Services, LLC | 0 | -100,00 | 0 | |||||
| 2025-08-25 | 13F | Silverlake Wealth Management Llc | 80.933 | 3,18 | 2.105 | 11,26 | ||||
| 2025-07-30 | 13F | Gables Capital Management Inc. | 17.300 | -9,78 | 450 | -2,81 | ||||
| 2025-07-25 | 13F | Allspring Global Investments Holdings, LLC | 632.865 | 38,04 | 16.461 | 48,80 | ||||
| 2025-07-30 | 13F | Brookstone Capital Management | 12.889 | -4,27 | 335 | 3,40 | ||||
| 2025-07-17 | 13F | Oakworth Capital, Inc. | 6.067 | 0,00 | 158 | 7,53 | ||||
| 2025-08-27 | NP | Special Opportunities Fund, Inc. | 133.595 | 0,00 | 3.475 | 7,79 | ||||
| 2025-08-14 | 13F | Bulldog Investors, LLP | 301.028 | -0,07 | 7.830 | 7,72 | ||||
| 2025-07-24 | 13F | Aurora Private Wealth, Inc. | 12.335 | -3,10 | 0 | |||||
| 2025-08-12 | 13F | SRS Capital Advisors, Inc. | 4.003 | 0,00 | 104 | 8,33 | ||||
| 2025-08-14 | 13F | Sit Investment Associates Inc | 622.556 | -30,89 | 16 | -23,81 | ||||
| 2025-07-31 | 13F | 180 Wealth Advisors, Llc | 42.512 | -1,24 | 1.106 | 6,45 | ||||
| 2025-08-14 | 13F | Sargent Investment Group, LLC | 12.000 | -28,36 | 314 | -22,28 | ||||
| 2025-09-04 | 13F/A | Advisor Group Holdings, Inc. | 43.519 | 16,46 | 1.132 | 25,64 | ||||
| 2025-08-04 | 13F | Horizon Wealth Management, LLC | 8.854 | 1,02 | 230 | 9,00 | ||||
| 2025-07-31 | 13F | Oppenheimer & Co Inc | 165.905 | 4,22 | 4.315 | 12,34 | ||||
| 2025-08-07 | 13F | Kestra Private Wealth Services, Llc | 12.230 | 21,09 | 318 | 30,86 | ||||
| 2025-08-11 | 13F | Anderson Financial Strategies, LLC | 0 | -100,00 | 0 | |||||
| 2025-08-15 | 13F | Prevail Innovative Wealth Advisors, Llc | 70.738 | 24,58 | 1.840 | 34,23 | ||||
| 2025-08-14 | 13F | MGB Wealth Management, LLC | 8.550 | -50,00 | 222 | -46,12 | ||||
| 2025-07-29 | 13F | Salomon & Ludwin, LLC | 548 | 0,00 | 14 | 7,69 | ||||
| 2025-08-05 | 13F | Sigma Planning Corp | 19.924 | -1,19 | 518 | 6,58 | ||||
| 2025-08-19 | 13F | Cape Investment Advisory, Inc. | 150 | 0,00 | 4 | 0,00 | ||||
| 2025-07-17 | 13F | Avondale Wealth Management | 1.300 | 0,00 | 34 | 6,45 | ||||
| 2025-08-14 | 13F | UBS Group AG | 127.602 | -2,55 | 3.319 | 5,03 | ||||
| 2025-08-15 | 13F | Provenance Wealth Advisors, LLC | 1.685 | -70,77 | 44 | -69,06 | ||||
| 2025-08-14 | 13F | Bank Of America Corp /de/ | 620.583 | -4,95 | 16.141 | 2,46 | ||||
| 2025-05-07 | 13F | Mb, Levis & Associates, Llc | 0 | -100,00 | 0 | -100,00 | ||||
| 2025-08-04 | 13F | Flagship Harbor Advisors, Llc | 13.496 | -12,07 | 351 | -5,14 | ||||
| 2025-08-14 | 13F | Mariner, LLC | 13.225 | 17,48 | 344 | 26,57 | ||||
| 2025-07-10 | 13F | Contravisory Investment Management, Inc. | 18.300 | 0,00 | 476 | 7,71 | ||||
| 2025-08-14 | 13F | Cohen & Steers, Inc. | 296.886 | 6,45 | 8 | 16,67 | ||||
| 2025-07-24 | 13F | MSH Capital Advisors LLC | 89.283 | 7,53 | 2.322 | 15,93 | ||||
| 2025-07-23 | 13F | Abel Hall, LLC | 10.560 | 275 | ||||||
| 2025-08-08 | 13F | Creative Planning | 36.740 | 88,30 | 956 | 103,19 | ||||
| 2025-04-22 | 13F | Jfs Wealth Advisors, Llc | 0 | -100,00 | 0 | -100,00 | ||||
| 2025-07-17 | 13F | Janney Montgomery Scott LLC | 44.126 | -7,99 | 1 | 0,00 | ||||
| 2025-08-07 | 13F | Gs Investments, Inc. | 1.331 | 0,00 | 35 | 6,25 | ||||
| 2025-08-14 | 13F | Comerica Bank | 60.621 | -6,29 | 1.577 | 0,96 | ||||
| 2025-08-13 | 13F | Summit Financial, LLC | 60.389 | 38,29 | 1.571 | 49,10 | ||||
| 2025-07-07 | 13F | Centurion Wealth Management LLC | 9.122 | 0,00 | 237 | 7,73 | ||||
| 2025-07-21 | 13F | Crews Bank & Trust | 419 | 0,00 | 11 | 0,00 | ||||
| 2025-07-29 | 13F | International Assets Investment Management, Llc | 14.400 | 0,00 | 375 | 7,78 | ||||
| 2025-08-19 | 13F | National Asset Management, Inc. | 9.836 | -16,21 | 256 | -9,89 | ||||
| 2025-07-25 | 13F | Integrated Capital Management, Inc. | 15.628 | 0,44 | 406 | 8,27 | ||||
| 2025-07-24 | NP | CEFS - Saba Closed-End Funds ETF | 584.150 | 0,00 | 14.510 | 0,12 | ||||
| 2025-08-05 | 13F | Mission Wealth Management, Lp | 11.500 | 0,00 | 299 | 7,94 | ||||
| 2025-07-15 | 13F | MCF Advisors LLC | 646 | 0,00 | 17 | 6,67 | ||||
| 2025-08-07 | 13F | Commerce Bank | 9.096 | 0,00 | 237 | 7,76 | ||||
| 2025-07-30 | 13F | D.a. Davidson & Co. | 35.010 | -2,99 | 911 | 4,60 | ||||
| 2025-08-14 | 13F | GWM Advisors LLC | 36.450 | -1,10 | 948 | 6,64 | ||||
| 2025-08-06 | 13F | Commonwealth Equity Services, Llc | 56.709 | 1,88 | 1 | 0,00 | ||||
| 2025-07-09 | 13F | Massmutual Trust Co Fsb/adv | 133 | -63,56 | 3 | -62,50 | ||||
| 2025-07-21 | 13F | Ameritas Advisory Services, LLC | 200 | 5 | ||||||
| 2025-07-30 | 13F | Bogart Wealth, LLC | 4.184 | 0,00 | 109 | 8,00 | ||||
| 2025-08-05 | 13F | Key FInancial Inc | 772 | 0,00 | 20 | 11,11 | ||||
| 2025-08-04 | 13F | Live Oak Private Wealth LLC | 91.222 | 0,00 | 2.373 | 7,77 | ||||
| 2025-08-12 | 13F | Proequities, Inc. | 0 | 0 | ||||||
| 2025-05-02 | 13F | Larson Financial Group LLC | 0 | -100,00 | 0 | -100,00 | ||||
| 2025-08-05 | 13F | GPS Wealth Strategies Group, LLC | 3.209 | 0,00 | 83 | 7,79 | ||||
| 2025-08-14 | 13F | Quantedge Capital Pte Ltd | 127.241 | -16,59 | 3.310 | -10,08 | ||||
| 2025-08-14 | 13F | Glen Eagle Advisors, LLC | 300 | 0,00 | 8 | 0,00 | ||||
| 2025-08-27 | NP | RYDEX VARIABLE TRUST - Multi-Hedge Strategies Fund Variable Annuity | 1.389 | -25,36 | 36 | -18,18 | ||||
| 2025-07-29 | 13F | Activest Wealth Management | 9.780 | -33,28 | 254 | -28,05 | ||||
| 2025-08-04 | 13F | Center for Financial Planning, Inc. | 1.000 | 0,00 | 26 | 8,33 | ||||
| 2025-08-08 | 13F | Pnc Financial Services Group, Inc. | 28.550 | -39,49 | 743 | -34,80 | ||||
| 2025-08-14 | 13F/A | Rockefeller Capital Management L.P. | 236.958 | 17,75 | 6.163 | 26,94 | ||||
| 2025-07-18 | 13F | Institute for Wealth Management, LLC. | 19.707 | 0,00 | 513 | 7,79 | ||||
| 2025-08-14 | 13F | Riggs Asset Managment Co. Inc. | 325 | -35,00 | 8 | -33,33 | ||||
| 2025-07-08 | 13F | Morris Retirement Advisors, LLC | 9.310 | 0,91 | 242 | 9,01 | ||||
| 2025-08-15 | 13F | Morgan Stanley | 8.359.874 | 3,47 | 217.440 | 11,53 | ||||
| 2025-08-08 | 13F | Hartland & Co., LLC | 800 | 0,00 | 21 | 5,26 | ||||
| 2025-08-14 | 13F | Harwood Advisory Group, LLC | 848 | 0,00 | 22 | 10,00 | ||||
| 2025-08-13 | 13F | Smith, Moore & Co. | 13.457 | 0,04 | 350 | 8,02 | ||||
| 2025-07-22 | 13F | Kessler Investment Group, LLC | 5 | 0,00 | 0 | |||||
| 2025-08-04 | 13F | Creative Financial Designs Inc /adv | 1.010 | 0,00 | 26 | 8,33 | ||||
| 2025-08-14 | 13F | 1607 Capital Partners, LLC | 117.327 | -7,34 | 3.052 | -0,13 | ||||
| 2025-06-26 | NP | Templeton Global Income Fund | 59.672 | 0,00 | 1.405 | -5,71 | ||||
| 2025-08-01 | 13F | Envestnet Asset Management Inc | 110.488 | -3,11 | 2.874 | 4,43 | ||||
| 2025-07-24 | 13F | Capital Advisors, Ltd. LLC | 679 | 1,19 | 0 | |||||
| 2025-07-21 | 13F | Barrett & Company, Inc. | 64 | 1,59 | 2 | 0,00 | ||||
| 2025-08-07 | 13F | Hennion & Walsh Asset Management, Inc. | 54.959 | 136,81 | 1.429 | 155,18 | ||||
| 2025-08-19 | 13F | Newbridge Financial Services Group, Inc. | 2.300 | 60 | ||||||
| 2025-05-13 | 13F | Elequin Capital Lp | 0 | -100,00 | 0 | |||||
| 2025-08-06 | 13F | Golden State Wealth Management, LLC | 3 | 0 | ||||||
| 2025-08-14 | 13F | Susquehanna International Group, Llp | 0 | -100,00 | 0 | |||||
| 2025-08-14 | 13F | Karpus Management, Inc. | 1.788.008 | 0,86 | 46.506 | 8,72 | ||||
| 2025-07-22 | 13F | DAVENPORT & Co LLC | 16.448 | -2,37 | 428 | 5,17 | ||||
| 2025-08-14 | 13F | Stifel Financial Corp | 248.454 | 1,03 | 6.462 | 8,90 | ||||
| 2025-08-07 | 13F | Allworth Financial LP | 17.085 | 66,47 | 444 | 86,55 | ||||
| 2025-08-12 | 13F | Steward Partners Investment Advisory, Llc | 298.809 | 0,73 | 7.772 | 8,58 | ||||
| 2025-08-12 | 13F | LPL Financial LLC | 502.576 | 12,16 | 13.072 | 20,89 | ||||
| 2025-08-28 | NP | Cohen & Steers Closed-end Opportunity Fund, Inc. | 196.886 | 10,06 | 5.121 | 18,65 | ||||
| 2025-08-13 | 13F | Jones Road Capital Management, L.p. | 0 | -100,00 | 0 | |||||
| 2025-08-14 | 13F | Dymon Asia Capital (singapore) Pte. Ltd. | 11.933 | 310 | ||||||
| 2025-07-18 | 13F | Consolidated Portfolio Review Corp | 12.225 | -56,51 | 318 | -53,24 | ||||
| 2025-08-12 | 13F | Cutter & CO Brokerage, Inc. | 0 | -100,00 | 0 | |||||
| 2025-07-15 | 13F | North Star Investment Management Corp. | 35.020 | -4,92 | 911 | 2,48 | ||||
| 2025-08-14 | 13F | Matrix Private Capital Group Llc | 7.828 | 204 | ||||||
| 2025-08-08 | 13F | Kingsview Wealth Management, LLC | 7.943 | 207 | ||||||
| 2025-07-24 | 13F | Eastern Bank | 1.432 | 0,00 | 37 | 8,82 | ||||
| 2025-08-13 | 13F | GABELLI & Co INVESTMENT ADVISERS, INC. | 626.000 | 0,00 | 16.282 | 7,79 | ||||
| 2025-07-31 | 13F | Oak Harbor Wealth Partners, Llc | 10.300 | 0,00 | 268 | 7,66 | ||||
| 2025-07-25 | 13F | Cwm, Llc | 5.899 | 11,83 | 0 | |||||
| 2025-08-12 | 13F | Jpmorgan Chase & Co | 2.174 | -26,23 | 57 | -21,13 | ||||
| 2025-07-28 | 13F | BRYN MAWR TRUST Co | 7.367 | 0,00 | 192 | 7,91 | ||||
| 2025-08-08 | 13F | Cedar Wealth Management, LLC | 334 | 9 | ||||||
| 2025-04-16 | 13F/A | Western Wealth Management, LLC | 13.000 | 0,00 | 314 | -1,26 | ||||
| 2025-08-14 | 13F | Ancora Advisors, LLC | 6.328 | -7,32 | 165 | 0,00 | ||||
| 2025-07-11 | 13F | Quad-Cities Investment Group, LLC | 9.395 | 1,48 | 244 | 9,42 | ||||
| 2025-08-13 | 13F | Gamco Investors, Inc. Et Al | 10.000 | -39,71 | 260 | -35,00 | ||||
| 2025-08-11 | 13F | Blue Bell Private Wealth Management, Llc | 118.366 | 5,08 | 3.079 | 13,25 | ||||
| 2025-08-11 | 13F | Principal Securities, Inc. | 0 | -100,00 | 0 | |||||
| 2025-07-17 | 13F | Vermillion Wealth Management, Inc. | 1.109 | 29 | ||||||
| 2025-08-14 | 13F | Logan Stone Capital, LLC | 0 | -100,00 | 0 | |||||
| 2025-07-21 | 13F | Ashton Thomas Securities, Llc | 28.050 | -11,09 | 730 | -4,20 | ||||
| 2025-05-08 | 13F | Plante Moran Financial Advisors, LLC | 0 | -100,00 | 0 | |||||
| 2025-08-14 | 13F | Verition Fund Management LLC | 133.426 | 3.470 | ||||||
| 2025-08-13 | 13F | Constitution Capital LLC | 8.300 | 0,00 | 216 | 7,50 | ||||
| 2025-07-28 | 13F | Axxcess Wealth Management, Llc | 8.429 | 0,64 | 219 | 8,42 | ||||
| 2025-04-30 | 13F | Pineridge Advisors LLC | 0 | -100,00 | 0 | |||||
| 2025-07-08 | 13F | Nbc Securities, Inc. | 4.130 | 0,00 | 0 | |||||
| 2025-08-29 | 13F | Evolution Wealth Management Inc. | 623 | 16 | ||||||
| 2025-07-08 | 13F/A | Salem Investment Counselors Inc | 1.979 | 0,00 | 51 | 8,51 | ||||
| 2025-08-12 | 13F | Gladstone Institutional Advisory LLC | 7.964 | 207 | ||||||
| 2025-08-14 | 13F | Saba Capital Management, L.P. | 6.768.149 | 6,61 | 176.040 | 14,91 | ||||
| 2025-08-12 | 13F | Advisors Asset Management, Inc. | 497.372 | 0,62 | 12.937 | 8,46 | ||||
| 2025-07-25 | NP | FCEF - First Trust CEF Income Opportunity ETF This fund is a listed as child fund of First Trust Advisors Lp and if that institution has disclosed ownership in this security, then these positions will not be double counted when calculating total shares and total value | 54.161 | 4,27 | 1.345 | 4,43 | ||||
| 2025-04-23 | 13F | Bessemer Group Inc | 0 | -100,00 | 0 | |||||
| 2025-08-15 | 13F | Kestra Advisory Services, LLC | 47.552 | -1,64 | 1.237 | 6,00 | ||||
| 2025-07-31 | 13F | Cambridge Investment Research Advisors, Inc. | 186.749 | -3,32 | 5 | 0,00 | ||||
| 2025-08-11 | 13F | WPG Advisers, LLC | 1.111 | 0,63 | 29 | 7,69 | ||||
| 2025-07-16 | 13F | Kennedy Investment Group | 43.214 | 0,26 | 1.124 | 8,08 | ||||
| 2025-08-13 | 13F | Level Four Advisory Services, Llc | 15.320 | 11,86 | 398 | 20,61 | ||||
| 2025-08-06 | 13F | Maltin Wealth Management, Inc. | 24.229 | -8,05 | 630 | -0,79 | ||||
| 2025-07-29 | 13F | Stephens Inc /ar/ | 33.253 | -4,10 | 865 | 3,35 | ||||
| 2025-08-27 | NP | RYMSX - Guggenheim Multi-Hedge Strategies Fund Class P | 828 | -42,14 | 22 | -38,24 | ||||
| 2025-08-14 | 13F | Wiley Bros.-aintree Capital, Llc | 52.054 | 78,26 | 1.354 | 92,19 | ||||
| 2025-07-16 | 13F | American National Bank | 0 | -100,00 | 0 | |||||
| 2025-08-12 | 13F | Global Retirement Partners, LLC | 459 | 2,46 | 12 | 10,00 | ||||
| 2025-08-04 | 13F | Waterfront Wealth Inc. | 9.415 | 0,00 | 245 | 7,49 | ||||
| 2025-05-22 | NP | ADANX - AQR Diversified Arbitrage Fund Class N | 30.657 | -50,55 | 740 | -50,63 | ||||
| 2025-08-06 | 13F | Prospera Financial Services Inc | 66.347 | 211,72 | 1.726 | 236,26 | ||||
| 2025-08-01 | 13F | Transcend Wealth Collective, Llc | 0 | -100,00 | 0 | |||||
| 2025-07-18 | 13F | Truist Financial Corp | 15.273 | -1,33 | 397 | 6,43 | ||||
| 2025-07-30 | 13F | Cullen/frost Bankers, Inc. | 16.650 | 0,00 | 433 | 7,98 | ||||
| 2025-08-08 | 13F | Avantax Advisory Services, Inc. | 16.779 | -3,27 | 436 | 4,31 | ||||
| 2025-07-24 | 13F | Gilliland Jeter Wealth Management LLC | 25.383 | 1,20 | 660 | 9,09 |