Grundlæggende statistik
| Institutionelle ejere | 245 total, 245 long only, 0 short only, 0 long/short - change of 16,11% MRQ |
| Gennemsnitlig porteføljeallokering | 0.4619 % - change of 15,24% MRQ |
| Institutionelle aktier (lange) | 71.371.449 (ex 13D/G) - change of 22,39MM shares 45,73% MRQ |
| Institutionel værdi (lang) | $ 2.398.615 USD ($1000) |
Institutionelt ejerskab og aktionærer
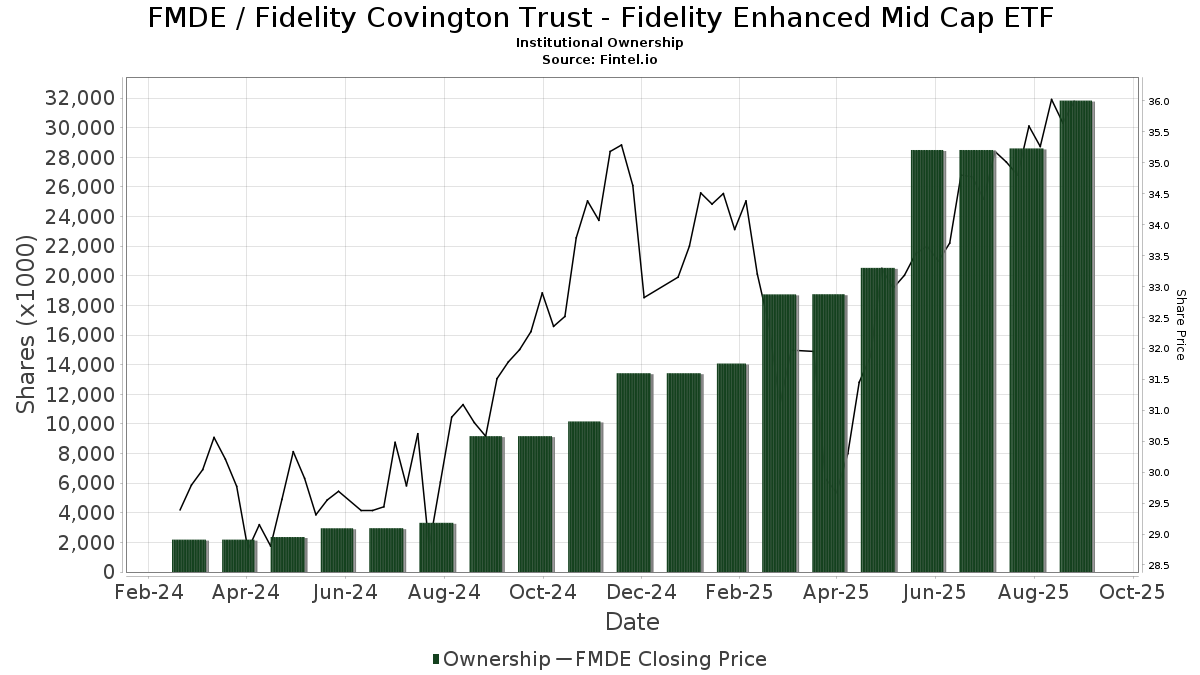
Fidelity Covington Trust - Fidelity Enhanced Mid Cap ETF (US:FMDE) har 245 institutionelle ejere og aktionærer, der har indsendt 13D/G- eller 13F-formularer til Securities Exchange Commission (SEC). Disse institutioner har i alt 71,371,449 aktier. Største aktionærer omfatter Ameriprise Financial Inc, Fmr Llc, Northwestern Mutual Wealth Management Co, LPL Financial LLC, Wells Fargo & Company/mn, Raymond James Financial Inc, Thrivent Financial For Lutherans, Commonwealth Equity Services, Llc, Advisor Group Holdings, Inc., and Capital Analysts, Inc. .
Fidelity Covington Trust - Fidelity Enhanced Mid Cap ETF (ARCA:FMDE) institutionel ejerskabsstruktur viser aktuelle positioner i virksomheden efter institutioner og fonde, samt seneste ændringer i positionsstørrelse. Større aktionærer kan omfatte individuelle investorer, investeringsforeninger, hedgefonde eller institutioner. Skema 13D angiver, at investoren besidder (eller besidder) mere end 5 % af virksomheden og har til hensigt (eller har til hensigt at) aktivt at forfølge en ændring i forretningsstrategi. Skema 13G indikerer en passiv investering på over 5%.
The share price as of April 20, 2026 is 38,64 / share. Previously, on April 21, 2025, the share price was 29,11 / share. This represents an increase of 32,74% over that period.
Fondens stemningsscore
Fund Sentiment Score (fka Ownership Accumulation Score) finder de aktier, der bliver mest købt af fonde. Det er resultatet af en sofistikeret, multi-faktor kvantitativ model, der identificerer virksomheder med de højeste niveauer af institutionel akkumulering. Scoringsmodellen bruger en kombination af den samlede stigning i oplyste ejere, ændringerne i porteføljeallokeringer i disse ejere og andre målinger. Tallet går fra 0 til 100, hvor højere tal indikerer et højere niveau af akkumulering for sine jævnaldrende, og 50 er gennemsnittet.
Opdateringsfrekvens: Dagligt
Se Ownership Explorer, som giver en liste over højest rangerende virksomheder.
AI+ Ask Fintel’s AI assistant about Fidelity Covington Trust - Fidelity Enhanced Mid Cap ETF.
Select a question to share a public post with an AI-crafted answer.
Thinking of good questions…
Institutionel Put/Call-forhold
Ud over at indberette standardaktie- og gældsudstedelser skal institutter med mere end 100 mill. aktiver under forvaltning også oplyse deres put- og call-optionsbeholdninger. Da salgsoptioner generelt indikerer negativ stemning, og købsoptioner indikerer positiv stemning, kan vi få en fornemmelse af den overordnede institutionelle stemning ved at plotte forholdet mellem put og kald. Diagrammet til højre viser det historiske put/call-forhold for dette instrument.
Brug af Put/Call Ratio som en indikator for investorernes stemning overvinder en af de vigtigste mangler ved at bruge totalt institutionelt ejerskab, som er, at en betydelig mængde af aktiver under forvaltning investeres passivt for at spore indekser. Passivt forvaltede fonde køber typisk ikke optioner, så indikatoren for put/call-forholdet følger mere nøje følelsen af aktivt forvaltede fonde.
13F og NPORT arkivering
Detaljer om 13F-arkivering er gratis. Detaljer om NP-ansøgninger kræver et premium-medlemskab. Grønne rækker angiver nye positioner. Røde rækker angiver lukkede positioner. Klik på linket ikon for at se den fulde transaktionshistorik.
Opgrader
for at låse premium-data op og eksportere til Excel ![]() .
.
| Fil dato | Kilde | Investor | Type | Gennemsnitlig pris (Øst) |
Aktier | Δ Aktier (%) |
Rapporteret Værdi ($1000) |
Δ Værdi (%) |
Port Alloc (%) |
|
|---|---|---|---|---|---|---|---|---|---|---|
| 2026-01-23 | 13F | Assetmark, Inc | 335 | -44,17 | 12 | -42,86 | ||||
| 2026-01-27 | 13F | Belpointe Asset Management LLC | 0 | -100,00 | 0 | |||||
| 2026-02-17 | 13F | Royal Bank Of Canada | 535.961 | 143,84 | 19.498 | 145,38 | ||||
| 2026-02-02 | 13F | Mutual Advisors, LLC | 5.655 | 206 | ||||||
| 2026-02-17 | 13F | Stokes Family Office, LLC | 0 | -100,00 | 0 | |||||
| 2026-01-23 | 13F | Patten Group, Inc. | 10.647 | 51,99 | 387 | 52,96 | ||||
| 2026-01-20 | 13F | Stratos Wealth Partners, LTD. | 16.702 | 104,68 | 608 | 106,46 | ||||
| 2026-02-13 | 13F | Pathstone Holdings, LLC | 192.230 | 3,32 | 6.993 | 3,99 | ||||
| 2026-01-29 | 13F | D.a. Davidson & Co. | 149.430 | 8,41 | 5.436 | 9,11 | ||||
| 2026-02-04 | 13F | LRI Investments, LLC | 54 | 0,00 | 2 | 0,00 | ||||
| 2026-01-27 | 13F | Summit Financial Wealth Advisors, LLC | 539.497 | 19.627 | ||||||
| 2026-02-05 | 13F | Cornerstone Wealth Management, LLC | 35.630 | 2,58 | 1.296 | 3,27 | ||||
| 2026-02-11 | 13F | O'shaughnessy Asset Management, Llc | 1.529 | 0,00 | 56 | 0,00 | ||||
| 2025-11-14 | 13F | Mount Yale Investment Advisors, LLC | 0 | -100,00 | 0 | -100,00 | ||||
| 2026-04-07 | 13F | CoreCap Advisors, LLC | 1.902 | -0,05 | 68 | -1,45 | ||||
| 2026-01-27 | 13F | PFG Advisors | 99.067 | -4,38 | 3.604 | -3,77 | ||||
| 2026-01-30 | 13F | Us Bancorp \de\ | 291 | 11 | ||||||
| 2026-02-12 | 13F | Mark Sheptoff Financial Planning, Llc | 336 | 0,30 | 12 | 0,00 | ||||
| 2026-04-20 | 13F | Kfg Wealth Management, Llc | 894.618 | 42,18 | 32.170 | 40,54 | ||||
| 2026-02-13 | 13F | Quattro Advisors LLC | 1.173 | 43 | ||||||
| 2026-01-23 | 13F | Avion Wealth | 64 | 0 | ||||||
| 2026-04-08 | 13F | First Heartland Consultants, Inc. | 136.466 | -22,50 | 4.907 | -23,40 | ||||
| 2026-02-12 | 13F | Great Valley Advisor Group, Inc. | 57.900 | 2.107 | ||||||
| 2026-02-12 | 13F | Johnson Financial Group, Inc. | 3.200 | 0,00 | 116 | 0,87 | ||||
| 2026-02-17 | 13F | Twin Focus Capital Partners, Llc | 16.546 | 0,00 | 602 | 0,50 | ||||
| 2026-04-17 | 13F | Investment Advisory Services Inc /tx /adv | 74.407 | 70,58 | 2.676 | 68,66 | ||||
| 2026-02-12 | 13F | Principal Securities, Inc. | 14.448 | 29,37 | 526 | 30,27 | ||||
| 2026-02-17 | 13F | Regal Investment Advisors LLC | 28.729 | 300,85 | 1.045 | 303,47 | ||||
| 2026-01-29 | 13F | Concord Wealth Partners | 283 | -33,41 | 10 | -33,33 | ||||
| 2026-04-14 | 13F | FMA Wealth Management, LLC | 88.552 | 0,13 | 3.184 | -1,03 | ||||
| 2026-02-13 | 13F | Level Four Advisory Services, Llc | 116.045 | 5,66 | 4.222 | 6,32 | ||||
| 2025-11-13 | 13F | Texas Capital Bancshares Inc/tx | 585 | 21 | ||||||
| 2026-02-10 | 13F | Godfrey Financial Associates, Inc. | 5.526 | 201 | ||||||
| 2026-02-05 | 13F | Thrivent Financial For Lutherans | 2.324.110 | 85 | ||||||
| 2026-02-17 | 13F | Creative Planning | 16.141 | -11,52 | 587 | -10,93 | ||||
| 2026-02-18 | 13F | Garton & Associates Financial Advisors LLC | 346 | 13 | ||||||
| 2026-04-15 | 13F | Valley National Advisers Inc | 113.326 | 4 | ||||||
| 2026-01-21 | 13F | Flagship Harbor Advisors, Llc | 14.662 | 22,09 | 533 | 22,81 | ||||
| 2026-01-27 | 13F | Benchmark Financial, LLC | 5.726 | 208 | ||||||
| 2026-02-13 | 13F | Cornerstone Financial Management LLC | 197 | 7 | ||||||
| 2026-04-15 | 13F | Fifth Third Securities, Inc. | 38.335 | 2,09 | 1.379 | 0,88 | ||||
| 2026-02-17 | 13F | IHT Wealth Management, LLC | 34.869 | 1.269 | ||||||
| 2026-02-17 | 13F | Waterway Wealth Management, LLC | 376.439 | 3,71 | 12.940 | 4,53 | ||||
| 2026-02-10 | 13F | Goldman Sachs Group Inc | 104.460 | 3.800 | ||||||
| 2026-03-02 | 13F | Clearwave Capital, LLC | 51.309 | 1.867 | ||||||
| 2026-02-03 | 13F | Coston, McIsaac & Partners | 687 | -32,32 | 0 | |||||
| 2026-04-06 | 13F | InTrack Investment Management Inc | 60.448 | -6,57 | 2.174 | -7,65 | ||||
| 2026-02-12 | 13F | Commonwealth Equity Services, Llc | 2.304.251 | 65,04 | 83.829 | 167.556,00 | ||||
| 2026-01-29 | 13F | Sanctuary Advisors, LLC | 30.712 | -47,29 | 1.117 | -46,96 | ||||
| 2026-04-08 | 13F | KWB Wealth | 8.747 | 0,00 | 318 | 0,00 | ||||
| 2026-04-17 | 13F | Worth Asset Management, LLC | 57.260 | 2.059 | ||||||
| 2026-02-18 | 13F | GWM Advisors LLC | 63.959 | 44,34 | 2.327 | 45,28 | ||||
| 2026-02-12 | 13F | CIBC Private Wealth Group, LLC | 4.515 | 0,16 | 164 | 1,23 | ||||
| 2026-02-17 | 13F | Miller Capital Partners, Inc. | 131 | 5 | ||||||
| 2026-02-17 | 13F | Raymond James Financial Inc | 2.506.777 | 18,71 | 91.197 | 19,47 | ||||
| 2026-02-11 | 13F | J.w. Cole Advisors, Inc. | 12.791 | 0,20 | 458 | -0,87 | ||||
| 2026-02-12 | 13F | Betterment LLC | 14.612 | 14,42 | 1 | |||||
| 2026-04-09 | 13F | CRA Financial Services, LLC | 38.841 | 1.397 | ||||||
| 2026-04-15 | 13F | Snider Financial Group | 75.692 | 7,44 | 2.722 | 6,21 | ||||
| 2026-04-20 | 13F | Williams & Novak, LLC | 8.021 | 10,51 | 291 | 10,23 | ||||
| 2026-01-26 | 13F | Asset Dedication, LLC | 908 | 0,00 | 33 | 3,13 | ||||
| 2026-02-17 | 13F | Citadel Advisors Llc | 74.546 | 2.712 | ||||||
| 2026-01-26 | 13F | Dynamic Financial Group | 9.077 | -0,12 | 330 | 0,61 | ||||
| 2026-04-09 | 13F | McNamara Financial Services, Inc. | 769.031 | -0,02 | 27.654 | -1,18 | ||||
| 2026-02-17 | 13F | Private Advisor Group, LLC | 277.941 | 11,58 | 10.111 | 12,28 | ||||
| 2026-01-21 | 13F | Base Wealth Management LLC | 167.874 | 6.107 | ||||||
| 2026-02-09 | 13F | Huntington National Bank | 104.729 | 7,08 | ||||||
| 2026-02-12 | 13F | Proficio Capital Partners LLC | 8.875 | -28,40 | 323 | -28,12 | ||||
| 2025-11-04 | 13F | Jones Financial Companies Lllp | 0 | -100,00 | 0 | -100,00 | ||||
| 2026-04-09 | 13F | Herbst Group, Llc | 7.500 | 270 | ||||||
| 2026-02-17 | 13F | Fmr Llc | 9.229.681 | 0,26 | 335.776 | 0,90 | ||||
| 2026-02-13 | 13F | Change Path, LLC | 11.446 | 6,03 | 416 | 6,67 | ||||
| 2026-02-13 | 13F | National Bank Of Canada /fi/ | 500 | 0,00 | 18 | 0,00 | ||||
| 2026-02-13 | 13F | Sei Investments Co | 9.613 | 350 | ||||||
| 2026-01-28 | 13F | Geneos Wealth Management Inc. | 2.362 | -3,59 | 86 | -3,41 | ||||
| 2026-02-04 | 13F | Pensionmark Financial Group, Llc | 11.172 | 2,19 | 404 | 2,03 | ||||
| 2026-02-09 | 13F | Marshall Investment Management, Llc | 240.065 | -1,32 | 8.734 | -0,69 | ||||
| 2026-02-13 | 13F | Morgan Stanley | 608.154 | 199,74 | 22.125 | 201,66 | ||||
| 2026-02-17 | 13F | OmniStar Financial Group, Inc. | 0 | -100,00 | 0 | |||||
| 2026-02-02 | 13F | Woodard & Co Asset Management Group Inc /adv | 11.428 | 416 | ||||||
| 2026-02-17 | 13F | Pinnacle Financial Partners, Inc. | 67.791 | 2.467 | ||||||
| 2026-02-05 | 13F | Stephens Inc /ar/ | 17.245 | 83,48 | 627 | 84,96 | ||||
| 2026-01-26 | 13F | AE Wealth Management LLC | 1.448 | 41,13 | 53 | 40,54 | ||||
| 2026-02-05 | 13F | Staley Capital Advisers Inc | 214.840 | 16,81 | 7.816 | 17,55 | ||||
| 2026-04-14 | 13F | Prospera Financial Services Inc | 6.339 | -6,26 | 228 | -7,32 | ||||
| 2026-02-13 | 13F | Baird Financial Group, Inc. | 316.345 | 51,44 | 11.509 | 52,40 | ||||
| 2026-02-13 | 13F | Mariner, LLC | 19.834 | 218,62 | 722 | 220,44 | ||||
| 2026-01-21 | 13F | Mayfair Advisory Group, LLC | 232.416 | 56,90 | 8.513 | 59,00 | ||||
| 2026-04-07 | 13F | Farther Finance Advisors, LLC | 143.186 | 72,45 | 5.201 | 72,19 | ||||
| 2026-02-13 | 13F | MAI Capital Management | 4.568 | 27,96 | 166 | 28,68 | ||||
| 2026-02-05 | 13F | BG Investment Services, Inc. | 53.149 | 33,52 | 1.934 | 34,33 | ||||
| 2026-04-21 | 13F | GHP Investment Advisors, Inc. | 540 | 19 | ||||||
| 2026-01-14 | 13F | Net Worth Advisory Group | 11.148 | 406 | ||||||
| 2026-02-13 | 13F | Mosaic Financial Group, Llc | 14.078 | 57,49 | 1 | |||||
| 2026-02-17 | 13F | Cape Investment Advisory, Inc. | 219 | 8 | ||||||
| 2026-02-18 | 13F | EP Wealth Advisors, Inc. | 7.014 | 255 | ||||||
| 2026-02-04 | 13F | Summit Wealth Group Llc / Co | 85.259 | 3.102 | ||||||
| 2026-02-20 | 13F | Sunbelt Securities, Inc. | 23.003 | 5,20 | 837 | 5,82 | ||||
| 2026-02-17 | 13F | Ameriprise Financial Inc | 9.463.266 | 367,91 | 344.312 | 370,90 | ||||
| 2026-02-13 | 13F | Stifel Financial Corp | 43.472 | 30,00 | 1.582 | 30,88 | ||||
| 2026-04-10 | 13F | Piscataqua Savings Bank | 8.000 | 0,00 | 288 | -1,37 | ||||
| 2026-01-21 | 13F | Stone House Investment Management, LLC | 1.531 | -82,07 | 56 | -82,14 | ||||
| 2026-02-10 | 13F | Ark & Tlk Investments, Llc | 5.844 | 0,29 | 213 | 0,95 | ||||
| 2026-02-17 | 13F | Two Sigma Investments, Lp | 634.400 | 702,02 | 23.079 | 707,24 | ||||
| 2026-02-17 | 13F | Gladstone Institutional Advisory LLC | 5.892 | 214 | ||||||
| 2026-04-17 | 13F | Certified Advisory Corp | 39.850 | -0,19 | 1.430 | -1,58 | ||||
| 2026-02-11 | 13F | Capital Analysts, Inc. | 1.803.707 | 0,34 | 66 | 1,56 | ||||
| 2026-04-09 | 13F | TrueWealth Advisors, LLC | 9.171 | -91,83 | 330 | -91,94 | ||||
| 2026-04-16 | 13F | Lifelong Wealth Advisors, Inc. | 761.568 | 1,83 | 27.386 | 0,65 | ||||
| 2026-01-28 | 13F | Aspen Wealth Strategies, LLC | 190.501 | 7,21 | 6.930 | 7,89 | ||||
| 2026-02-13 | 13F | Integrated Wealth Concepts LLC | 71.799 | 7,82 | 2.612 | 8,52 | ||||
| 2026-02-10 | 13F | IFG Advisory, LLC | 40.765 | 1.483 | ||||||
| 2026-04-06 | 13F | CX Institutional | 839 | 30,69 | 0 | |||||
| 2026-04-08 | 13F | Holos Integrated Wealth LLC | 3.459 | 8,98 | 126 | 8,62 | ||||
| 2026-02-05 | 13F | Cambridge Investment Research Advisors, Inc. | 466.681 | 37,82 | 17 | 33,33 | ||||
| 2026-02-05 | 13F | Atria Investments Llc | 5.646 | 205 | ||||||
| 2026-02-17 | 13F | Equitable Holdings, Inc. | 358.133 | 13,92 | 13.029 | 14,64 | ||||
| 2026-02-11 | 13F | LPL Financial LLC | 4.947.566 | 28,28 | 179.992 | 29,10 | ||||
| 2026-02-05 | 13F | Allworth Financial LP | 1.239 | 0,24 | 45 | 2,27 | ||||
| 2026-02-10 | 13F | Sequent Asset Management, LLC | 7.711 | 0,00 | 281 | 1,08 | ||||
| 2026-02-11 | 13F | SOUTH STATE Corp | 1.342 | -19,25 | 49 | -20,00 | ||||
| 2026-02-11 | 13F | Vise Technologies, Inc. | 6.839 | 249 | ||||||
| 2026-02-03 | 13F | Anfield Capital Management, LLC | 2.792 | -28,81 | 102 | -28,37 | ||||
| 2026-02-17 | 13F | Bank Of America Corp /de/ | 490.056 | 202,65 | 17.828 | 204,60 | ||||
| 2026-04-20 | 13F | Pathfinder Wealth Consulting, Inc. | 44.711 | 5,10 | 1.608 | 3,88 | ||||
| 2026-01-26 | 13F | Ckw Financial Group | 316 | 0,00 | 0 | |||||
| 2026-02-17 | 13F | SageView Advisory Group, LLC | 884 | 32 | ||||||
| 2026-02-13 | 13F | Centaurus Financial, Inc. | 79.008 | 5,88 | 3 | 0,00 | ||||
| 2026-04-15 | 13F | Sowa Financial Group, Inc. | 13.080 | 12,67 | 0 | |||||
| 2026-02-10 | 13F | Mcrae Capital Management Inc | 30.448 | -7,77 | 1.108 | -7,21 | ||||
| 2026-02-03 | 13F | We Are One Seven, LLC | 201.104 | 6,39 | 7.316 | 7,07 | ||||
| 2026-02-17 | 13F | Cetera Investment Advisers | 1.644.381 | 56,54 | 59.823 | 57,53 | ||||
| 2026-02-11 | 13F | Gwn Securities Inc. | 60.750 | 13,80 | 2.210 | 14,57 | ||||
| 2026-04-08 | 13F | Lynch & Associates/in | 92.107 | 33,51 | 3.312 | 32,00 | ||||
| 2026-04-13 | 13F | Richard P Slaughter Associates Inc | 1.299.753 | 15,35 | 46.739 | 14,02 | ||||
| 2026-02-14 | 13F | Rockefeller Capital Management L.P. | 8.123 | -53,77 | 296 | -53,54 | ||||
| 2026-02-04 | 13F | Ameritas Advisory Services, LLC | 0 | -100,00 | 0 | |||||
| 2026-01-26 | 13F | Cwm, Llc | 291.455 | 32.611,00 | 11 | |||||
| 2026-02-09 | 13F | Fisher Asset Management, LLC | 0 | -100,00 | 0 | |||||
| 2026-02-11 | 13F | Franklin Resources Inc | 3.912 | 0,00 | 142 | 0,71 | ||||
| 2026-01-22 | 13F | Demars Financial Group, LLC | 16.482 | 0,27 | 600 | 0,84 | ||||
| 2026-01-23 | 13F | Creative Capital Management Investments LLC | 711 | 0,00 | 26 | 0,00 | ||||
| 2026-01-21 | 13F | Sound Income Strategies, LLC | 6.618 | 0,00 | 249 | 4,64 | ||||
| 2026-01-26 | 13F | Harbor Asset Planning, Inc. | 33.956 | 53,18 | 1.235 | 54,18 | ||||
| 2026-02-17 | 13F | Wealth Watch Advisors, INC | 2.629 | -2,56 | 96 | -2,06 | ||||
| 2026-02-17 | 13F | Wiley Bros.-aintree Capital, Llc | 141.713 | 41,78 | 5.156 | 38,65 | ||||
| 2026-02-17 | 13F | Susquehanna International Group, Llp | 0 | -100,00 | 0 | |||||
| 2026-02-10 | 13F | Madison Wealth Partners, Inc | 9.415 | 1,88 | 343 | 2,40 | ||||
| 2025-11-07 | 13F | Synovus Financial Corp | 41.334 | 11,18 | 1.495 | 16,81 | ||||
| 2026-04-08 | 13F | Fermata Advisors, LLC | 15.461 | -10,39 | 556 | -11,48 | ||||
| 2026-02-11 | 13F | Jpmorgan Chase & Co | 255.206 | 0,02 | 9.284 | 0,65 | ||||
| 2026-04-20 | 13F | Jfs Wealth Advisors, Llc | 2.835 | 0,28 | 102 | -0,98 | ||||
| 2026-01-12 | 13F | Traynor Capital Management, Inc. | 11.831 | -0,88 | 430 | -0,23 | ||||
| 2026-04-02 | 13F | Byrne Asset Management LLC | 4.325 | 0,00 | 156 | -1,27 | ||||
| 2025-10-27 | 13F | Kiker Wealth Management, LLC | 0 | -100,00 | 0 | -100,00 | ||||
| 2026-02-10 | 13F/A | Northwestern Mutual Wealth Management Co | 9.191.224 | 32,06 | 334.377 | 32,90 | ||||
| 2026-02-13 | 13F | Kestra Advisory Services, LLC | 0 | -100,00 | 0 | |||||
| 2026-01-08 | 13F | Fulton Bank, N.a. | 6.500 | 236 | ||||||
| 2026-02-13 | 13F | Golden State Wealth Management, LLC | 6.267 | 228 | ||||||
| 2026-04-08 | 13F | Parkside Investments, LLC | 356.471 | 0,82 | 12.819 | -0,34 | ||||
| 2026-02-06 | 13F | HighTower Advisors, LLC | 144.425 | 109,78 | 5.254 | 111,17 | ||||
| 2026-02-12 | 13F | Bank Of Montreal /can/ | 182 | 0,00 | 7 | 0,00 | ||||
| 2026-04-14 | 13F | Retirement Management Systems Inc. | 529.507 | 77,62 | 19.041 | 75,57 | ||||
| 2026-02-10 | 13F | Essex Financial Services, Inc. | 29.649 | 69,59 | 1.079 | 70,57 | ||||
| 2026-01-28 | 13F | Financial Perspectives, Inc | 413 | 0,00 | 15 | 7,14 | ||||
| 2026-02-09 | 13F | Smithfield Trust Co | 10.840 | 1,17 | 0 | |||||
| 2026-04-16 | 13F | Quotient Wealth Partners, LLC | 0 | -100,00 | 0 | |||||
| 2026-01-29 | 13F | TBH Global Asset Management, LLC | 56.880 | 3,17 | 2.129 | 6,77 | ||||
| 2026-02-10 | 13F | Envestnet Asset Management Inc | 1.613.828 | 8,86 | 58.711 | 9,56 | ||||
| 2026-04-08 | 13F | Dynamic Advisor Solutions LLC | 6.507 | 234 | ||||||
| 2026-01-28 | 13F | Hoey Investments, Inc | 62 | 0,00 | 2 | 0,00 | ||||
| 2026-01-29 | 13F | UBS Group AG | 233.039 | 429,04 | 8.478 | 432,47 | ||||
| 2026-04-07 | 13F | Park Avenue Securities Llc | 146.441 | 53,82 | 5 | 66,67 | ||||
| 2026-04-20 | 13F | Kestra Private Wealth Services, Llc | 91.431 | 21,74 | 3.288 | 20,31 | ||||
| 2026-02-26 | 13F | Anchor Investment Management, LLC | 818 | 30 | ||||||
| 2026-02-02 | 13F | Truist Financial Corp | 17.450 | -13,37 | 635 | -12,91 | ||||
| 2026-02-09 | 13F | Hartland & Co., LLC | 8.093 | 0,00 | 294 | 0,68 | ||||
| 2026-02-13 | 13F | Resources Investment Advisors, LLC. | 71.561 | -60,62 | 2.603 | -60,37 | ||||
| 2026-02-06 | 13F | Pnc Financial Services Group, Inc. | 7.086 | 3,60 | 258 | 4,05 | ||||
| 2026-02-03 | 13F | Geneva Partners, LLC | 15.507 | -1,25 | 564 | -0,53 | ||||
| 2026-04-13 | 13F | Cyndeo Wealth Partners, LLC | 22.641 | 4,69 | 814 | 3,56 | ||||
| 2026-04-17 | 13F | RFG Advisory, LLC | 0 | -100,00 | 0 | |||||
| 2026-02-12 | 13F | Founders Financial Alliance, LLC | 100.093 | 37,24 | 3.641 | 38,13 | ||||
| 2026-04-15 | 13F | Merit Financial Group, LLC | 391.156 | 66,69 | 14.066 | 64,77 | ||||
| 2026-01-21 | 13F | SJS Investment Consulting Inc. | 973 | 35 | ||||||
| 2026-01-29 | 13F | Comerica Bank | 3.764 | 0,00 | 137 | 0,00 | ||||
| 2026-02-17 | 13F | Russell Investments Group, Ltd. | 124 | 0,00 | 5 | 0,00 | ||||
| 2026-02-05 | 13F | Armor Investment Advisors, LLC | 527.627 | -15,68 | 19.195 | -15,14 | ||||
| 2026-01-29 | 13F | Camelot Portfolios, LLC | 252 | 9 | ||||||
| 2026-04-10 | 13F | Benin Management CORP | 10.033 | 0,00 | 361 | -1,37 | ||||
| 2026-04-13 | 13F | Trust Co | 54 | -91,95 | 2 | -95,83 | ||||
| 2026-01-22 | 13F | Glass Jacobson Investment Advisors llc | 1.579 | 0,25 | 57 | 1,79 | ||||
| 2026-02-13 | 13F | Mml Investors Services, Llc | 741.020 | 17,60 | 26.958 | 18,35 | ||||
| 2026-04-10 | 13F | Cassilly Financial Group LLC | 61.018 | 3,66 | 2.194 | 2,48 | ||||
| 2026-04-15 | 13F | Parsons Capital Management Inc/ri | 23.144 | 19,80 | 832 | 18,52 | ||||
| 2026-02-03 | 13F | McIlrath & Eck, LLC | 181 | 0,00 | 7 | 0,00 | ||||
| 2026-04-13 | 13F | IFP Advisors, Inc | 25.424 | -18,13 | 914 | -19,04 | ||||
| 2026-02-17 | 13F | Modern Wealth Management, LLC | 8.146 | 0,30 | 296 | 1,02 | ||||
| 2026-01-26 | 13F | Private Trust Co Na | 1.877 | -25,07 | 68 | -24,44 | ||||
| 2025-11-14 | 13F | Main Street Financial Solutions, LLC | 0 | -100,00 | 0 | |||||
| 2026-04-10 | 13F | Abound Wealth Management | 1 | 0 | ||||||
| 2026-02-17 | 13F | Townsend Financial Planning, LLC | 8.495 | 309 | ||||||
| 2026-02-13 | 13F | Wells Fargo & Company/mn | 3.432.732 | 90,20 | 124.883 | 91,41 | ||||
| 2026-04-07 | 13F | U.S. Capital Wealth Advisors, LLC | 0 | -100,00 | 0 | |||||
| 2026-02-12 | 13F | Adviser Investments LLC | 9.904 | -11,33 | 360 | -10,67 | ||||
| 2026-02-05 | 13F | Sound Portfolio Advisors, LLC | 122.195 | 4.445 | ||||||
| 2026-01-20 | 13F | Savvy Advisors, Inc. | 41.775 | 113,65 | 1.520 | 115,16 | ||||
| 2026-02-09 | 13F | Clear Investment Research, Llc | 0 | -100,00 | 0 | |||||
| 2026-02-17 | 13F | Hancock Whitney Corp | 50.750 | 0,00 | 1.846 | 0,65 | ||||
| 2026-02-11 | 13F | RAM Investment Partners, LLC | 5.927 | 0,00 | 216 | 0,47 | ||||
| 2026-02-11 | 13F | Modus Advisors, LLC | 40 | 1 | ||||||
| 2026-03-25 | 13F | Mission Financial Group, LLC | 24.467 | 890 | ||||||
| 2026-01-28 | 13F | Kingswood Wealth Advisors, Llc | 13.560 | 493 | ||||||
| 2026-04-17 | 13F | AdvisorNet Financial, Inc | 182.654 | 5,30 | 6.568 | 4,09 | ||||
| 2026-04-16 | 13F | Genesis Private Wealth, Llc | 40.526 | 23,22 | 1.457 | 21,82 | ||||
| 2026-02-12 | 13F | Strata Wealth Advisors, LLC | 98.766 | 52,04 | 3.593 | 53,02 | ||||
| 2026-04-14 | 13F | Wealthcare Advisory Partners LLC | 55.626 | 3,07 | 2.000 | 1,88 | ||||
| 2026-04-08 | 13F | Wealth Enhancement Advisory Services, Llc | 162.747 | -1,06 | 5.926 | -4,10 | ||||
| 2026-04-20 | 13F | First American Bank | 11.030 | 397 | ||||||
| 2026-04-02 | 13F | Noble Wealth Management PBC | 116.408 | 6,72 | 4.186 | 5,49 | ||||
| 2026-02-11 | 13F | Janney Montgomery Scott LLC | 67.675 | 0,03 | 2 | 0,00 | ||||
| 2026-02-02 | 13F | Holistic Planning, LLC | 45.164 | 1.643 | ||||||
| 2026-02-05 | 13F | Td Private Client Wealth Llc | 28.346 | 235,14 | 1.031 | 238,03 | ||||
| 2026-02-02 | 13F | Fifth Third Bancorp | 73 | -98,70 | 3 | -99,01 | ||||
| 2026-01-30 | 13F | Sigma Planning Corp | 8.111 | 31,50 | 295 | 32,88 | ||||
| 2026-02-09 | 13F | Frazier Financial Advisors, LLC | 7 | 0,00 | 0 | |||||
| 2026-01-29 | 13F | Broadway Wealth Solutions, Inc. | 169.128 | 4,53 | 6.153 | 5,20 | ||||
| 2026-02-02 | 13F | Benjamin Edwards Inc | 5.830 | 212 | ||||||
| 2026-02-06 | 13F | Global Retirement Partners, LLC | 9.290 | 0,06 | 338 | 0,60 | ||||
| 2026-02-09 | 13F | Harbour Investments, Inc. | 13.280 | 147,58 | 483 | 150,26 | ||||
| 2026-04-15 | 13F | LongView Wealth Management | 108.265 | -24,15 | 4.095 | -23,49 | ||||
| 2026-02-04 | 13F | Nwam Llc | 21.525 | 0,27 | 809 | 5,34 | ||||
| 2026-02-10 | 13F | IAG Wealth Partners, LLC | 108.680 | 3,25 | 3.954 | 3,89 | ||||
| 2026-04-20 | 13F | Heritage Wealth Management, Inc. | 12.537 | 14,32 | 451 | 13,07 | ||||
| 2026-01-13 | 13F | Dakota Wealth Management | 24.716 | 0,29 | 899 | 1,01 | ||||
| 2026-02-04 | 13F | Atlantic Union Bankshares Corp | 1.280 | 0,00 | 47 | 0,00 | ||||
| 2026-02-10 | 13F | Bank of New York Mellon Corp | 245.070 | 23,25 | 8.916 | 24,03 | ||||
| 2025-11-13 | 13F | Glenmede Investment Management, LP | 0 | -100,00 | 0 | |||||
| 2026-04-17 | 13F | Cornell Pochily Investment Advisors, Inc. | 70.514 | 19,71 | 2.536 | 18,35 | ||||
| 2026-02-17 | 13F | Advisory Services Network, LLC | 0 | -100,00 | 0 | |||||
| 2026-04-14 | 13F | Portfolio Resources Advisor Group, Inc. | 2.660 | 96 | ||||||
| 2026-01-28 | 13F | Evergreen Private Wealth LLC | 28.986 | 1,91 | 1.055 | 2,53 | ||||
| 2026-01-23 | 13F | Transcend Wealth Collective, Llc | 7.521 | 0,00 | 274 | 0,74 | ||||
| 2026-02-12 | 13F | Jane Street Group, Llc | 84.065 | -23,66 | 3.058 | -23,17 | ||||
| 2026-04-13 | 13F | Creative Financial Designs Inc /adv | 54.068 | 16,67 | 1.944 | 15,37 | ||||
| 2026-02-13 | 13F | Financial Freedom, LLC | 1.212 | -19,36 | 44 | -18,52 | ||||
| 2026-02-12 | 13F | Steward Partners Investment Advisory, Llc | 53.284 | 17,12 | 1.938 | 17,88 | ||||
| 2026-02-17 | 13F | Qube Research & Technologies Ltd | 56.585 | 88,30 | 2.059 | 89,50 | ||||
| 2026-01-16 | 13F | Kendall Capital Management | 10.902 | 397 | ||||||
| 2026-02-13 | 13F | SRS Capital Advisors, Inc. | 256 | 9 | ||||||
| 2026-02-17 | 13F | Advisor Group Holdings, Inc. | 1.869.943 | -12,07 | 68.051 | -11,13 | ||||
| 2026-02-10 | 13F | Gw Henssler & Associates Ltd | 726.258 | 26.421 | ||||||
| 2026-02-17 | 13F | Warren Averett Asset Management, LLC | 6.633 | 0,00 | 241 | 0,84 | ||||
| 2026-01-30 | 13F | Barnes Pettey Financial Advisors, Llc | 55.370 | 2.014 | ||||||
| 2026-04-15 | 13F | Adamsbrown Wealth Consultants Llc | 601.489 | 7,47 | 21.630 | 6,23 | ||||
| 2026-02-05 | 13F | HighMark Wealth Management LLC | 14 | 0,00 | 1 | |||||
| 2026-02-10 | 13F | Argent Trust Co | 9.659 | 0,00 | 351 | 0,57 | ||||
| 2026-04-03 | 13F | Investors Research Corp | 578 | -37,72 | 21 | -39,39 | ||||
| 2026-02-02 | 13F | Cornerstone Planning Group LLC | 648 | 0,00 | 24 | 9,09 | ||||
| 2026-04-20 | 13F | Breakwater Capital Group | 11.973 | 0,22 | 431 | -0,92 | ||||
| 2026-02-06 | 13F | Motco | 77.901 | 10,45 | 2.834 | 11,18 | ||||
| 2026-02-17 | 13F | Prosperity Consulting Group, LLC | 283.664 | 22,47 | 10.320 | 23,26 | ||||
| 2026-02-13 | 13F | Arkadios Wealth Advisors | 9.015 | 39,21 | 328 | 40,17 |