Grundlæggende statistik
| Institutionelle ejere | 193 total, 193 long only, 0 short only, 0 long/short - change of 7,73% MRQ |
| Gennemsnitlig porteføljeallokering | 0.2430 % - change of 19,62% MRQ |
| Institutionelle aktier (lange) | 8.385.950 (ex 13D/G) - change of 0,54MM shares 6,92% MRQ |
| Institutionel værdi (lang) | $ 606.543 USD ($1000) |
Institutionelt ejerskab og aktionærer
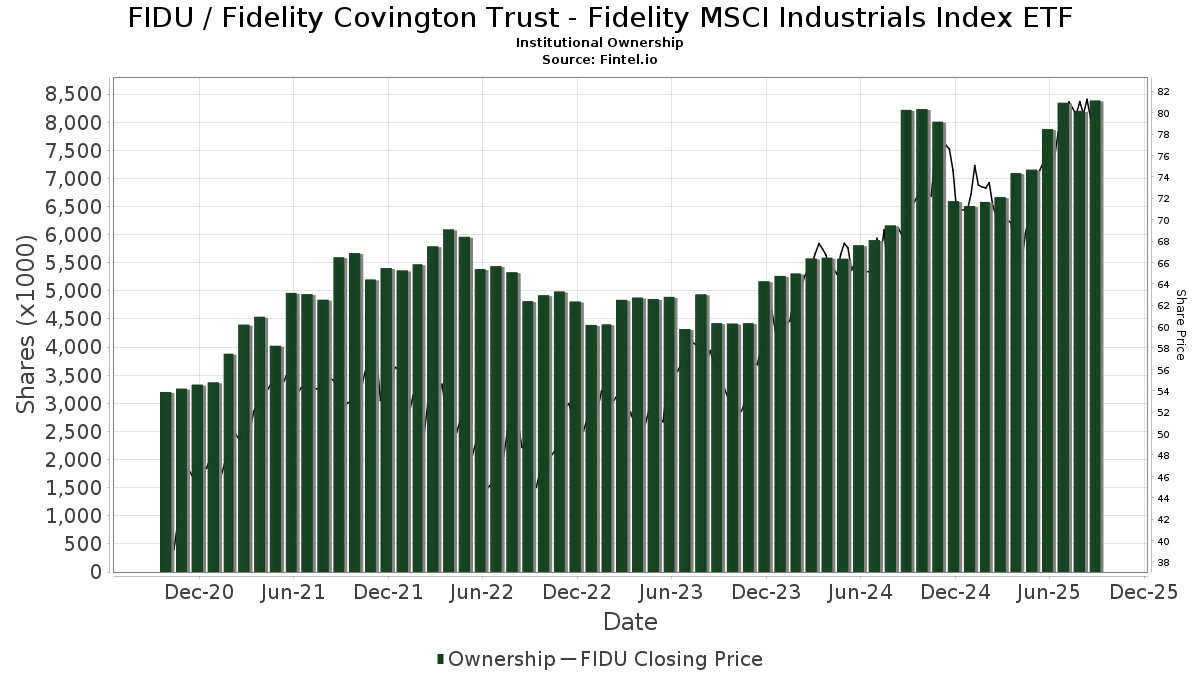
Fidelity Covington Trust - Fidelity MSCI Industrials Index ETF (US:FIDU) har 193 institutionelle ejere og aktionærer, der har indsendt 13D/G- eller 13F-formularer til Securities Exchange Commission (SEC). Disse institutioner har i alt 8,385,950 aktier. Største aktionærer omfatter Lido Advisors, LLC, AE Wealth Management LLC, Northwestern Mutual Wealth Management Co, Northern Lights Fund Trust - PFG Fidelity Institutional AM® Equity Sector Strategy Fund Class R Shares, Commonwealth Equity Services, Llc, Agf Management Ltd, Morgan Stanley, LPL Financial LLC, Full Sail Capital, LLC, and HighTower Advisors, LLC .
Fidelity Covington Trust - Fidelity MSCI Industrials Index ETF (ARCA:FIDU) institutionel ejerskabsstruktur viser aktuelle positioner i virksomheden efter institutioner og fonde, samt seneste ændringer i positionsstørrelse. Større aktionærer kan omfatte individuelle investorer, investeringsforeninger, hedgefonde eller institutioner. Skema 13D angiver, at investoren besidder (eller besidder) mere end 5 % af virksomheden og har til hensigt (eller har til hensigt at) aktivt at forfølge en ændring i forretningsstrategi. Skema 13G indikerer en passiv investering på over 5%.
The share price as of September 8, 2025 is 80,29 / share. Previously, on September 9, 2024, the share price was 67,72 / share. This represents an increase of 18,56% over that period.
Fondens stemningsscore
Fund Sentiment Score (fka Ownership Accumulation Score) finder de aktier, der bliver mest købt af fonde. Det er resultatet af en sofistikeret, multi-faktor kvantitativ model, der identificerer virksomheder med de højeste niveauer af institutionel akkumulering. Scoringsmodellen bruger en kombination af den samlede stigning i oplyste ejere, ændringerne i porteføljeallokeringer i disse ejere og andre målinger. Tallet går fra 0 til 100, hvor højere tal indikerer et højere niveau af akkumulering for sine jævnaldrende, og 50 er gennemsnittet.
Opdateringsfrekvens: Dagligt
Se Ownership Explorer, som giver en liste over højest rangerende virksomheder.
Institutionel Put/Call-forhold
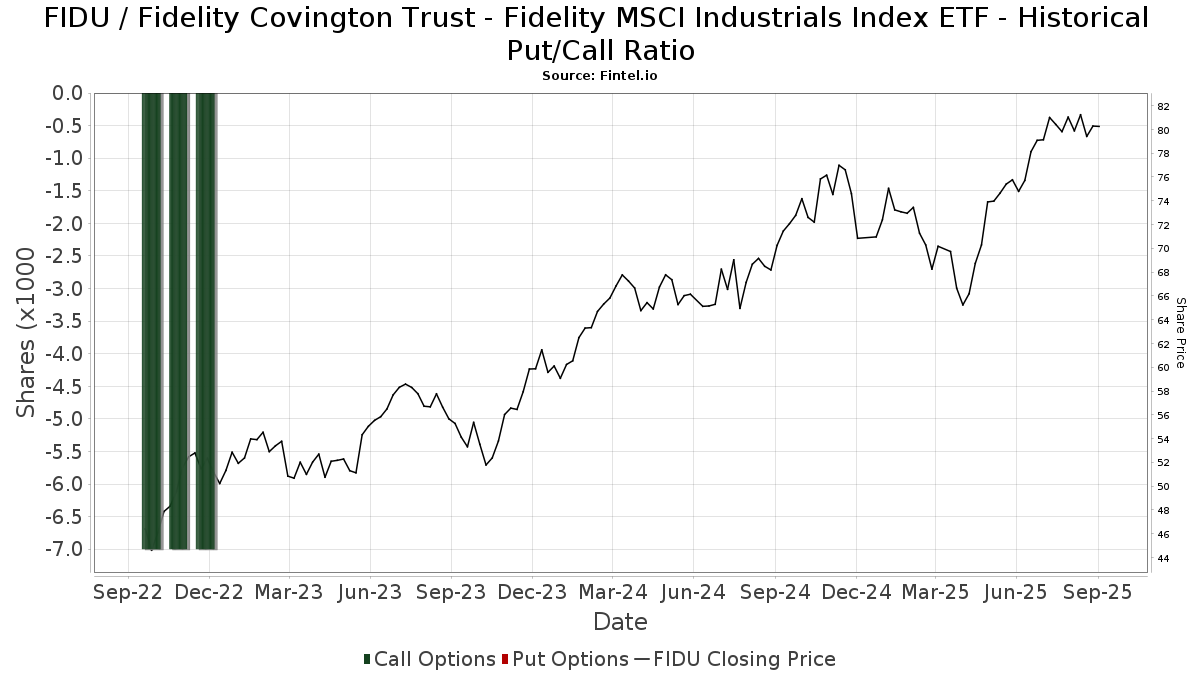
Ud over at indberette standardaktie- og gældsudstedelser skal institutter med mere end 100 mill. aktiver under forvaltning også oplyse deres put- og call-optionsbeholdninger. Da salgsoptioner generelt indikerer negativ stemning, og købsoptioner indikerer positiv stemning, kan vi få en fornemmelse af den overordnede institutionelle stemning ved at plotte forholdet mellem put og kald. Diagrammet til højre viser det historiske put/call-forhold for dette instrument.
Brug af Put/Call Ratio som en indikator for investorernes stemning overvinder en af de vigtigste mangler ved at bruge totalt institutionelt ejerskab, som er, at en betydelig mængde af aktiver under forvaltning investeres passivt for at spore indekser. Passivt forvaltede fonde køber typisk ikke optioner, så indikatoren for put/call-forholdet følger mere nøje følelsen af aktivt forvaltede fonde.
13F og NPORT arkivering
Detaljer om 13F-arkivering er gratis. Detaljer om NP-ansøgninger kræver et premium-medlemskab. Grønne rækker angiver nye positioner. Røde rækker angiver lukkede positioner. Klik på linket ikon for at se den fulde transaktionshistorik.
Opgrader
for at låse premium-data op og eksportere til Excel ![]() .
.
| Fil dato | Kilde | Investor | Type | Gennemsnitlig pris (Øst) |
Aktier | Δ Aktier (%) |
Rapporteret Værdi ($1000) |
Δ Værdi (%) |
Port Alloc (%) |
|
|---|---|---|---|---|---|---|---|---|---|---|
| 2025-07-17 | 13F | Janney Montgomery Scott LLC | 4.170 | 0,24 | 0 | |||||
| 2025-08-29 | 13F | Centaurus Financial, Inc. | 6.577 | -5,30 | 1 | |||||
| 2025-08-14 | 13F | Full Sail Capital, LLC | 146.950 | 6,16 | 11.393 | 20,19 | ||||
| 2025-08-14 | 13F | Susquehanna International Group, Llp | 0 | -100,00 | 0 | |||||
| 2025-08-15 | 13F | Kestra Advisory Services, LLC | 75.899 | 1,28 | 5.884 | 14,68 | ||||
| 2025-08-14 | 13F | Snowden Capital Advisors LLC | 15.045 | -4,18 | 1.166 | 8,47 | ||||
| 2025-08-04 | 13F | Creative Financial Designs Inc /adv | 633 | 0,00 | 49 | 13,95 | ||||
| 2025-08-08 | 13F | Capital Investment Advisory Services, LLC | 262 | 0,00 | 20 | 17,65 | ||||
| 2025-08-12 | 13F | Integrated Advisors Network LLC | 6.955 | -38,78 | 539 | -30,63 | ||||
| 2025-08-13 | 13F | Rsm Us Wealth Management Llc | 2.757 | 214 | ||||||
| 2025-08-07 | 13F | Kestra Private Wealth Services, Llc | 30.012 | 3,55 | 2.327 | 17,24 | ||||
| 2025-08-08 | 13F | IMA Wealth, Inc. | 33 | 0,00 | 3 | 0,00 | ||||
| 2025-08-14 | 13F | Stifel Financial Corp | 70.451 | 0,17 | 5.462 | 13,44 | ||||
| 2025-07-22 | 13F | Valley National Advisers Inc | 0 | -100,00 | 0 | |||||
| 2025-08-01 | 13F | Envestnet Asset Management Inc | 66.869 | 48,69 | 5.184 | 68,37 | ||||
| 2025-07-21 | 13F | Ameritas Advisory Services, LLC | 7.099 | -14,14 | 550 | -3,00 | ||||
| 2025-08-05 | 13F | Simplex Trading, Llc | 484 | 63,51 | 0 | |||||
| 2025-07-02 | 13F | Crumly & Associates Inc. | 4.175 | 0,00 | 324 | 13,33 | ||||
| 2025-08-05 | 13F | Smith Shellnut Wilson Llc /adv | 14.677 | -1,10 | 1.138 | 11,91 | ||||
| 2025-08-12 | 13F | Atlas Capital Advisors Llc | 37.608 | -1,24 | 2.916 | 11,81 | ||||
| 2025-08-14 | 13F | Jane Street Group, Llc | 0 | -100,00 | 0 | |||||
| 2025-08-14 | 13F | Goldman Sachs Group Inc | 0 | -100,00 | 0 | |||||
| 2025-07-17 | 13F | Wolff Wiese Magana Llc | 25 | 0,00 | 2 | 0,00 | ||||
| 2025-08-12 | 13F | Proequities, Inc. | 0 | 0 | ||||||
| 2025-08-13 | 13F | SCS Capital Management LLC | 7.955 | 0,00 | 617 | 13,24 | ||||
| 2025-07-14 | 13F | Ridgewood Investments LLC | 132 | 0,00 | 10 | 11,11 | ||||
| 2025-07-16 | 13F | Fischer Financial Services, Inc. | 59.351 | 0,40 | 4.601 | 13,69 | ||||
| 2025-08-14 | 13F | Mercer Global Advisors Inc /adv | 2.734 | 212 | ||||||
| 2025-05-01 | 13F | Grant/GrossMendelsohn, LLC | 0 | -100,00 | 0 | |||||
| 2025-08-07 | 13F | Fidelis Capital Partners, LLC | 2.669 | 213 | ||||||
| 2025-07-28 | 13F | Mutual Advisors, LLC | 17.759 | 0,51 | 1.454 | 21,39 | ||||
| 2025-05-15 | 13F/A | Orion Portfolio Solutions, LLC | 6.130 | 22,75 | 420 | 19,37 | ||||
| 2025-08-04 | 13F | Pensionmark Financial Group, Llc | 3.502 | 0,00 | 272 | 13,39 | ||||
| 2025-08-11 | 13F | TD Waterhouse Canada Inc. | 0 | -100,00 | 0 | |||||
| 2025-07-25 | 13F | We Are One Seven, LLC | 10.762 | -2,18 | 834 | 10,76 | ||||
| 2025-08-08 | 13F | Pnc Financial Services Group, Inc. | 378 | 51,20 | 29 | 70,59 | ||||
| 2025-08-11 | 13F | Mach-1 Financial Group, Inc. | 0 | -100,00 | 0 | |||||
| 2025-08-14 | 13F | Sunbelt Securities, Inc. | 22.244 | 47,97 | 1.564 | 51,90 | ||||
| 2025-08-12 | 13F | Jpmorgan Chase & Co | 944 | 1.866,67 | 73 | 2.333,33 | ||||
| 2025-04-21 | 13F | Nelson, Van Denburg & Campbell Wealth Management Group, LLC | 0 | -100,00 | 0 | |||||
| 2025-07-30 | 13F | Brookstone Capital Management | 3.467 | -7,32 | 269 | 4,69 | ||||
| 2025-07-22 | 13F | Yoder Wealth Management, Inc. | 69.564 | 6,91 | 5.393 | 21,05 | ||||
| 2025-08-12 | 13F | Steward Partners Investment Advisory, Llc | 2.124 | 165 | ||||||
| 2025-07-17 | 13F | CWA Asset Management Group, LLC | 5.046 | 0,02 | 391 | 13,33 | ||||
| 2025-07-29 | 13F | Harbor Asset Planning, Inc. | 2.678 | 208 | ||||||
| 2025-05-13 | 13F | Coston, McIsaac & Partners | 0 | -100,00 | 0 | |||||
| 2025-07-29 | 13F | AssuredPartners Investment Advisors, LLC | 3.424 | -25,77 | 265 | -15,87 | ||||
| 2025-08-14 | 13F | GWM Advisors LLC | 90.793 | -2,21 | 7.039 | 10,73 | ||||
| 2025-04-24 | 13F | HighMark Wealth Management LLC | 0 | -100,00 | 0 | |||||
| 2025-04-21 | 13F | Ronald Blue Trust, Inc. | 0 | -100,00 | 0 | -100,00 | ||||
| 2025-07-16 | 13F | Signature Resources Capital Management, LLC | 554 | 43 | ||||||
| 2025-07-30 | 13F | Gables Capital Management Inc. | 245 | 0,00 | 19 | 12,50 | ||||
| 2025-08-13 | 13F | KDK Private Wealth Management, LLC | 26.637 | -1,05 | 2.065 | 12,05 | ||||
| 2025-07-31 | 13F | Cambridge Investment Research Advisors, Inc. | 17.980 | -5,53 | 1 | 0,00 | ||||
| 2025-08-01 | 13F | Penobscot Wealth Management | 29.376 | 9,18 | 2.278 | 23,62 | ||||
| 2025-08-06 | 13F | AE Wealth Management LLC | 934.788 | 1,13 | 72.474 | 14,51 | ||||
| 2025-08-06 | 13F | Agf Management Ltd | 287.911 | 1,50 | 22.322 | 14,93 | ||||
| 2025-08-12 | 13F | SRS Capital Advisors, Inc. | 417 | 317,00 | 32 | 433,33 | ||||
| 2025-08-08 | 13F | Cetera Investment Advisers | 33.859 | 2,19 | 2.625 | 15,74 | ||||
| 2025-07-30 | 13F | Evermay Wealth Management Llc | 12 | 0,00 | 1 | |||||
| 2025-08-12 | 13F | Armor Investment Advisors, LLC | 43.102 | -1,29 | 3.342 | 11,78 | ||||
| 2025-08-12 | 13F | O'shaughnessy Asset Management, Llc | 19.888 | 22,64 | 1.542 | 38,83 | ||||
| 2025-08-08 | 13F | Meridian Wealth Management, LLC | 10.436 | -4,18 | 809 | 8,59 | ||||
| 2025-08-13 | 13F | River Wealth Advisors LLC | 2.715 | 210 | ||||||
| 2025-07-22 | 13F | Fortitude Advisory Group L.L.C. | 3.122 | 242 | ||||||
| 2025-08-13 | 13F | Jones Financial Companies Lllp | 8.633 | 22,98 | 667 | 39,54 | ||||
| 2025-05-02 | 13F | Capital A Wealth Management, LLC | 83 | 260,87 | 6 | 400,00 | ||||
| 2025-08-07 | 13F | Allworth Financial LP | 31 | 0,00 | 2 | 0,00 | ||||
| 2025-08-05 | 13F | Sigma Planning Corp | 4.000 | -0,67 | 310 | 12,73 | ||||
| 2025-07-25 | 13F | Cwm, Llc | 578 | 0,00 | 0 | |||||
| 2025-07-02 | 13F | HBW Advisory Services LLC | 2.791 | 216 | ||||||
| 2025-07-30 | 13F | Retirement Planning Group | 4.797 | 372 | ||||||
| 2025-04-23 | 13F | Aspetuck Financial Management LLC | 0 | -100,00 | 0 | -100,00 | ||||
| 2025-07-31 | 13F | BIP Wealth, LLC | 3.225 | 0,28 | 250 | 13,64 | ||||
| 2025-08-14 | 13F | UBS Group AG | 13.136 | 220,23 | 1.018 | 263,57 | ||||
| 2025-08-14 | 13F | Fmr Llc | 66.058 | 10,71 | 5.122 | 25,36 | ||||
| 2025-08-14 | 13F | Wells Fargo & Company/mn | 111.840 | 100,91 | 8.671 | 127,50 | ||||
| 2025-08-14 | 13F | CoreCap Advisors, LLC | 2.057 | 60,08 | 159 | 82,76 | ||||
| 2025-07-28 | 13F | Harbour Investments, Inc. | 228 | 0,00 | 18 | 13,33 | ||||
| 2025-05-01 | 13F | Stephens Inc /ar/ | 0 | -100,00 | 0 | |||||
| 2025-08-07 | 13F | Montag A & Associates Inc | 11.434 | 2,63 | 886 | 16,27 | ||||
| 2025-08-05 | 13F | Dunhill Financial, LLC | 1.686 | 131 | ||||||
| 2025-04-29 | 13F | Element Wealth, LLC | 0 | -100,00 | 0 | |||||
| 2025-08-12 | 13F | CIBC Private Wealth Group, LLC | 1 | -97,50 | 0 | -100,00 | ||||
| 2025-07-15 | 13F | Missouri Trust & Investment Co | 300 | 0,00 | 23 | 15,00 | ||||
| 2025-08-14 | 13F | Kovitz Investment Group Partners, LLC | 98.860 | 231,92 | 7.665 | 275,87 | ||||
| 2025-08-19 | 13F | Advisory Services Network, LLC | 9.194 | -22,62 | 739 | -9,10 | ||||
| 2025-08-01 | 13F | Chilton Capital Management Llc | 100 | 0,00 | 8 | 16,67 | ||||
| 2025-07-09 | 13F | Tounjian Advisory Partners, Llc | 21.010 | -1,61 | 1.439 | -1,64 | ||||
| 2025-08-12 | 13F | Minot DeBlois Advisors LLC | 65 | 0,00 | 5 | 25,00 | ||||
| 2025-07-08 | 13F | Nbc Securities, Inc. | 140 | 0,00 | 0 | |||||
| 2025-08-13 | 13F | Summit Financial, LLC | 5.835 | -12,26 | 452 | -0,66 | ||||
| 2025-08-14 | 13F | Raymond James Financial Inc | 9.514 | 10,36 | 738 | 24,92 | ||||
| 2025-07-24 | 13F | IFP Advisors, Inc | 427 | -58,42 | 33 | -52,86 | ||||
| 2025-08-08 | NP | QALTX - Quantified Alternative Investment Fund Investor Class Shares | 3.536 | -49,03 | 274 | -43,74 | ||||
| 2025-07-21 | 13F | Hilltop National Bank | 390 | 0,00 | 30 | 11,11 | ||||
| 2025-08-26 | 13F/A | Thrivent Financial For Lutherans | 76.846 | -16,47 | 6 | -16,67 | ||||
| 2025-08-05 | 13F | Lifeworks Advisors, LLC | 46.413 | -10,44 | 3.598 | 1,41 | ||||
| 2025-07-18 | 13F | Truist Financial Corp | 20.209 | -5,86 | 1.567 | 6,60 | ||||
| 2025-07-25 | 13F | Atria Wealth Solutions, Inc. | 17.471 | -11,55 | 1.376 | 1,70 | ||||
| 2025-08-14 | 13F | Federation des caisses Desjardins du Quebec | 1.905 | 148 | ||||||
| 2025-07-17 | 13F | Fifth Third Securities, Inc. | 27.519 | 2,52 | 2.134 | 16,11 | ||||
| 2025-08-14 | 13F | Boston Private Wealth Llc | 2.962 | 230 | ||||||
| 2025-07-28 | 13F | Rosenberg Matthew Hamilton | 2.886 | 0,00 | 224 | 13,20 | ||||
| 2025-09-04 | 13F/A | Advisor Group Holdings, Inc. | 48.645 | -29,47 | 3.785 | -20,06 | ||||
| 2025-05-16 | 13F | Arete Wealth Advisors, LLC | 0 | -100,00 | 0 | |||||
| 2025-08-15 | 13F | Tower Research Capital LLC (TRC) | 19 | -99,89 | 1 | -99,91 | ||||
| 2025-08-05 | 13F | Advisors Preferred, LLC | 3.536 | 276 | ||||||
| 2025-07-23 | 13F | Monte Financial Group, LLC | 3.442 | -1,71 | 267 | 15,65 | ||||
| 2025-07-22 | 13F | Grimes & Company, Inc. | 4.078 | 316 | ||||||
| 2025-05-09 | 13F | Briaud Financial Planning, Inc | 0 | -100,00 | 0 | |||||
| 2025-04-10 | 13F | Secure Asset Management, LLC | 0 | -100,00 | 0 | -100,00 | ||||
| 2025-08-14 | 13F | Mml Investors Services, Llc | 16.810 | -76,17 | 1 | -75,00 | ||||
| 2025-07-14 | 13F | Buska Wealth Management, LLC | 97.427 | -26,74 | 7.554 | -17,05 | ||||
| 2025-06-30 | NP | Northern Lights Fund Trust - PFG Fidelity Institutional AM® Equity Sector Strategy Fund Class R Shares | 864.020 | 118,36 | 59.384 | 103,77 | ||||
| 2025-07-09 | 13F | Bank of New Hampshire | 108 | 0,00 | 8 | 14,29 | ||||
| 2025-08-08 | 13F | Larson Financial Group LLC | 4.131 | 0,29 | 320 | 13,48 | ||||
| 2025-08-13 | 13F | Level Four Advisory Services, Llc | 14.214 | -0,04 | 1.102 | 13,26 | ||||
| 2025-07-15 | 13F | Define Financial, Llc | 3.029 | 235 | ||||||
| 2025-07-22 | 13F | PUREfi Wealth, LLC | 5.395 | 0,00 | 418 | 13,28 | ||||
| 2025-08-11 | 13F | Aptus Capital Advisors, LLC | 59 | 0,00 | 5 | 0,00 | ||||
| 2025-07-07 | 13F | Nova Wealth Management, Inc. | 9.641 | -16,14 | 747 | -5,08 | ||||
| 2025-07-11 | 13F | Farther Finance Advisors, LLC | 9 | -68,97 | 1 | -100,00 | ||||
| 2025-07-25 | 13F | Valley Brook Capital Group, Inc. | 5.562 | 1,37 | 431 | 14,93 | ||||
| 2025-07-30 | 13F | Bogart Wealth, LLC | 2.295 | 0,00 | 178 | 12,74 | ||||
| 2025-08-11 | 13F | Kingdom Financial Group LLC. | 2.762 | 214 | ||||||
| 2025-07-15 | 13F | Lynch & Associates/in | 25.388 | 5,20 | 1.968 | 19,13 | ||||
| 2025-05-01 | 13F | Quest 10 Wealth Builders, Inc. | 20 | 1 | ||||||
| 2025-07-22 | 13F | One Wealth Management Investment & Advisory Services, LLC | 4.996 | -0,89 | 387 | 12,17 | ||||
| 2025-08-27 | 13F/A | Brinker Capital Investments, LLC | 7.120 | 16,15 | 552 | 31,74 | ||||
| 2025-04-23 | 13F | PMV Capital Advisers, LLC | 0 | -100,00 | 0 | |||||
| 2025-07-23 | 13F | Heck Capital Advisors, LLC | 12.109 | 1,91 | 939 | 15,38 | ||||
| 2025-07-31 | 13F | Sage Mountain Advisors LLC | 1.104 | 0,00 | 86 | 13,33 | ||||
| 2025-08-14 | 13F | Qube Research & Technologies Ltd | 120 | 9 | ||||||
| 2025-08-05 | 13F | Trail Ridge Investment Advisors, LLC | 15.185 | -4,15 | 1.221 | 12,64 | ||||
| 2025-07-24 | 13F | Us Bancorp \de\ | 851 | 66 | ||||||
| 2025-08-11 | 13F | HighTower Advisors, LLC | 138.329 | 75,40 | 10.725 | 98,63 | ||||
| 2025-08-13 | 13F | Whalerock Point Partners, Llc | 5.890 | 0,00 | 457 | 13,15 | ||||
| 2025-08-05 | 13F | EPG Wealth Management LLC | 30.506 | -0,74 | 2.365 | 12,40 | ||||
| 2025-08-12 | 13F | MAI Capital Management | 179 | 0,00 | 14 | 8,33 | ||||
| 2025-07-16 | 13F/A | CX Institutional | 545 | -16,54 | 0 | |||||
| 2025-07-18 | 13F | Vicus Capital | 0 | -100,00 | 0 | |||||
| 2025-08-01 | 13F | SYM FINANCIAL Corp | 365 | 28 | ||||||
| 2025-08-13 | 13F | Continuum Advisory, LLC | 8.231 | -3,44 | 638 | 9,43 | ||||
| 2025-08-14 | 13F | Bank Of America Corp /de/ | 107.444 | -11,33 | 8.330 | 0,41 | ||||
| 2025-08-12 | 13F | J.w. Cole Advisors, Inc. | 4.928 | 382 | ||||||
| 2025-08-14 | 13F | Modern Wealth Management, LLC | 52.981 | 6,39 | 4.108 | 20,48 | ||||
| 2025-08-14 | 13F | DecisionPoint Financial, LLC | 108 | 0,00 | 8 | 14,29 | ||||
| 2025-07-16 | 13F | Essex Financial Services, Inc. | 13.076 | 10,53 | 1.014 | 25,22 | ||||
| 2025-08-04 | 13F | Canton Hathaway, LLC | 2.300 | 0,00 | 0 | |||||
| 2025-08-21 | 13F | Pathway Financial Advisers, LLC | 3.821 | 6,20 | 296 | 20,33 | ||||
| 2025-07-07 | 13F | Trust Co Of Oklahoma | 15.690 | 2,37 | 1.216 | 15,92 | ||||
| 2025-08-14 | 13F | Hurley Capital, LLC | 2.017 | 0,05 | 156 | 13,04 | ||||
| 2025-08-01 | 13F | Bessemer Group Inc | 0 | -100,00 | 0 | |||||
| 2025-08-14 | 13F | Evergreen Wealth Solutions, LLC | 2.690 | 209 | ||||||
| 2025-07-30 | 13F | Princeton Global Asset Management LLC | 518 | 0,00 | 40 | 14,29 | ||||
| 2025-08-12 | 13F | Franklin Resources Inc | 0 | -100,00 | 0 | |||||
| 2025-08-25 | 13F/A | Promus Capital, LLC | 99 | 0,00 | 8 | 16,67 | ||||
| 2025-08-06 | 13F | Decker Retirement Planning Inc. | 434 | 0,00 | 34 | 13,79 | ||||
| 2025-08-08 | 13F | Creative Planning | 2.925 | 227 | ||||||
| 2025-09-03 | 13F | Q3 Asset Management | 5.161 | 0 | ||||||
| 2025-08-13 | 13F | Transce3nd, LLC | 312 | 24 | ||||||
| 2025-08-07 | 13F | Traynor Capital Management, Inc. | 60.427 | 0,62 | 4.708 | 14,52 | ||||
| 2025-08-14 | 13F | Glen Eagle Advisors, LLC | 116 | 0,00 | 9 | 14,29 | ||||
| 2025-08-08 | 13F | Independence Financial Advisors, LLC | 83.950 | -4,85 | 6.509 | 7,73 | ||||
| 2025-08-14 | 13F | IHT Wealth Management, LLC | 43.295 | 6,80 | 3.357 | 20,94 | ||||
| 2025-07-21 | 13F | DHJJ Financial Advisors, Ltd. | 67 | 48,89 | 5 | 66,67 | ||||
| 2025-08-12 | 13F | Global Retirement Partners, LLC | 1.554 | -0,45 | 120 | 10,09 | ||||
| 2025-07-28 | 13F | Kiker Wealth Management, LLC | 0 | -100,00 | 0 | |||||
| 2025-08-04 | 13F | Arkadios Wealth Advisors | 32.935 | -0,28 | 2.553 | 12,91 | ||||
| 2025-08-12 | 13F | PKS Advisory Services, LLC | 4.921 | -12,45 | 382 | -0,78 | ||||
| 2025-08-11 | 13F | Elite Financial, Inc. | 0 | -100,00 | 0 | |||||
| 2025-07-14 | 13F | U.S. Capital Wealth Advisors, LLC | 32.419 | 6,21 | 2.513 | 20,30 | ||||
| 2025-04-28 | 13F | Mainstream Capital Management LLC | 0 | -100,00 | 0 | |||||
| 2025-08-13 | 13F | Colonial Trust Co / SC | 559 | -18,87 | 43 | -8,51 | ||||
| 2025-07-07 | 13F | Roxbury Financial LLC | 14.660 | -1,33 | 1.137 | 6,57 | ||||
| 2025-08-11 | 13F | Beaumont Capital Management, LLC | 0 | -100,00 | 0 | |||||
| 2025-07-16 | 13F | American National Bank | 11.086 | 3,54 | 859 | 17,19 | ||||
| 2025-08-01 | 13F | Purkiss Capital Advisors LLC | 3.440 | 267 | ||||||
| 2025-08-13 | 13F | Townsquare Capital Llc | 0 | -100,00 | 0 | |||||
| 2025-07-08 | 13F | Parallel Advisors, LLC | 250 | 0,00 | 19 | 11,76 | ||||
| 2025-05-12 | 13F | Ameritas Investment Partners, Inc. | 0 | -100,00 | 0 | |||||
| 2025-08-06 | 13F | Stonebridge Financial Planning Group, LLC | 16.547 | 1,81 | 1.283 | 15,29 | ||||
| 2025-08-13 | 13F | Northwestern Mutual Wealth Management Co | 882.815 | 16,98 | 68.445 | 32,45 | ||||
| 2025-08-11 | 13F | Vista Cima Wealth Management LLC | 0 | -100,00 | 0 | -100,00 | ||||
| 2025-08-14 | 13F | Ausdal Financial Partners, Inc. | 3.935 | 0,28 | 305 | 13,81 | ||||
| 2025-08-05 | 13F | Bank Of Montreal /can/ | 500 | -54,83 | 39 | -49,33 | ||||
| 2025-07-10 | 13F | Selective Wealth Management, Inc. | 2.746 | 217 | ||||||
| 2025-07-29 | 13F | Primoris Wealth Advisors, Llc | 7.479 | -16,94 | 580 | -6,01 | ||||
| 2025-07-30 | 13F | IMG Wealth Management, Inc. | 29 | 2 | ||||||
| 2025-08-05 | 13F | Huntington National Bank | 4 | -50,00 | ||||||
| 2025-08-12 | 13F | Pathstone Holdings, LLC | 4.646 | -44,27 | 360 | -36,95 | ||||
| 2025-08-01 | 13F | Schmidt P J Investment Management Inc | 6.051 | -4,50 | 469 | 8,31 | ||||
| 2025-08-14 | 13F | Comerica Bank | 3.139 | 15,49 | 243 | 30,65 | ||||
| 2025-08-14 | 13F | Mariner, LLC | 15.473 | 11,58 | 1.200 | 26,34 | ||||
| 2025-08-14 | 13F | Citadel Advisors Llc | 0 | -100,00 | 0 | |||||
| 2025-08-13 | 13F | Lido Advisors, LLC | 1.704.467 | 7,93 | 132.147 | 22,21 | ||||
| 2025-08-14 | 13F | Integrated Wealth Concepts LLC | 4.552 | 21,87 | 353 | 38,04 | ||||
| 2025-08-08 | 13F | MTM Investment Management, LLC | 479 | 37 | ||||||
| 2025-08-14 | 13F | Redwood Financial Network Corp | 0 | -100,00 | 0 | |||||
| 2025-07-10 | 13F | Wealth Enhancement Advisory Services, Llc | 0 | -100,00 | 0 | |||||
| 2025-08-04 | 13F | Prairie Wealth Advisors, Inc. | 6.702 | 0,00 | 520 | 13,32 | ||||
| 2025-08-06 | 13F | Mcrae Capital Management Inc | 5.123 | 397 | ||||||
| 2025-07-15 | 13F | Elevated Capital Advisors, LLC | 18.282 | 0,00 | 1.252 | 0,00 | ||||
| 2025-08-13 | 13F | Congress Wealth Management LLC / DE / | 10.133 | -0,84 | 786 | 12,30 | ||||
| 2025-07-14 | 13F | UMA Financial Services, Inc. | 50 | 0,00 | 4 | 0,00 | ||||
| 2025-08-08 | 13F | Atlantic Trust, LLC | 63 | 0,00 | 5 | 0,00 | ||||
| 2025-08-14 | 13F | Diversify Advisory Services, LLC | 3.205 | -1,75 | 258 | 16,22 | ||||
| 2025-08-12 | 13F | Founders Financial Alliance, LLC | 0 | -100,00 | 0 | |||||
| 2025-08-07 | 13F | Ibex Wealth Advisors | 3.700 | 287 | ||||||
| 2025-07-17 | 13F | Smith, Salley & Associates | 30.934 | 0,50 | 2.398 | 13,81 | ||||
| 2025-07-21 | 13F | Exchange Capital Management, Inc. | 30.156 | -2,49 | 2.338 | 10,39 | ||||
| 2025-07-30 | 13F | VCI Wealth Management LLC | 21.379 | 6,64 | 1.657 | 20,77 | ||||
| 2025-07-07 | 13F | Versant Capital Management, Inc | 433 | 0,00 | 34 | 13,79 | ||||
| 2025-07-17 | 13F | Sound Income Strategies, LLC | 23 | 0,00 | 2 | 0,00 | ||||
| 2025-08-14 | 13F | Ameriprise Financial Inc | 102.212 | -18,62 | 7.931 | -7,78 | ||||
| 2025-08-06 | 13F | Maltin Wealth Management, Inc. | 7.287 | 1,50 | 565 | 14,87 | ||||
| 2025-07-16 | 13F | Beaumont Financial Advisors, LLC | 22.508 | -7,08 | 1.745 | 5,25 | ||||
| 2025-08-12 | 13F | LPL Financial LLC | 181.712 | 1,89 | 14.088 | 15,37 | ||||
| 2025-07-17 | 13F | Centennial Wealth Advisory LLC | 5.134 | -7,09 | 399 | 5,56 | ||||
| 2025-08-11 | 13F | Citigroup Inc | 13.146 | 21,97 | 1.019 | 38,26 | ||||
| 2025-08-14 | 13F | Royal Bank Of Canada | 111.285 | -8,79 | 8.628 | 3,28 | ||||
| 2025-08-11 | 13F | Principal Securities, Inc. | 2.177 | 31,94 | 169 | 44,83 | ||||
| 2025-08-15 | 13F | Morgan Stanley | 198.915 | -21,87 | 15.422 | -11,54 | ||||
| 2025-08-01 | 13F | Rossby Financial, LCC | 59 | 0,00 | 5 | 33,33 | ||||
| 2025-07-23 | 13F | Godsey & Gibb Associates | 761 | 48,92 | 59 | 73,53 | ||||
| 2025-08-06 | 13F | Commonwealth Equity Services, Llc | 327.871 | 19,42 | 25 | 38,89 |