Grundlæggende statistik
| Institutionelle ejere | 134 total, 131 long only, 0 short only, 3 long/short - change of 3,08% MRQ |
| Gennemsnitlig porteføljeallokering | 0.1477 % - change of -5,57% MRQ |
| Institutionelle aktier (lange) | 37.666.287 (ex 13D/G) - change of 27,78MM shares 281,06% MRQ |
| Institutionel værdi (lang) | $ 186.071 USD ($1000) |
Institutionelt ejerskab og aktionærer
Fidus Investment Corporation (US:FDUS) har 134 institutionelle ejere og aktionærer, der har indsendt 13D/G- eller 13F-formularer til Securities Exchange Commission (SEC). Disse institutioner har i alt 37,666,287 aktier. Største aktionærer omfatter Kingstone Capital Partners Texas, LLC, Van Eck Associates Corp, Raymond James Financial Inc, BIZD - VanEck Vectors BDC Income ETF, Invesco Ltd., KBWD - Invesco KBW High Dividend Yield Financial ETF, Two Sigma Advisers, Lp, Cetera Investment Advisers, Envestnet Asset Management Inc, and Columbus Macro, LLC .
Fidus Investment Corporation (NasdaqGS:FDUS) institutionel ejerskabsstruktur viser aktuelle positioner i virksomheden efter institutioner og fonde, samt seneste ændringer i positionsstørrelse. Større aktionærer kan omfatte individuelle investorer, investeringsforeninger, hedgefonde eller institutioner. Skema 13D angiver, at investoren besidder (eller besidder) mere end 5 % af virksomheden og har til hensigt (eller har til hensigt at) aktivt at forfølge en ændring i forretningsstrategi. Skema 13G indikerer en passiv investering på over 5%.
The share price as of September 8, 2025 is 21,51 / share. Previously, on September 9, 2024, the share price was 19,90 / share. This represents an increase of 8,09% over that period.

Fondens stemningsscore
Fund Sentiment Score (fka Ownership Accumulation Score) finder de aktier, der bliver mest købt af fonde. Det er resultatet af en sofistikeret, multi-faktor kvantitativ model, der identificerer virksomheder med de højeste niveauer af institutionel akkumulering. Scoringsmodellen bruger en kombination af den samlede stigning i oplyste ejere, ændringerne i porteføljeallokeringer i disse ejere og andre målinger. Tallet går fra 0 til 100, hvor højere tal indikerer et højere niveau af akkumulering for sine jævnaldrende, og 50 er gennemsnittet.
Opdateringsfrekvens: Dagligt
Se Ownership Explorer, som giver en liste over højest rangerende virksomheder.
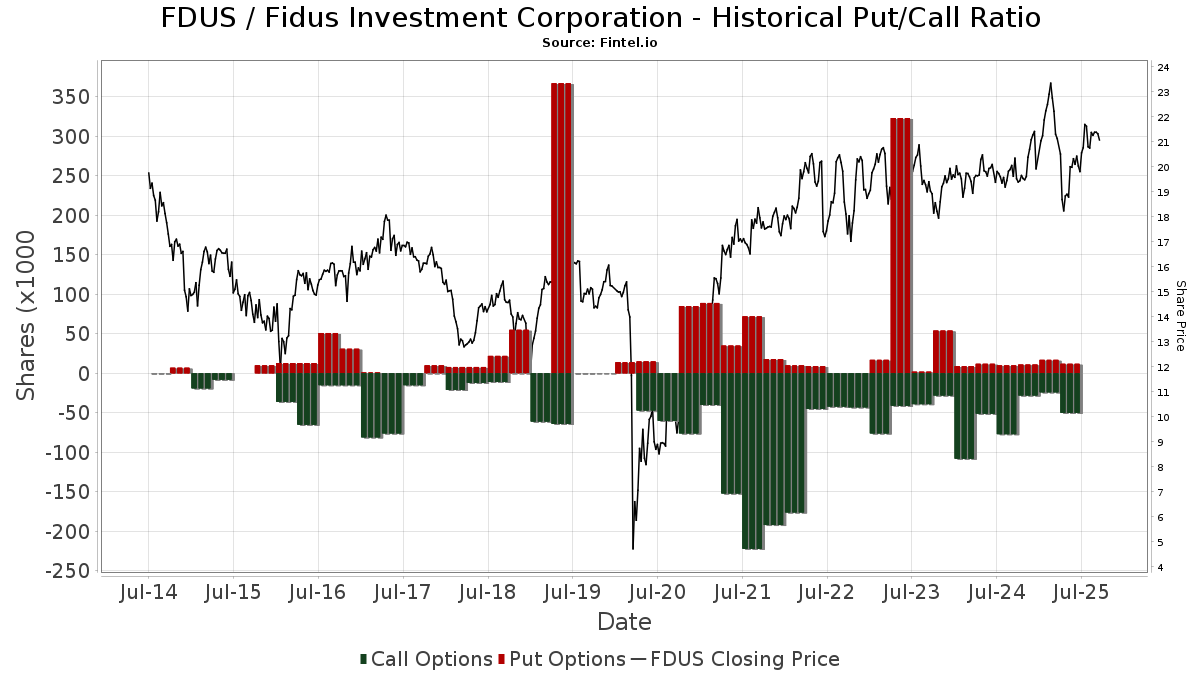
Institutionel Put/Call-forhold
Ud over at indberette standardaktie- og gældsudstedelser skal institutter med mere end 100 mill. aktiver under forvaltning også oplyse deres put- og call-optionsbeholdninger. Da salgsoptioner generelt indikerer negativ stemning, og købsoptioner indikerer positiv stemning, kan vi få en fornemmelse af den overordnede institutionelle stemning ved at plotte forholdet mellem put og kald. Diagrammet til højre viser det historiske put/call-forhold for dette instrument.
Brug af Put/Call Ratio som en indikator for investorernes stemning overvinder en af de vigtigste mangler ved at bruge totalt institutionelt ejerskab, som er, at en betydelig mængde af aktiver under forvaltning investeres passivt for at spore indekser. Passivt forvaltede fonde køber typisk ikke optioner, så indikatoren for put/call-forholdet følger mere nøje følelsen af aktivt forvaltede fonde.
13F og NPORT arkivering
Detaljer om 13F-arkivering er gratis. Detaljer om NP-ansøgninger kræver et premium-medlemskab. Grønne rækker angiver nye positioner. Røde rækker angiver lukkede positioner. Klik på linket ikon for at se den fulde transaktionshistorik.
Opgrader
for at låse premium-data op og eksportere til Excel ![]() .
.
| Fil dato | Kilde | Investor | Type | Gennemsnitlig pris (Øst) |
Aktier | Δ Aktier (%) |
Rapporteret Værdi ($1000) |
Δ Værdi (%) |
Port Alloc (%) |
|
|---|---|---|---|---|---|---|---|---|---|---|
| 2025-08-06 | 13F | First Horizon Advisors, Inc. | 2.658 | 154,84 | 54 | 152,38 | ||||
| 2025-05-05 | 13F | IFP Advisors, Inc | 0 | -100,00 | 0 | |||||
| 2025-08-14 | 13F | Group One Trading, L.p. | Call | 1.800 | 36 | |||||
| 2025-08-01 | 13F | Envestnet Asset Management Inc | 359.415 | 10,84 | 7.260 | 9,80 | ||||
| 2025-08-13 | 13F | Plan Group Financial, LLC | 49.763 | 38,85 | 1.005 | 37,67 | ||||
| 2025-07-22 | 13F | DAVENPORT & Co LLC | 36.237 | 0,00 | 732 | -0,95 | ||||
| 2025-08-08 | 13F | Capital Investment Advisory Services, LLC | 84.524 | 13,97 | 1.707 | 12,90 | ||||
| 2025-07-10 | 13F | Atticus Wealth Management, Llc | 3.816 | 77 | ||||||
| 2025-08-14 | 13F | Group One Trading, L.p. | Put | 100 | 2 | |||||
| 2025-08-14 | 13F | Quarry LP | 2.366 | 71,45 | 48 | 67,86 | ||||
| 2025-08-04 | 13F | Muzinich & Co., Inc. | 190.228 | 106,50 | 3.843 | 104,58 | ||||
| 2025-07-31 | 13F | Caitong International Asset Management Co., Ltd | 4 | 100,00 | 0 | |||||
| 2025-08-11 | 13F | Hexagon Capital Partners LLC | 0 | -100,00 | 0 | |||||
| 2025-08-14 | 13F | GWM Advisors LLC | 91.113 | -10,24 | 1.840 | -11,07 | ||||
| 2025-08-07 | 13F | Campbell & CO Investment Adviser LLC | 23.049 | -34,36 | 466 | -35,06 | ||||
| 2025-07-28 | NP | KBWD - Invesco KBW High Dividend Yield Financial ETF This fund is a listed as child fund of Invesco Ltd. and if that institution has disclosed ownership in this security, then these positions will not be double counted when calculating total shares and total value | 430.044 | -21,66 | 8.812 | -31,08 | ||||
| 2025-08-14 | 13F | Verition Fund Management LLC | 14.100 | 285 | ||||||
| 2025-08-12 | 13F | Legal & General Group Plc | 228.512 | 0,94 | 4.616 | -0,02 | ||||
| 2025-07-21 | 13F | Ameritas Advisory Services, LLC | 200 | 4 | ||||||
| 2025-08-12 | 13F | Cornerstone Wealth Management, LLC | 27.173 | 7,80 | 549 | 6,82 | ||||
| 2025-08-13 | 13F | Level Four Advisory Services, Llc | 30.487 | -13,98 | 616 | -14,82 | ||||
| 2025-08-04 | 13F | MeadowBrook Investment Advisors LLC | 2.850 | 90,00 | 58 | 90,00 | ||||
| 2025-08-29 | NP | JAFEX - Total Stock Market Index Trust NAV | 641 | 19,37 | 13 | 9,09 | ||||
| 2025-05-14 | 13F | Virtus ETF Advisers LLC | 0 | -100,00 | 0 | |||||
| 2025-07-10 | 13F | Capital Advisory Group Advisory Services, LLC | 77.618 | 1,98 | 1.568 | 1,03 | ||||
| 2025-08-08 | 13F | Hartland & Co., LLC | 20.661 | 0,44 | 417 | -0,48 | ||||
| 2025-05-16 | 13F | McIlrath & Eck, LLC | 0 | -100,00 | 0 | |||||
| 2025-07-18 | 13F | Truist Financial Corp | 45.703 | -2,67 | 909 | -5,12 | ||||
| 2025-07-29 | 13F | TrueMark Investments, LLC | 0 | -100,00 | 0 | |||||
| 2025-08-11 | 13F | Brown Brothers Harriman & Co | 5.337 | 0,00 | 108 | -0,93 | ||||
| 2025-07-17 | 13F | Janney Montgomery Scott LLC | 10.463 | 0,00 | 0 | |||||
| 2025-08-14 | 13F | Stifel Financial Corp | 13.995 | -21,95 | 283 | -22,74 | ||||
| 2025-08-13 | 13F | Virtus Investment Advisers, Inc. | 41.255 | -2,66 | 833 | -3,59 | ||||
| 2025-08-14 | 13F | Quantinno Capital Management LP | 27.165 | 549 | ||||||
| 2025-08-14 | 13F | Bnp Paribas Arbitrage, Sa | 38 | 1 | ||||||
| 2025-06-18 | NP | Putnam ETF Trust - Putnam BDC ETF - | 166.576 | 17,21 | 3.148 | -2,02 | ||||
| 2025-05-02 | 13F | Hager Investment Management Services, Llc | 0 | -100,00 | 0 | |||||
| 2025-07-23 | 13F | Morey & Quinn Wealth Partners, LLC | 14.778 | 0,00 | 299 | -1,00 | ||||
| 2025-08-14 | 13F | Smartleaf Asset Management LLC | 7 | 0,00 | 0 | |||||
| 2025-07-23 | 13F | 1 North Wealth Services Llc | 600 | 0,00 | 12 | 0,00 | ||||
| 2025-08-13 | 13F | Advisory Research Inc | 10.574 | 6,14 | 214 | 4,93 | ||||
| 2025-08-14 | 13F | Summit Trail Advisors, Llc | 22.502 | 455 | ||||||
| 2025-08-14 | 13F | Mercer Global Advisors Inc /adv | 29.783 | 602 | ||||||
| 2025-07-07 | 13F | Enterprise Bank & Trust Co | 55.912 | 0,00 | 1.129 | -0,96 | ||||
| 2025-07-24 | 13F | Capital Advisors, Ltd. LLC | 2.250 | 0,00 | 0 | |||||
| 2025-08-01 | 13F | Y-Intercept (Hong Kong) Ltd | 62.361 | 472,96 | 1.260 | 469,68 | ||||
| 2025-07-08 | 13F | Davis Investment Partners, LLC | 77.104 | -5,57 | 1.570 | 5,73 | ||||
| 2025-07-16 | 13F | Eagle Global Advisors Llc | 22.325 | 56,01 | 451 | 54,64 | ||||
| 2025-05-30 | NP | ERNZ - TrueShares Active Yield ETF | 11.462 | -85,27 | 234 | -85,75 | ||||
| 2025-08-05 | 13F | Palogic Value Management, L.P. | 69.101 | 2,65 | 1.396 | 1,68 | ||||
| 2025-08-13 | 13F | Mackenzie Financial Corp | 0 | -100,00 | 0 | |||||
| 2025-08-11 | 13F | Private Advisor Group, LLC | 14.734 | 29,12 | 298 | 28,02 | ||||
| 2025-08-21 | NP | BIZD - VanEck Vectors BDC Income ETF | 793.209 | 6,18 | 16.023 | 5,19 | ||||
| 2025-08-01 | 13F | Koss-Olinger Consulting, LLC | 16.153 | 326 | ||||||
| 2025-05-14 | 13F | Credit Agricole S A | 47.649 | 0,00 | 972 | -3,00 | ||||
| 2025-07-16 | 13F | ORG Partners LLC | 1.416 | 0,00 | 29 | -3,45 | ||||
| 2025-08-25 | 13F/A | Promus Capital, LLC | 2.023 | 0,00 | 41 | -2,44 | ||||
| 2025-07-31 | 13F | MQS Management LLC | 36.583 | -20,28 | 739 | -21,07 | ||||
| 2025-07-11 | 13F | Farther Finance Advisors, LLC | 7.346 | -2,92 | 148 | -5,13 | ||||
| 2025-08-12 | 13F | Jpmorgan Chase & Co | 4.398 | -66,67 | 89 | -67,29 | ||||
| 2025-08-08 | 13F | Pnc Financial Services Group, Inc. | 750 | 0,00 | 15 | 0,00 | ||||
| 2025-08-13 | 13F | Natixis | 26.751 | 0,00 | 539 | -1,47 | ||||
| 2025-07-24 | 13F | Blair William & Co/il | 0 | -100,00 | 0 | |||||
| 2025-05-05 | 13F | Transce3nd, LLC | 0 | -100,00 | 0 | |||||
| 2025-07-11 | 13F | Kingstone Capital Partners Texas, LLC | 27.409.759 | 549 | ||||||
| 2025-07-31 | 13F | Oak Harbor Wealth Partners, Llc | 17.981 | 0,00 | 363 | -0,82 | ||||
| 2025-07-25 | 13F | Atria Wealth Solutions, Inc. | 10.089 | 204 | ||||||
| 2025-06-27 | NP | LBO - WHITEWOLF Publicly Listed Private Equity ETF | 676 | 14,19 | 13 | -7,69 | ||||
| 2025-08-12 | 13F | Steward Partners Investment Advisory, Llc | 25.284 | 7,89 | 511 | 6,92 | ||||
| 2025-08-13 | 13F | Quantbot Technologies LP | 9.047 | -7,65 | 183 | -8,54 | ||||
| 2025-08-14 | 13F | Bank Of America Corp /de/ | 17.673 | -2,65 | 357 | -3,78 | ||||
| 2025-07-31 | 13F | Sumitomo Mitsui Trust Holdings, Inc. | 152.463 | 68,49 | 3.080 | 66,88 | ||||
| 2025-08-14 | 13F | Royal Bank Of Canada | 12.088 | 5,72 | 244 | 4,72 | ||||
| 2025-08-07 | 13F | Hennion & Walsh Asset Management, Inc. | 44.016 | 0,05 | 889 | -0,89 | ||||
| 2025-08-12 | 13F | BlackRock, Inc. | 193.153 | 30,75 | 3.902 | 29,52 | ||||
| 2025-08-13 | 13F | Millstone Evans Group, LLC | 3.686 | 0,00 | 74 | -1,33 | ||||
| 2025-08-14 | 13F | Jane Street Group, Llc | 0 | -100,00 | 0 | |||||
| 2025-08-15 | 13F | Morgan Stanley | 267.445 | -12,38 | 5.402 | -13,19 | ||||
| 2025-08-15 | 13F | Great West Life Assurance Co /can/ | 33.094 | 4,65 | 1 | |||||
| 2025-08-18 | 13F | N.E.W. Advisory Services LLC | 62 | 0,00 | 1 | 0,00 | ||||
| 2025-08-14 | 13F | Millennium Management Llc | 0 | -100,00 | 0 | |||||
| 2025-08-06 | 13F | Prospera Financial Services Inc | 20.171 | 0,02 | 407 | -0,97 | ||||
| 2025-08-13 | 13F | Beacon Pointe Advisors, LLC | 22.628 | 457 | ||||||
| 2025-08-18 | 13F | Geneos Wealth Management Inc. | 51 | 0,00 | 1 | 0,00 | ||||
| 2025-08-14 | 13F | Van Eck Associates Corp | 846.994 | 10,94 | 17 | 13,33 | ||||
| 2025-07-14 | 13F | Golden State Equity Partners | 15.740 | 318 | ||||||
| 2025-07-10 | 13F | Wealth Enhancement Advisory Services, Llc | 20.462 | 13,39 | 425 | 15,80 | ||||
| 2025-08-13 | 13F | Baird Financial Group, Inc. | 313.002 | 10,57 | 6.323 | 9,53 | ||||
| 2025-08-08 | 13F | Cetera Investment Advisers | 370.335 | 10,38 | 7.481 | 9,36 | ||||
| 2025-07-14 | 13F | AdvisorNet Financial, Inc | 1.728 | 137,36 | 35 | 142,86 | ||||
| 2025-08-12 | 13F | Virtu Financial LLC | 0 | -100,00 | 0 | |||||
| 2025-08-08 | 13F | Accredited Investors Inc. | 20.000 | 404 | ||||||
| 2025-08-14 | 13F | Wells Fargo & Company/mn | 23.887 | -14,58 | 483 | -15,44 | ||||
| 2025-07-31 | 13F | Optimum Investment Advisors | 20.393 | 9,32 | 412 | 8,16 | ||||
| 2025-07-31 | 13F | Cambridge Investment Research Advisors, Inc. | 26.905 | 10,85 | 1 | |||||
| 2025-08-08 | 13F | Cedar Wealth Management, LLC | 992 | 0,00 | 20 | 0,00 | ||||
| 2025-08-05 | 13F | GPS Wealth Strategies Group, LLC | 2.739 | -36,96 | 55 | -37,50 | ||||
| 2025-06-25 | NP | VPC - Virtus Private Credit Strategy ETF | 38.715 | -12,90 | 732 | -27,19 | ||||
| 2025-05-14 | 13F | Comerica Bank | 0 | -100,00 | 0 | |||||
| 2025-07-31 | 13F | Peterson Wealth Services | 122 | 0,83 | 2 | 0,00 | ||||
| 2025-05-13 | 13F | Neuberger Berman Group LLC | 0 | -100,00 | 0 | |||||
| 2025-07-29 | 13F | Stratos Wealth Partners, LTD. | 26.200 | 61,73 | 529 | 60,30 | ||||
| 2025-08-04 | 13F | Spire Wealth Management | 0 | -100,00 | 0 | |||||
| 2025-08-14 | 13F | Bragg Financial Advisors, Inc | 13.011 | 0,00 | 263 | -1,13 | ||||
| 2025-08-14 | 13F | Aquatic Capital Management LLC | 0 | -100,00 | 0 | |||||
| 2025-08-14 | 13F | Raymond James Financial Inc | 813.702 | -13,26 | 16.437 | -14,07 | ||||
| 2025-07-09 | 13F | Fiduciary Alliance LLC | 13.025 | 0,00 | 263 | -0,75 | ||||
| 2025-07-17 | 13F | GraniteShares Advisors LLC | 132.532 | 6,67 | 2.677 | 5,68 | ||||
| 2025-08-14 | 13F | Citadel Advisors Llc | Call | 24.800 | 10,22 | 501 | 9,17 | |||
| 2025-08-13 | 13F | Northwestern Mutual Wealth Management Co | 150 | 3 | ||||||
| 2025-08-25 | NP | TMVAX - RBC Microcap Value Fund A Shares | 4.400 | 0,00 | 89 | -1,12 | ||||
| 2025-04-21 | 13F | Nelson, Van Denburg & Campbell Wealth Management Group, LLC | 0 | -100,00 | 0 | |||||
| 2025-08-12 | 13F | Advisors Asset Management, Inc. | 154.610 | -27,54 | 3.123 | -28,21 | ||||
| 2025-07-23 | 13F | Columbus Macro, LLC | 322.543 | 12,14 | 6.515 | 11,10 | ||||
| 2025-07-31 | 13F | Oppenheimer & Co Inc | 20.323 | 6,82 | 411 | 5,94 | ||||
| 2025-08-06 | 13F | Ethos Financial Group, LLC | 137.365 | 2,22 | 2.775 | 1,24 | ||||
| 2025-08-12 | 13F | Dynamic Technology Lab Private Ltd | 0 | -100,00 | 0 | |||||
| 2025-08-12 | 13F | MAI Capital Management | 3.132 | 0,00 | 63 | 0,00 | ||||
| 2025-08-15 | 13F | Tower Research Capital LLC (TRC) | 699 | 2.812,50 | 14 | |||||
| 2025-08-12 | 13F | Franklin Resources Inc | 167.016 | -0,42 | 3.374 | -1,35 | ||||
| 2025-07-25 | 13F | Cwm, Llc | 749 | 1.602,27 | 0 | |||||
| 2025-08-14 | 13F | Mariner, LLC | 11.515 | 13,68 | 233 | 12,62 | ||||
| 2025-08-11 | 13F | HighTower Advisors, LLC | 90.865 | 0,22 | 1.835 | -0,70 | ||||
| 2025-08-12 | 13F | Laurel Wealth Advisors LLC | 31.755 | 7.588,86 | 2 | -87,50 | ||||
| 2025-07-17 | 13F | HB Wealth Management, LLC | 13.599 | 0,00 | 275 | -1,08 | ||||
| 2025-08-11 | 13F | Citigroup Inc | 0 | -100,00 | 0 | |||||
| 2025-08-12 | 13F | Trexquant Investment LP | 76.533 | 56,54 | 1.546 | 55,12 | ||||
| 2025-08-13 | 13F | Legacy Capital Wealth Partners, LLC | 66.037 | -2,68 | 1.334 | -3,62 | ||||
| 2025-08-12 | 13F | Global Retirement Partners, LLC | 788 | 16 | ||||||
| 2025-08-14 | 13F | Two Sigma Investments, Lp | 287.879 | -27,85 | 5.815 | -28,52 | ||||
| 2025-07-29 | 13F | Novare Capital Management Llc | 190.275 | 0,60 | 3.844 | -0,34 | ||||
| 2025-08-14 | 13F | Qube Research & Technologies Ltd | 64.929 | 39,81 | 1.312 | 38,58 | ||||
| 2025-09-04 | 13F/A | Advisor Group Holdings, Inc. | 13.092 | 7,56 | 264 | 6,45 | ||||
| 2025-08-29 | NP | GraniteShares ETF Trust - GraniteShares HIPS US High Income ETF | 132.532 | 6,67 | 2.677 | 5,68 | ||||
| 2025-08-06 | 13F | Commonwealth Equity Services, Llc | 35.124 | 20,65 | 1 | |||||
| 2025-07-08 | 13F | Nbc Securities, Inc. | 0 | -100,00 | 0 | |||||
| 2025-08-12 | 13F | LPL Financial LLC | 82.993 | -3,48 | 1.676 | -4,39 | ||||
| 2025-07-22 | 13F | Sage Investment Counsel LLC | 12.070 | 0,00 | 244 | -1,22 | ||||
| 2025-07-15 | 13F | Riverbridge Partners Llc | 38.975 | 3,92 | 787 | 3,01 | ||||
| 2025-08-07 | 13F | PFG Advisors | 188.495 | 3,76 | 3.808 | 2,81 | ||||
| 2025-08-12 | 13F | Proequities, Inc. | Put | 0 | 0 | |||||
| 2025-08-12 | 13F | Proequities, Inc. | Call | 0 | 0 | |||||
| 2025-08-12 | 13F | Proequities, Inc. | 0 | 0 | ||||||
| 2025-08-14 | 13F | Citadel Advisors Llc | Put | 0 | -100,00 | 0 | ||||
| 2025-08-13 | 13F | Russell Investments Group, Ltd. | 72 | 0,00 | 1 | 0,00 | ||||
| 2025-08-14 | 13F | UBS Group AG | 298.390 | 50,83 | 6.027 | 49,44 | ||||
| 2025-08-14 | 13F | Susquehanna International Group, Llp | 0 | -100,00 | 0 | |||||
| 2025-08-14 | 13F | Hrt Financial Lp | 54.066 | 26,75 | 1 | |||||
| 2025-08-14 | 13F | Susquehanna International Group, Llp | Call | 24.000 | 485 | |||||
| 2025-08-14 | 13F | IHT Wealth Management, LLC | 69.581 | 10,12 | 1.406 | 9,08 | ||||
| 2025-08-14 | 13F | Susquehanna International Group, Llp | Put | 12.000 | -7,69 | 242 | -8,68 | |||
| 2025-08-13 | 13F | Invesco Ltd. | 446.703 | 2,20 | 9.023 | 1,26 | ||||
| 2025-05-13 | 13F | EverSource Wealth Advisors, LLC | 0 | -100,00 | 0 | |||||
| 2025-08-14 | 13F | Ameriprise Financial Inc | 92.080 | -13,40 | 1.858 | -13,14 | ||||
| 2025-08-14 | 13F | MGB Wealth Management, LLC | 89.775 | 2,07 | 1.807 | 0,61 | ||||
| 2025-08-11 | 13F | Greenland Capital Management LP | 53.190 | -9,39 | 1.074 | -10,20 | ||||
| 2025-07-17 | 13F | Sound Income Strategies, LLC | 1.898 | -63,27 | 38 | -63,81 | ||||
| 2025-07-30 | 13F | D.a. Davidson & Co. | 115.872 | 159,06 | 2.341 | 156,86 | ||||
| 2025-08-05 | 13F | Simplex Trading, Llc | Put | 200 | 100,00 | 0 | ||||
| 2025-08-05 | 13F | Simplex Trading, Llc | 16.458 | 0 | ||||||
| 2025-08-05 | 13F | Simplex Trading, Llc | Call | 100 | -95,65 | 0 | ||||
| 2025-08-14 | 13F | Two Sigma Advisers, Lp | 380.613 | -8,49 | 7.688 | -9,34 | ||||
| 2025-08-13 | 13F | Northern Trust Corp | 20.202 | 408 | ||||||
| 2025-08-14 | 13F | Citadel Advisors Llc | 0 | -100,00 | 0 | |||||
| 2025-05-06 | 13F | WT Wealth Management | 53.376 | -3,72 | 1.088 | -6,61 |