Grundlæggende statistik
| Institutionelle ejere | 235 total, 231 long only, 0 short only, 4 long/short - change of 18,69% MRQ |
| Gennemsnitlig porteføljeallokering | 0.2704 % - change of 117,09% MRQ |
| Institutionelle aktier (lange) | 76.909.085 (ex 13D/G) - change of 38,58MM shares 100,68% MRQ |
| Institutionel værdi (lang) | $ 1.426.824 USD ($1000) |
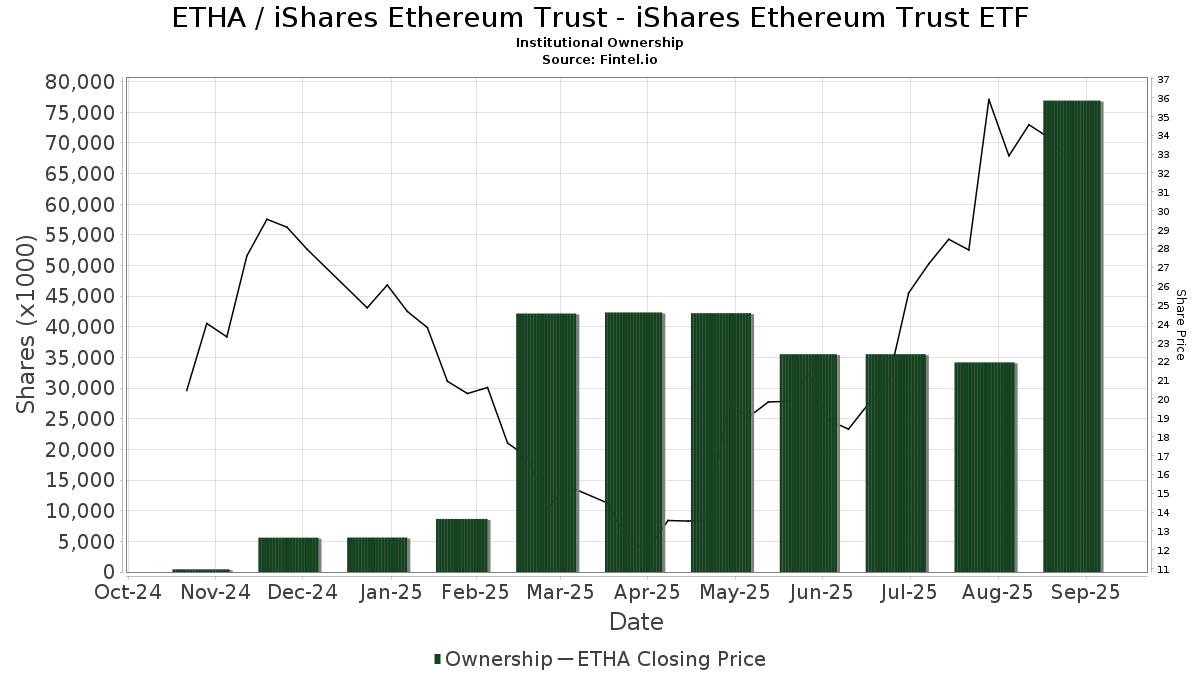
Institutionelt ejerskab og aktionærer
iShares Ethereum Trust - iShares Ethereum Trust ETF (US:ETHA) har 235 institutionelle ejere og aktionærer, der har indsendt 13D/G- eller 13F-formularer til Securities Exchange Commission (SEC). Disse institutioner har i alt 76,909,085 aktier. Største aktionærer omfatter Goldman Sachs Group Inc, Jane Street Group, Llc, Millennium Management Llc, Capula Management Ltd, Schonfeld Strategic Advisors LLC, D. E. Shaw & Co., Inc., Susquehanna International Group, Llp, Citadel Advisors Llc, Jane Street Group, Llc, and BlueCrest Capital Management Ltd .
iShares Ethereum Trust - iShares Ethereum Trust ETF (NasdaqGM:ETHA) institutionel ejerskabsstruktur viser aktuelle positioner i virksomheden efter institutioner og fonde, samt seneste ændringer i positionsstørrelse. Større aktionærer kan omfatte individuelle investorer, investeringsforeninger, hedgefonde eller institutioner. Skema 13D angiver, at investoren besidder (eller besidder) mere end 5 % af virksomheden og har til hensigt (eller har til hensigt at) aktivt at forfølge en ændring i forretningsstrategi. Skema 13G indikerer en passiv investering på over 5%.
The share price as of September 15, 2025 is 34,01 / share. Previously, on September 16, 2024, the share price was 17,23 / share. This represents an increase of 97,39% over that period.
Fondens stemningsscore
Fund Sentiment Score (fka Ownership Accumulation Score) finder de aktier, der bliver mest købt af fonde. Det er resultatet af en sofistikeret, multi-faktor kvantitativ model, der identificerer virksomheder med de højeste niveauer af institutionel akkumulering. Scoringsmodellen bruger en kombination af den samlede stigning i oplyste ejere, ændringerne i porteføljeallokeringer i disse ejere og andre målinger. Tallet går fra 0 til 100, hvor højere tal indikerer et højere niveau af akkumulering for sine jævnaldrende, og 50 er gennemsnittet.
Opdateringsfrekvens: Dagligt
Se Ownership Explorer, som giver en liste over højest rangerende virksomheder.
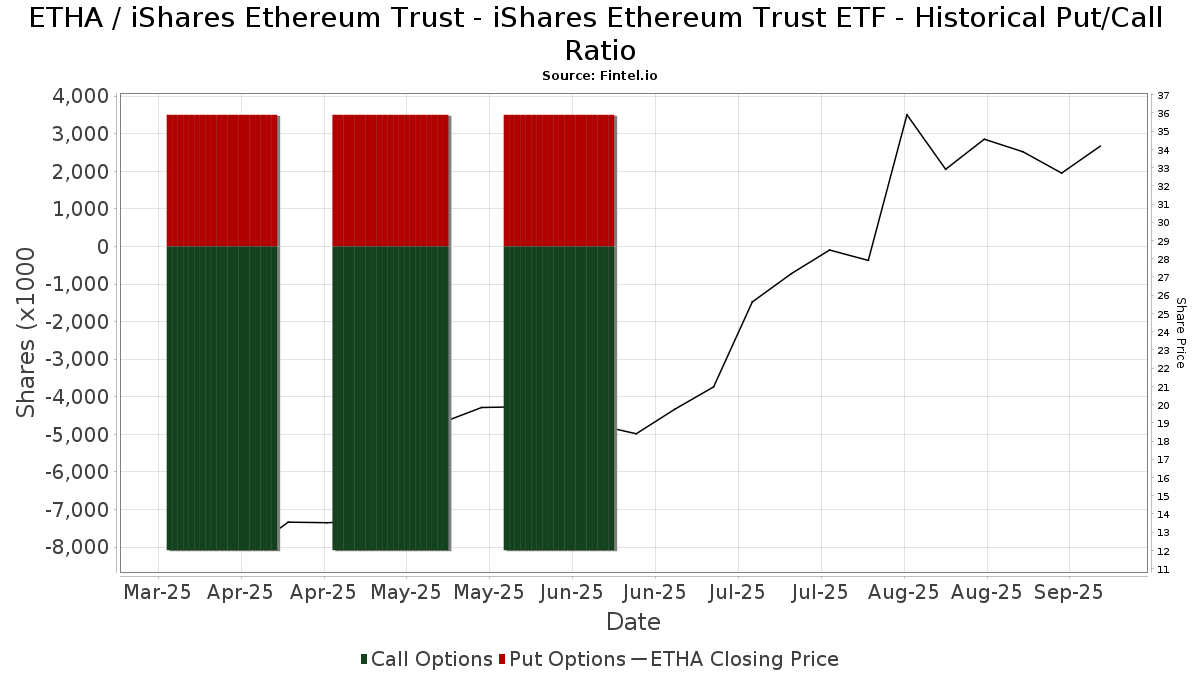
Institutionel Put/Call-forhold
Ud over at indberette standardaktie- og gældsudstedelser skal institutter med mere end 100 mill. aktiver under forvaltning også oplyse deres put- og call-optionsbeholdninger. Da salgsoptioner generelt indikerer negativ stemning, og købsoptioner indikerer positiv stemning, kan vi få en fornemmelse af den overordnede institutionelle stemning ved at plotte forholdet mellem put og kald. Diagrammet til højre viser det historiske put/call-forhold for dette instrument.
Brug af Put/Call Ratio som en indikator for investorernes stemning overvinder en af de vigtigste mangler ved at bruge totalt institutionelt ejerskab, som er, at en betydelig mængde af aktiver under forvaltning investeres passivt for at spore indekser. Passivt forvaltede fonde køber typisk ikke optioner, så indikatoren for put/call-forholdet følger mere nøje følelsen af aktivt forvaltede fonde.
13F og NPORT arkivering
Detaljer om 13F-arkivering er gratis. Detaljer om NP-ansøgninger kræver et premium-medlemskab. Grønne rækker angiver nye positioner. Røde rækker angiver lukkede positioner. Klik på linket ikon for at se den fulde transaktionshistorik.
Opgrader
for at låse premium-data op og eksportere til Excel ![]() .
.
| Fil dato | Kilde | Investor | Type | Gennemsnitlig pris (Øst) |
Aktier | Δ Aktier (%) |
Rapporteret Værdi ($1000) |
Δ Værdi (%) |
Port Alloc (%) |
|
|---|---|---|---|---|---|---|---|---|---|---|
| 2025-08-06 | 13F | North Capital, Inc. | 25 | 0 | ||||||
| 2025-08-07 | 13F | Fountainhead AM, LLC | 57.690 | 0,73 | 1.100 | 39,06 | ||||
| 2025-05-06 | 13F | VCI Wealth Management LLC | 0 | -100,00 | 0 | |||||
| 2025-07-17 | 13F | Catalytic Wealth RIA, LLC | 0 | -100,00 | 0 | |||||
| 2025-08-07 | 13F | WESCAP Management Group, Inc. | 30.175 | 0,00 | 575 | 37,89 | ||||
| 2025-08-14 | 13F | LaSalle St. Investment Advisors, LLC | 100.000 | 400,00 | 2 | |||||
| 2025-08-18 | 13F | Geneos Wealth Management Inc. | 11.208 | 156,83 | 214 | 255,00 | ||||
| 2025-07-22 | 13F | Valley National Advisers Inc | 118 | 0,00 | 0 | |||||
| 2025-05-15 | 13F | Hrt Financial Lp | 0 | -100,00 | 0 | |||||
| 2025-07-31 | 13F | Glass Jacobson Investment Advisors llc | 300 | 1.100,00 | 6 | |||||
| 2025-08-06 | 13F | New Millennium Group LLC | 2 | 0,00 | 0 | |||||
| 2025-08-08 | 13F | Emerald Investment Partners, Llc | 12.662 | 241 | ||||||
| 2025-08-11 | 13F | Principal Securities, Inc. | 10.314 | 197 | ||||||
| 2025-08-11 | 13F | Annis Gardner Whiting Capital Advisors, LLC | 255 | 5 | ||||||
| 2025-07-24 | 13F | Strong Tower Advisory Services | 19.706 | 0,00 | 376 | 63,76 | ||||
| 2025-07-09 | 13F | Fiduciary Alliance LLC | 211.932 | 46,72 | 4.042 | 102,45 | ||||
| 2025-08-13 | 13F | Northwestern Mutual Wealth Management Co | 217 | 4 | ||||||
| 2025-07-15 | 13F | North Star Investment Management Corp. | 1.550 | 0,00 | 30 | 38,10 | ||||
| 2025-08-13 | 13F | ExodusPoint Capital Management, LP | 0 | -100,00 | 0 | |||||
| 2025-05-15 | 13F | FinDec Wealth Services, Inc. | 0 | -100,00 | 0 | |||||
| 2025-08-08 | 13F | Smithfield Trust Co | 2.132 | 0,00 | 0 | |||||
| 2025-08-14 | 13F | Macquarie Group Ltd | 6.600 | 126 | ||||||
| 2025-08-12 | 13F | MAI Capital Management | 6.643 | 29,97 | 127 | 80,00 | ||||
| 2025-04-17 | 13F | Mission Wealth Management, Lp | 0 | -100,00 | 0 | |||||
| 2025-08-15 | 13F | Captrust Financial Advisors | 19.765 | 22,23 | 377 | 68,61 | ||||
| 2025-07-18 | 13F | Truist Financial Corp | 20.877 | -1,43 | 398 | 36,30 | ||||
| 2025-07-31 | 13F/A | Interchange Capital Partners, LLC | 18.190 | -18,63 | 347 | 12,34 | ||||
| 2025-04-24 | NP | FAAAX - Franklin K2 Alternative Strategies Fund Class A | 7.365 | 0,00 | 124 | -38,50 | ||||
| 2025-07-18 | 13F | SOA Wealth Advisors, LLC. | 0 | -100,00 | 0 | -100,00 | ||||
| 2025-07-28 | 13F | Axxcess Wealth Management, Llc | 20.976 | -2,44 | 400 | 34,68 | ||||
| 2025-08-13 | 13F | Sassicaia Capital Advisers Llc | 37.100 | 707 | ||||||
| 2025-08-14 | 13F | Boston Private Wealth Llc | 0 | -100,00 | 0 | |||||
| 2025-07-15 | 13F | Bfsg, Llc | 605 | 0,00 | 12 | 37,50 | ||||
| 2025-08-14 | 13F | Parkwood LLC | 392.000 | -41,67 | 7 | -22,22 | ||||
| 2025-08-05 | 13F | GPS Wealth Strategies Group, LLC | 250 | 0,00 | 5 | 33,33 | ||||
| 2025-05-02 | 13F | Bogart Wealth, LLC | 0 | -100,00 | 0 | |||||
| 2025-05-15 | 13F | Two Sigma Investments, Lp | 0 | -100,00 | 0 | |||||
| 2025-08-14 | 13F | Schonfeld Strategic Advisors LLC | 4.428.813 | 61,08 | 84.457 | 122,28 | ||||
| 2025-08-13 | 13F | EverSource Wealth Advisors, LLC | 66 | 0,00 | 1 | |||||
| 2025-05-14 | 13F | Himension Fund | 0 | -100,00 | 0 | -100,00 | ||||
| 2025-07-01 | 13F | Harbor Investment Advisory, Llc | 100 | 0,00 | 2 | 0,00 | ||||
| 2025-08-19 | 13F | Asset Dedication, LLC | 0 | -100,00 | 0 | -100,00 | ||||
| 2025-08-14 | 13F | Comerica Bank | 481 | -6,60 | 9 | 28,57 | ||||
| 2025-08-08 | 13F | Fortis Group Advisors, LLC | 8.052 | 228 | ||||||
| 2025-07-31 | 13F | Wealthfront Advisers Llc | 651.867 | -10,40 | 12.431 | 23,64 | ||||
| 2025-08-11 | 13F | Wealthspire Advisors, LLC | 18.679 | -45,87 | 356 | -25,21 | ||||
| 2025-08-14 | 13F | Tikvah Management LLC | 124.000 | 0,00 | 7.590 | 30,77 | ||||
| 2025-08-08 | 13F | Cetera Investment Advisers | 98.145 | 1.872 | ||||||
| 2025-08-13 | 13F | Beacon Pointe Advisors, LLC | 67.505 | -11,57 | 1.287 | 22,11 | ||||
| 2025-07-31 | 13F | Hartford Financial Management Inc. | 65 | 0,00 | 1 | |||||
| 2025-07-24 | 13F | Strengthening Families & Communities, LLC | 70 | 1 | ||||||
| 2025-08-14 | 13F | Royal Bank Of Canada | 1.470 | 5,38 | 27 | 42,11 | ||||
| 2025-08-14 | 13F | Raymond James Financial Inc | 13.388 | 255 | ||||||
| 2025-08-14 | 13F | Betterment LLC | 777.894 | 12,85 | 15 | 55,56 | ||||
| 2025-08-15 | 13F | Asset Allocation Strategies LLC | 16.147 | 0,00 | 308 | 37,67 | ||||
| 2025-04-25 | 13F | K.J. Harrison & Partners Inc | 0 | -100,00 | 0 | -100,00 | ||||
| 2025-05-13 | 13F | Global Endowment Management, LP | 0 | -100,00 | 0 | |||||
| 2025-08-08 | 13F | Larson Financial Group LLC | 604 | 8,05 | 12 | 57,14 | ||||
| 2025-08-14 | 13F | Mariner, LLC | 121.988 | 204,04 | 2.326 | 319,86 | ||||
| 2025-08-11 | 13F | HighTower Advisors, LLC | 64.289 | 99,31 | 1.226 | 175,28 | ||||
| 2025-08-13 | 13F | Quadrature Capital Ltd | 181.730 | 3.464 | ||||||
| 2025-08-29 | 13F | Evolution Wealth Management Inc. | 953 | 18 | ||||||
| 2025-08-13 | 13F | Twin Peaks Wealth Advisors, LLC | 30 | 1 | ||||||
| 2025-08-18 | 13F | Wolverine Trading, Llc | Put | 229.100 | 4.186 | |||||
| 2025-08-18 | 13F | Wolverine Trading, Llc | 68.093 | 1.244 | ||||||
| 2025-08-18 | 13F | Wolverine Trading, Llc | Call | 636.400 | 11.627 | |||||
| 2025-07-15 | 13F | Financial Management Professionals, Inc. | 100 | 0,00 | 2 | 0,00 | ||||
| 2025-08-14 | 13F | D. E. Shaw & Co., Inc. | 3.773.000 | 4,81 | 71.951 | 44,62 | ||||
| 2025-08-12 | 13F | LPL Financial LLC | 473.425 | 19,76 | 9.028 | 65,26 | ||||
| 2025-07-16 | 13F | Moisand Fitzgerald Tamayo, LLC | 14 | 0,00 | 0 | |||||
| 2025-08-14 | 13F | Cantor Fitzgerald, L. P. | 83.526 | -13,49 | 1.593 | 19,34 | ||||
| 2025-08-04 | 13F | Wolverine Asset Management Llc | 900.834 | 24,90 | 17.179 | 72,35 | ||||
| 2025-07-03 | 13F | Garde Capital, Inc. | 16.779 | 0,58 | 320 | 38,70 | ||||
| 2025-08-04 | 13F | Bordeaux Wealth Advisors LLC | 25.100 | 479 | ||||||
| 2025-07-24 | 13F/A | McElhenny Sheffield Capital Management, LLC | 49.511 | 0,00 | 944 | 38,01 | ||||
| 2025-08-07 | 13F | Rossmore Private Capital | 17.794 | 0,00 | 339 | 38,37 | ||||
| 2025-08-13 | 13F | Truvestments Capital Llc | 37.190 | 4.858,67 | 709 | 6.990,00 | ||||
| 2025-07-23 | 13F | Kingswood Wealth Advisors, Llc | 68.777 | 11,22 | 1.312 | 53,51 | ||||
| 2025-05-14 | 13F | Venture Visionary Partners LLC | 0 | -100,00 | 0 | |||||
| 2025-07-10 | 13F | Exchange Traded Concepts, Llc | Call | 1.250.000 | 23.838 | |||||
| 2025-08-14 | 13F | Robertson Opportunity Capital, LLC | 105.300 | 0,00 | 2.008 | 38,01 | ||||
| 2025-08-07 | 13F | Atala Financial Inc | 0 | -100,00 | 0 | |||||
| 2025-08-08 | 13F | Gts Securities Llc | 11.874 | -20,88 | 226 | 9,18 | ||||
| 2025-07-15 | 13F | Kagan Cocozza Asset Management | 11.060 | 0,00 | 211 | 38,16 | ||||
| 2025-08-12 | 13F | Insigneo Advisory Services, Llc | 97.853 | 1,74 | 1.866 | 40,41 | ||||
| 2025-08-12 | 13F | Stevens Capital Management Lp | 13.513 | 0 | ||||||
| 2025-07-23 | 13F | High Note Wealth, LLC | 350 | 7 | ||||||
| 2025-07-25 | 13F | Stonehage Fleming Financial Services Holdings Ltd | 1.234 | 0,00 | 24 | 35,29 | ||||
| 2025-07-23 | 13F | Joel Isaacson & Co., LLC | 20.275 | -1,05 | 387 | 36,40 | ||||
| 2025-08-14 | 13F | Hilltop Holdings Inc. | 0 | -100,00 | 0 | |||||
| 2025-07-23 | 13F | Fluent Financial, LLC | 35.374 | 675 | ||||||
| 2025-08-11 | 13F | Platform Technology Partners | 31.086 | 593 | ||||||
| 2025-04-14 | 13F | Umb Bank N A/mo | 0 | -100,00 | 0 | -100,00 | ||||
| 2025-07-30 | 13F | ARK Investment Management LLC | 6.302 | 0,00 | 120 | 37,93 | ||||
| 2025-08-06 | 13F | Pekin Hardy Strauss, Inc. | 134.845 | 390,08 | 2.571 | 576,58 | ||||
| 2025-08-06 | 13F | Kedalion Capital Management LLP | 481.000 | 9.173 | ||||||
| 2025-05-14 | 13F | Crcm Lp | 0 | -100,00 | 0 | |||||
| 2025-09-04 | 13F/A | Advisor Group Holdings, Inc. | 24.731 | 304,56 | 367 | 336,90 | ||||
| 2025-07-07 | 13F | Thurston, Springer, Miller, Herd & Titak, Inc. | 320 | 6 | ||||||
| 2025-08-08 | 13F | Creative Planning | 53.541 | 18,45 | 1.021 | 63,62 | ||||
| 2025-08-12 | 13F | Richard W. Paul & Associates, LLC | 3.224 | 8,08 | 61 | 48,78 | ||||
| 2025-08-13 | 13F | Diametric Capital, LP | 15.046 | 287 | ||||||
| 2025-08-12 | 13F | Steward Partners Investment Advisory, Llc | 2.300 | 44 | ||||||
| 2025-05-15 | 13F | Sculptor Capital LP | 0 | -100,00 | 0 | |||||
| 2025-08-14 | 13F | Ionic Capital Management LLC | 25.000 | 477 | ||||||
| 2025-07-25 | 13F | Concurrent Investment Advisors, LLC | 126.729 | 2.417 | ||||||
| 2025-08-04 | 13F | Deuterium Capital Management, LLC | 30.000 | 0,00 | 572 | 38,16 | ||||
| 2025-08-14 | 13F | Clark Capital Management Group, Inc. | 128.480 | -33,37 | 2.450 | -8,03 | ||||
| 2025-08-11 | 13F | Persistent Asset Partners Ltd | 85.897 | 1.638 | ||||||
| 2025-07-16 | 13F | Highline Wealth Partners Llc | 750 | 0,00 | 14 | 40,00 | ||||
| 2025-07-21 | 13F | Andina Capital Management, LLC | 38.664 | 37,84 | 737 | 90,44 | ||||
| 2025-08-13 | 13F | WCG Wealth Advisors LLC | 34.081 | 31,94 | 650 | 82,30 | ||||
| 2025-06-26 | NP | DECO - SPDR Galaxy Digital Asset Ecosystem ETF | 0 | -100,00 | 0 | -100,00 | ||||
| 2025-07-15 | 13F | SJS Investment Consulting Inc. | 389 | 0,00 | 7 | 40,00 | ||||
| 2025-08-11 | 13F | Tidemark, LLC | 198 | 4 | ||||||
| 2025-08-12 | 13F | J.w. Cole Advisors, Inc. | 33.501 | 639 | ||||||
| 2025-06-26 | NP | HECO - SPDR Galaxy Hedged Digital Asset Ecosystem ETF | 0 | -100,00 | 0 | -100,00 | ||||
| 2025-08-08 | 13F | Hartland & Co., LLC | 1.240 | 0,00 | 24 | 35,29 | ||||
| 2025-05-12 | 13F | National Bank Of Canada /fi/ | 0 | -100,00 | 0 | -100,00 | ||||
| 2025-08-14 | 13F | Citadel Advisors Llc | Put | 625.500 | 11.928 | |||||
| 2025-08-13 | 13F | Cerity Partners LLC | 783.008 | 119,70 | 14.932 | 203,17 | ||||
| 2025-08-14 | 13F | Brevan Howard Capital Management LP | 43.675 | 806 | ||||||
| 2025-07-17 | 13F | Nelson, Van Denburg & Campbell Wealth Management Group, LLC | 13.770 | -0,39 | 263 | 37,17 | ||||
| 2025-08-01 | 13F | Belvedere Trading LLC | 13.585 | 259 | ||||||
| 2025-08-14 | 13F | Citadel Advisors Llc | 2.319.250 | 71,18 | 44.228 | 136,21 | ||||
| 2025-08-01 | 13F | Belvedere Trading LLC | Call | 1.500 | 29 | |||||
| 2025-08-11 | 13F | Elequin Capital Lp | 712.497 | 9.277,43 | 13.587 | 12.840,00 | ||||
| 2025-08-14 | 13F | Bank Of America Corp /de/ | 3.700 | 0,00 | 71 | 37,25 | ||||
| 2025-07-17 | 13F | Wolff Wiese Magana Llc | 1.277 | -35,89 | 24 | -11,11 | ||||
| 2025-08-14 | 13F | Citadel Advisors Llc | Call | 1.109.600 | 21.160 | |||||
| 2025-08-14 | 13F | Apollo Management Holdings, L.P. | 0 | -100,00 | 0 | |||||
| 2025-07-25 | 13F | Cwm, Llc | 34.814 | 74,31 | 1 | |||||
| 2025-08-12 | 13F | XTX Topco Ltd | 20.647 | 394 | ||||||
| 2025-08-13 | 13F | BCJ Capital Management, LLC | 10.500 | 200 | ||||||
| 2025-08-15 | 13F | CI Private Wealth, LLC | 14.420 | 275 | ||||||
| 2025-05-15 | 13F | London & Capital Asset Management Ltd | 0 | -100,00 | 0 | -100,00 | ||||
| 2025-08-14 | 13F | Van Eck Associates Corp | 0 | -100,00 | 0 | |||||
| 2025-08-14 | 13F | Susquehanna International Group, Llp | Put | 1.109.900 | 21.166 | |||||
| 2025-08-15 | 13F | Kestra Advisory Services, LLC | 13.325 | 11,52 | 254 | 53,94 | ||||
| 2025-08-14 | 13F | Susquehanna International Group, Llp | 939.054 | 99,84 | 17.908 | 175,75 | ||||
| 2025-08-14 | 13F | BlueCrest Capital Management Ltd | 1.500.000 | 28.605 | ||||||
| 2025-08-14 | 13F | Susquehanna International Group, Llp | Call | 3.321.200 | 63.335 | |||||
| 2025-08-12 | 13F | CIBC Private Wealth Group, LLC | 571 | -78,85 | 11 | -65,52 | ||||
| 2025-08-13 | 13F | Flow Traders U.s. Llc | 0 | -100,00 | 0 | |||||
| 2025-07-28 | 13F | RFG Advisory, LLC | 47.304 | 131,38 | 902 | 219,86 | ||||
| 2025-04-10 | 13F | Watershed Private Wealth Llc | 0 | -100,00 | 0 | |||||
| 2025-04-22 | 13F | Synergy Financial Management, LLC | 0 | -100,00 | 0 | |||||
| 2025-07-14 | 13F | Cobblestone Asset Management LLC | 76.020 | 30,57 | 1.450 | 80,22 | ||||
| 2025-07-31 | 13F | Cambridge Investment Research Advisors, Inc. | 108.096 | 16,26 | 2 | 100,00 | ||||
| 2025-08-14 | 13F | Smartleaf Asset Management LLC | 0 | -100,00 | 0 | |||||
| 2025-08-12 | 13F | Global Retirement Partners, LLC | 69.314 | 9,54 | 1.322 | -17,44 | ||||
| 2025-08-12 | 13F | Jpmorgan Chase & Co | 111 | -97,85 | 2 | -97,18 | ||||
| 2025-07-11 | 13F | Farther Finance Advisors, LLC | 16.855 | 250,49 | 321 | 365,22 | ||||
| 2025-08-12 | 13F | Park Square Financial Group, LLC | 59 | 136,00 | 1 | |||||
| 2025-08-13 | 13F | Kilter Group LLC | 750 | 14 | ||||||
| 2025-08-14 | 13F | Vienna Asset Management LLC | 247.027 | 4.711 | ||||||
| 2025-07-17 | 13F | DiNuzzo Private Wealth, Inc. | 200 | 0,00 | 4 | 50,00 | ||||
| 2025-08-13 | 13F | Clear Street Derivatives LLC | 0 | -100,00 | 0 | |||||
| 2025-08-14 | 13F | Dagco, Inc. | 449 | 12,25 | 9 | 60,00 | ||||
| 2025-08-15 | 13F | Provenance Wealth Advisors, LLC | 873 | 0,00 | 17 | 33,33 | ||||
| 2025-08-14 | 13F | Financial Engines Advisors L.L.C. | 94.472 | 0,93 | 1.802 | 39,26 | ||||
| 2025-07-18 | 13F | Precision Wealth Strategies, LLC | 15.951 | 27,30 | 304 | 75,72 | ||||
| 2025-07-21 | 13F | Patriot Financial Group Insurance Agency, LLC | 11.512 | 220 | ||||||
| 2025-08-08 | 13F | Tortoise Investment Management, LLC | 4.000 | 60,00 | 76 | 123,53 | ||||
| 2025-08-11 | 13F | Mill Creek Capital Advisors, LLC | 0 | -100,00 | 0 | |||||
| 2025-07-30 | 13F | FNY Investment Advisers, LLC | 12.303 | 1.130,30 | 0 | |||||
| 2025-08-11 | 13F | Cornerstone Planning Group LLC | 4.726 | 6,78 | 128 | 115,25 | ||||
| 2025-08-14 | 13F | Engineers Gate Manager LP | 218.221 | -14,29 | 4.161 | 18,28 | ||||
| 2025-08-14 | 13F | Quantitative Investment Management, LLC | 34.784 | 1 | ||||||
| 2025-08-13 | 13F | Maplelane Capital, Llc | Call | 300.000 | 5.721 | |||||
| 2025-08-13 | 13F | Maplelane Capital, Llc | 325.000 | 6.198 | ||||||
| 2025-08-06 | 13F | Titan Global Capital Management Usa Llc | 1.317.322 | -4,25 | 25.121 | 32,12 | ||||
| 2025-08-14 | 13F | Toroso Investments, LLC | Call | 219 | 0 | |||||
| 2025-08-05 | 13F | Yong Rong (HK) Asset Management Ltd | 796.000 | 15 | ||||||
| 2025-07-18 | 13F | Requisite Capital Management, LLC | 74.463 | -2,33 | 1.420 | 34,85 | ||||
| 2025-08-14 | 13F | UBS Group AG | 312.498 | 620,91 | 5.959 | 894,82 | ||||
| 2025-07-24 | 13F | Us Bancorp \de\ | 21.750 | 6,15 | 415 | 46,29 | ||||
| 2025-08-14 | 13F | Toroso Investments, LLC | 21.999 | 420 | ||||||
| 2025-07-31 | 13F | AlTi Global, Inc. | 0 | -100,00 | 0 | |||||
| 2025-08-14 | 13F | Jane Street Group, Llc | Call | 717.000 | 13.673 | |||||
| 2025-07-15 | 13F | Cordant, Inc. | 0 | -100,00 | 0 | |||||
| 2025-08-05 | 13F | Freestone Capital Holdings, LLC | 36.787 | 46,52 | 702 | 102,60 | ||||
| 2025-08-14 | 13F | Jane Street Group, Llc | 6.837.299 | 124,02 | 130.387 | 209,13 | ||||
| 2025-05-02 | 13F | Legacy Capital Wealth Partners, LLC | 0 | -100,00 | 0 | |||||
| 2025-08-14 | 13F | Beck Capital Management, Llc | 10.914 | 208 | ||||||
| 2025-08-14 | 13F | Marathon Asset Management Lp | 160.000 | 3.051 | ||||||
| 2025-07-25 | 13F | Almanack Investment Partners, LLC. | 18.001 | 343 | ||||||
| 2025-08-01 | 13F | Envestnet Asset Management Inc | 412.241 | -80,59 | 7.861 | -73,22 | ||||
| 2025-08-07 | 13F | Winthrop Capital Management, LLC | 0 | -100,00 | 0 | |||||
| 2025-07-23 | 13F | Lansing Street Advisors | 25.966 | 0,00 | 495 | 38,27 | ||||
| 2025-07-17 | 13F | Oakworth Capital, Inc. | 12.220 | 0,00 | 233 | 38,69 | ||||
| 2025-08-13 | 13F | Cresset Asset Management, LLC | 210.542 | 174,75 | 4.015 | 279,13 | ||||
| 2025-08-14 | 13F | Jane Street Group, Llc | Put | 1.540.900 | 29.385 | |||||
| 2025-07-22 | 13F | FFG Partners, LLC | 70.600 | 1.346 | ||||||
| 2025-07-08 | 13F | Nbc Securities, Inc. | 370 | 0,00 | 0 | |||||
| 2025-07-28 | 13F | Kiker Wealth Management, LLC | 1.982 | 0,00 | 38 | 37,04 | ||||
| 2025-08-11 | 13F | Tamar Securities, LLC | 34.021 | 25,91 | 649 | 73,73 | ||||
| 2025-05-15 | 13F | Sepio Capital, LP | 0 | -100,00 | 0 | |||||
| 2025-08-14 | 13F | Prelude Capital Management, Llc | 30.887 | 589 | ||||||
| 2025-08-14 | 13F | L2 Asset Management, LLC | 22.883 | 436 | ||||||
| 2025-08-07 | 13F | Hughes Financial Services, LLC | 52 | 0,00 | 1 | |||||
| 2025-07-16 | 13F | Maridea Wealth Management LLC | 22.188 | 423 | ||||||
| 2025-08-08 | 13F | Central Asset Investments & Management Holdings (HK) Ltd | 59.580 | 96,12 | 1.136 | 171,12 | ||||
| 2025-08-14 | 13F | Federation des caisses Desjardins du Quebec | 3.251 | 391,09 | 62 | 577,78 | ||||
| 2025-07-30 | 13F | Brookstone Capital Management | 18.297 | 7,59 | 349 | 48,09 | ||||
| 2025-08-07 | 13F | Parkside Financial Bank & Trust | 700 | 0,00 | 13 | 44,44 | ||||
| 2025-07-28 | 13F | Mutual Advisors, LLC | 39.963 | 1.102 | ||||||
| 2025-04-11 | 13F | Lake Hills Wealth Management, LLC | 0 | -100,00 | 0 | -100,00 | ||||
| 2025-04-24 | 13F | Transcend Wealth Collective, Llc | 0 | -100,00 | 0 | |||||
| 2025-08-13 | 13F | Mount Yale Investment Advisors, LLC | 45.632 | 7,99 | 870 | 49,23 | ||||
| 2025-07-23 | 13F | Vontobel Holding Ltd. | 25.333 | 483 | ||||||
| 2025-08-14 | 13F | Graham Capital Management, L.P. | 525.000 | 26,51 | 10.012 | 74,56 | ||||
| 2025-07-14 | 13F | Park Avenue Securities Llc | 13.673 | -9,27 | 0 | |||||
| 2025-08-14 | 13F | Qube Research & Technologies Ltd | 0 | -100,00 | 0 | |||||
| 2025-08-12 | 13F | BlackRock, Inc. | 51.124 | 975 | ||||||
| 2025-07-28 | 13F | Harbour Investments, Inc. | 4.313 | 16,82 | 82 | 60,78 | ||||
| 2025-08-12 | 13F | Manchester Capital Management LLC | 10.345 | 55,92 | 197 | 116,48 | ||||
| 2025-07-25 | 13F | We Are One Seven, LLC | 24.726 | 16,27 | 472 | 60,75 | ||||
| 2025-05-15 | 13F | Mercer Global Advisors Inc /adv | 0 | -100,00 | 0 | |||||
| 2025-08-11 | 13F | Hexagon Capital Partners LLC | 0 | -100,00 | 0 | |||||
| 2025-08-14 | 13F | Headlands Technologies LLC | 3.077 | -38,81 | 59 | -15,94 | ||||
| 2025-08-11 | 13F | Private Advisor Group, LLC | 22.735 | -89,88 | 434 | -86,05 | ||||
| 2025-07-16 | 13F | Formidable Asset Management, LLC | 20.620 | 0,00 | 285 | 0,00 | ||||
| 2025-08-11 | 13F | Compass Capital Corp /ma/ /adv | 59.894 | 28,37 | 1.955 | 250,18 | ||||
| 2025-07-24 | 13F | Stonebridge Financial Group, LLC | 0 | -100,00 | 0 | |||||
| 2025-08-14 | 13F | Millennium Management Llc | 5.809.663 | 110.790 | ||||||
| 2025-04-30 | 13F | Alpine Woods Capital Investors, Llc | 0 | -100,00 | 0 | |||||
| 2025-05-19 | 13F | Game Plan Financial Advisors, LLC | 0 | -100,00 | 0 | |||||
| 2025-05-14 | 13F | Oarsman Capital, Inc. | 0 | -100,00 | 0 | |||||
| 2025-08-14 | 13F | Almitas Capital LLC | 219.405 | 4.184 | ||||||
| 2025-07-10 | 13F | Peoples Bank/KS | 0 | -100,00 | 0 | |||||
| 2025-07-09 | 13F | Krilogy Financial LLC | 222.165 | 4.237 | ||||||
| 2025-08-14 | 13F | Mml Investors Services, Llc | 60.738 | 19,83 | 1 | |||||
| 2025-07-29 | 13F | Private Trust Co Na | 86 | -16,50 | 2 | 0,00 | ||||
| 2025-08-06 | 13F | Commonwealth Equity Services, Llc | 36.897 | -2,02 | 1 | |||||
| 2025-08-08 | 13F | Pnc Financial Services Group, Inc. | 1.220 | -71,53 | 23 | -61,02 | ||||
| 2025-08-15 | 13F | Morgan Stanley | 23.377 | -11,78 | 446 | 21,58 | ||||
| 2025-08-12 | 13F | Proequities, Inc. | 0 | 0 | ||||||
| 2025-05-07 | 13F | Texas Yale Capital Corp. | 0 | -100,00 | 0 | -100,00 | ||||
| 2025-08-11 | 13F | CBIZ Investment Advisory Services, LLC | 0 | -100,00 | 0 | |||||
| 2025-07-14 | 13F | Ridgewood Investments LLC | 10.976 | 308,79 | 209 | 464,86 | ||||
| 2025-08-14 | 13F | Benjamin Edwards Inc | 118.157 | -3,57 | 2.253 | 33,08 | ||||
| 2025-08-19 | 13F | Marex Group plc | 887.275 | 16.920 | ||||||
| 2025-07-25 | 13F | LRI Investments, LLC | 10.000 | 0,00 | 191 | 37,68 | ||||
| 2025-07-14 | 13F | UMA Financial Services, Inc. | 90 | 0,00 | 2 | 0,00 | ||||
| 2025-07-28 | 13F | Copia Wealth Management | 5.432 | 48,62 | 104 | 106,00 | ||||
| 2025-08-04 | 13F | Impact Partnership Wealth, LLC | 49.316 | 6,59 | 940 | 47,10 | ||||
| 2025-08-14 | 13F | LM Advisors LLC | 14.320 | 0 | ||||||
| 2025-08-13 | 13F | Kaleidoscope Capital Lp | 1.359.589 | 122,68 | 25.927 | 207,30 | ||||
| 2025-08-14 | 13F | Weiss Asset Management LP | 635.354 | 92,54 | 12.116 | 165,70 | ||||
| 2025-07-24 | 13F | IFP Advisors, Inc | 5.721 | 17,79 | 109 | 62,69 | ||||
| 2025-08-14 | 13F | Logan Stone Capital, LLC | 1.379.690 | 26.311 | ||||||
| 2025-08-14 | 13F | Old Mission Capital Llc | 43.317 | -9,58 | 826 | 24,77 | ||||
| 2025-05-14 | 13F | Monolith Management Ltd | 0 | -100,00 | 0 | -100,00 | ||||
| 2025-08-29 | 13F | Total Investment Management Inc | 55.554 | 317,26 | 1.059 | 478,69 | ||||
| 2025-08-13 | 13F | Texas Capital Bank Wealth Management Services Inc | 18.745 | -5,55 | 357 | 30,29 | ||||
| 2025-08-14 | 13F | J. Goldman & Co LP | 82.502 | 1.573 | ||||||
| 2025-08-15 | 13F | Tower Research Capital LLC (TRC) | 747 | 14 | ||||||
| 2025-07-30 | 13F | LGT Financial Advisors LLC | 14 | 0,00 | 0 | |||||
| 2025-07-30 | 13F | Atlantic Edge Private Wealth Management, LLC | 9.500 | 181 | ||||||
| 2025-08-13 | 13F | Capula Management Ltd | 5.354.800 | 195,47 | 102.116 | 307,73 | ||||
| 2025-04-15 | 13F | SG Americas Securities, LLC | 0 | -100,00 | 0 | |||||
| 2025-07-22 | 13F | Capital Advisors Inc/ok | 17.500 | 20 | ||||||
| 2025-07-15 | 13F | Compagnie Lombard Odier SCmA | 2.500 | 0,00 | 48 | 38,24 | ||||
| 2025-08-19 | 13F | Newbridge Financial Services Group, Inc. | 170 | 0,00 | 3 | 50,00 | ||||
| 2025-08-13 | 13F | Clear Street Llc | 1.028.792 | 19.619 | ||||||
| 2025-08-14 | 13F | Farringdon Capital, Ltd. | 105.291 | 46,20 | 2.008 | 101,71 | ||||
| 2025-08-12 | 13F | Virtu Financial LLC | 0 | -100,00 | 0 | |||||
| 2025-08-12 | 13F | SRS Capital Advisors, Inc. | 238 | 0,00 | 5 | 33,33 | ||||
| 2025-08-01 | 13F | Ashton Thomas Private Wealth, LLC | 26.228 | 0,30 | 500 | 38,50 | ||||
| 2025-08-14 | 13F | Wells Fargo & Company/mn | 64 | -68,00 | 1 | -50,00 | ||||
| 2025-07-31 | 13F | DDD Partners, LLC | 26.303 | 117,09 | 502 | 200,00 | ||||
| 2025-08-11 | 13F | Brown Brothers Harriman & Co | 22.565 | 0,00 | 430 | 38,26 | ||||
| 2025-07-10 | 13F | Wealth Enhancement Advisory Services, Llc | 34.910 | 680 | ||||||
| 2025-08-06 | 13F | SOUTH STATE Corp | 0 | -100,00 | 0 | |||||
| 2025-08-06 | 13F | First Horizon Advisors, Inc. | 3.918 | -26,15 | 75 | 1,37 | ||||
| 2025-08-14 | 13F | DRW Securities, LLC | 0 | -100,00 | 0 | |||||
| 2025-07-30 | 13F | Whittier Trust Co | 1.950 | 0,00 | 37 | 42,31 | ||||
| 2025-08-14 | 13F | Integrated Wealth Concepts LLC | 11.629 | 222 | ||||||
| 2025-07-22 | 13F | IMC-Chicago, LLC | 52.685 | -68,17 | 1.005 | -56,10 | ||||
| 2025-08-14 | 13F | Harvey Capital Management Inc | 10.000 | 0,00 | 182 | 31,16 | ||||
| 2025-05-14 | 13F | Napa Wealth Management | 0 | -100,00 | 0 | |||||
| 2025-07-21 | 13F | J. Safra Sarasin Holding AG | 19.050 | 14,33 | 363 | 57,83 | ||||
| 2025-08-05 | 13F | Bank Of Montreal /can/ | 44.074 | -44,15 | 840 | -22,94 | ||||
| 2025-08-13 | 13F | Hbk Investments L P | 199.020 | 3.795 | ||||||
| 2025-07-24 | 13F | VanderPol Investments L.L.C. | 16.554 | 1,88 | 316 | 40,63 | ||||
| 2025-08-04 | 13F | Spire Wealth Management | 1.591 | 6,85 | 30 | 50,00 | ||||
| 2025-08-14 | 13F | GWM Advisors LLC | 16.456 | 30,52 | 314 | 79,89 | ||||
| 2025-08-07 | 13F | Bearing Point Capital, Llc | 0 | -100,00 | 0 | |||||
| 2025-07-09 | 13F | Sapient Capital Llc | 24.688 | -0,13 | 471 | 37,83 | ||||
| 2025-07-14 | 13F | Proathlete Wealth Management Llc | 1.668 | 10,10 | 32 | 55,00 | ||||
| 2025-08-11 | 13F | NewEdge Wealth, LLC | 7.855 | 230 | ||||||
| 2025-07-16 | 13F | Howard Capital Management Group, LLC | 17.350 | 0,00 | 331 | 38,08 | ||||
| 2025-07-31 | 13F | Curio Wealth, Llc | 168 | 16.700,00 | 3 | -25,00 | ||||
| 2025-08-14 | 13F | Hurley Capital, LLC | 285 | 0,00 | 5 | 66,67 | ||||
| 2025-07-14 | 13F | U.S. Capital Wealth Advisors, LLC | 19.331 | 0,56 | 369 | 38,87 | ||||
| 2025-07-16 | 13F | Signaturefd, Llc | 0 | -100,00 | 0 | |||||
| 2025-07-10 | 13F | Clare Market Investments LLC | 15.905 | -42,54 | 303 | -20,68 | ||||
| 2025-08-19 | 13F | Cape Investment Advisory, Inc. | 4.115 | 0,00 | 78 | 39,29 | ||||
| 2025-08-14 | 13F | Goldman Sachs Group Inc | Call | 750.000 | 14.302 | |||||
| 2025-07-08 | 13F | Parallel Advisors, LLC | 14.372 | 58,51 | 274 | 119,20 | ||||
| 2025-08-14 | 13F | Goldman Sachs Group Inc | 24.902.219 | 282,72 | 474.885 | 428,12 | ||||
| 2025-07-14 | 13F | LCM Capital Management Inc | 117.430 | 4,35 | 2.239 | 43,99 | ||||
| 2025-08-07 | 13F | Allworth Financial LP | 2.655 | -11,06 | 51 | 28,21 | ||||
| 2025-07-29 | 13F | Activest Wealth Management | 245 | 0,00 | 5 | 33,33 |
Other Listings
| PE:ETHA |