Grundlæggende statistik
| Institutionelle ejere | 360 total, 360 long only, 0 short only, 0 long/short - change of 3,14% MRQ |
| Gennemsnitlig porteføljeallokering | 0.2827 % - change of -6,23% MRQ |
| Institutionelle aktier (lange) | 39.571.386 (ex 13D/G) - change of -1,34MM shares -3,28% MRQ |
| Institutionel værdi (lang) | $ 2.273.526 USD ($1000) |
Institutionelt ejerskab og aktionærer
iShares, Inc. - iShares MSCI Emerging Markets Min Vol Factor ETF (US:EEMV) har 360 institutionelle ejere og aktionærer, der har indsendt 13D/G- eller 13F-formularer til Securities Exchange Commission (SEC). Disse institutioner har i alt 39,571,386 aktier. Største aktionærer omfatter Bank Of America Corp /de/, BlackRock, Inc., Morgan Stanley, Wharton Business Group, LLC, Fmr Llc, Ameriprise Financial Inc, UBS Group AG, Northwestern Mutual Wealth Management Co, Envestnet Asset Management Inc, and LPL Financial LLC .
iShares, Inc. - iShares MSCI Emerging Markets Min Vol Factor ETF (BATS:EEMV) institutionel ejerskabsstruktur viser aktuelle positioner i virksomheden efter institutioner og fonde, samt seneste ændringer i positionsstørrelse. Større aktionærer kan omfatte individuelle investorer, investeringsforeninger, hedgefonde eller institutioner. Skema 13D angiver, at investoren besidder (eller besidder) mere end 5 % af virksomheden og har til hensigt (eller har til hensigt at) aktivt at forfølge en ændring i forretningsstrategi. Skema 13G indikerer en passiv investering på over 5%.
The share price as of September 15, 2025 is 64,20 / share. Previously, on September 16, 2024, the share price was 60,20 / share. This represents an increase of 6,65% over that period.

Fondens stemningsscore
Fund Sentiment Score (fka Ownership Accumulation Score) finder de aktier, der bliver mest købt af fonde. Det er resultatet af en sofistikeret, multi-faktor kvantitativ model, der identificerer virksomheder med de højeste niveauer af institutionel akkumulering. Scoringsmodellen bruger en kombination af den samlede stigning i oplyste ejere, ændringerne i porteføljeallokeringer i disse ejere og andre målinger. Tallet går fra 0 til 100, hvor højere tal indikerer et højere niveau af akkumulering for sine jævnaldrende, og 50 er gennemsnittet.
Opdateringsfrekvens: Dagligt
Se Ownership Explorer, som giver en liste over højest rangerende virksomheder.
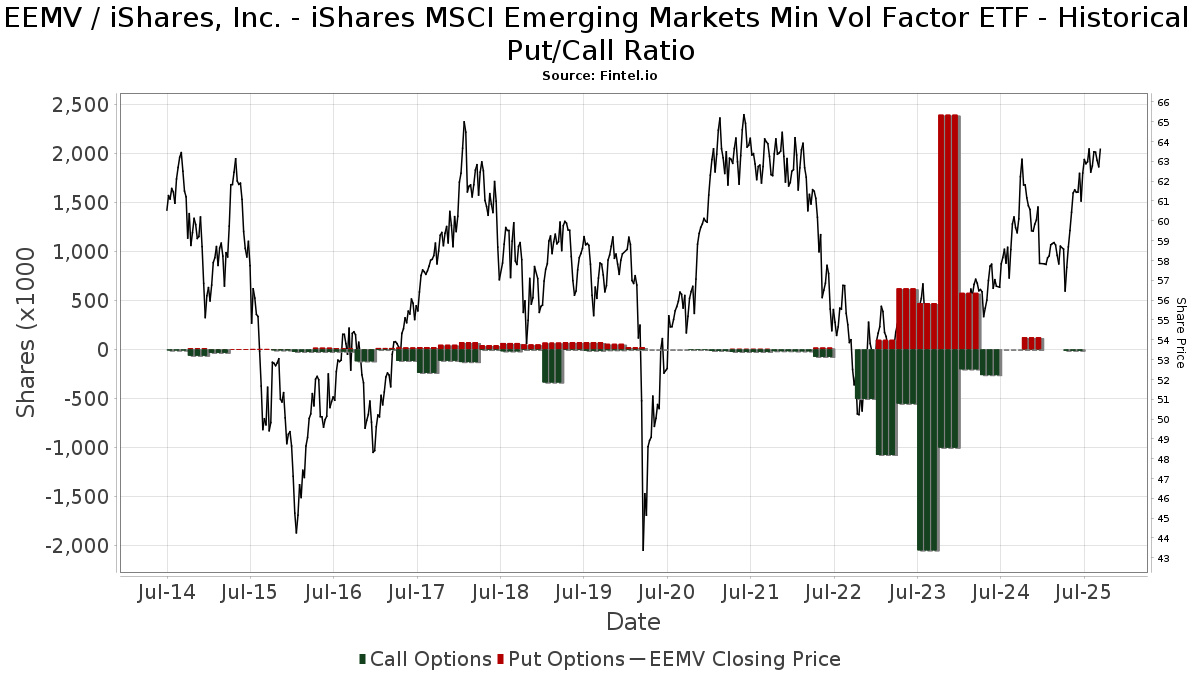
Institutionel Put/Call-forhold
Ud over at indberette standardaktie- og gældsudstedelser skal institutter med mere end 100 mill. aktiver under forvaltning også oplyse deres put- og call-optionsbeholdninger. Da salgsoptioner generelt indikerer negativ stemning, og købsoptioner indikerer positiv stemning, kan vi få en fornemmelse af den overordnede institutionelle stemning ved at plotte forholdet mellem put og kald. Diagrammet til højre viser det historiske put/call-forhold for dette instrument.
Brug af Put/Call Ratio som en indikator for investorernes stemning overvinder en af de vigtigste mangler ved at bruge totalt institutionelt ejerskab, som er, at en betydelig mængde af aktiver under forvaltning investeres passivt for at spore indekser. Passivt forvaltede fonde køber typisk ikke optioner, så indikatoren for put/call-forholdet følger mere nøje følelsen af aktivt forvaltede fonde.
13F og NPORT arkivering
Detaljer om 13F-arkivering er gratis. Detaljer om NP-ansøgninger kræver et premium-medlemskab. Grønne rækker angiver nye positioner. Røde rækker angiver lukkede positioner. Klik på linket ikon for at se den fulde transaktionshistorik.
Opgrader
for at låse premium-data op og eksportere til Excel ![]() .
.
| Fil dato | Kilde | Investor | Type | Gennemsnitlig pris (Øst) |
Aktier | Δ Aktier (%) |
Rapporteret Værdi ($1000) |
Δ Værdi (%) |
Port Alloc (%) |
|
|---|---|---|---|---|---|---|---|---|---|---|
| 2025-07-09 | 13F | Shore Point Advisors, LLC | 14.972 | 1,40 | 940 | 9,18 | ||||
| 2025-07-10 | 13F | Wealth Enhancement Advisory Services, Llc | 106.099 | -16,27 | 6.719 | -9,10 | ||||
| 2025-08-11 | 13F | Summit Wealth Partners, LLC | 3.608 | 0,64 | 227 | 8,13 | ||||
| 2025-08-13 | 13F | Capital Analysts, Inc. | 18.271 | 5,13 | 1 | 0,00 | ||||
| 2025-08-14 | 13F | Valley Financial Group, Inc. | 3.985 | -9,88 | 250 | -2,72 | ||||
| 2025-08-08 | 13F | Emerald Investment Partners, Llc | 53 | -11,67 | 3 | 0,00 | ||||
| 2025-08-19 | 13F | Anchor Investment Management, LLC | 3.975 | -16,75 | 250 | -10,43 | ||||
| 2025-08-14 | 13F | Betterment LLC | 4.569 | 0 | ||||||
| 2025-07-14 | 13F | U.S. Capital Wealth Advisors, LLC | 27.813 | 22,89 | 1.747 | 32,27 | ||||
| 2025-08-05 | 13F | GPS Wealth Strategies Group, LLC | 84 | 23,53 | 5 | 66,67 | ||||
| 2025-08-14 | 13F | Ancora Advisors, LLC | 2.363 | 0,00 | 148 | 8,03 | ||||
| 2025-07-22 | 13F | Beacon Financial Advisory LLC | 4.434 | 4,33 | 278 | 12,55 | ||||
| 2025-05-14 | 13F | CIBC World Markets Inc. | 0 | -100,00 | 0 | |||||
| 2025-08-04 | 13F | Creative Financial Designs Inc /adv | 0 | -100,00 | 0 | |||||
| 2025-08-13 | 13F | Northwestern Mutual Wealth Management Co | 815.673 | -7,67 | 51.224 | -0,62 | ||||
| 2025-05-14 | 13F | CIBC World Markets Inc. | Put | 0 | -100,00 | 0 | ||||
| 2025-08-18 | 13F | Front Row Advisors LLC | 212 | 13 | ||||||
| 2025-08-14 | 13F | Wharton Business Group, LLC | 2.292.021 | 0,17 | 144 | 7,52 | ||||
| 2025-04-15 | 13F | Atwood & Palmer Inc | 0 | -100,00 | 0 | |||||
| 2025-07-29 | 13F | Roof Eidam & Maycock/adv | 4.805 | 0,00 | 302 | 7,50 | ||||
| 2025-08-14 | 13F | Fmr Llc | 2.122.726 | 8,64 | 133.307 | 16,94 | ||||
| 2025-04-09 | 13F | American National Bank | 0 | -100,00 | 0 | -100,00 | ||||
| 2025-07-23 | 13F | True Vision MN LLC | 4.386 | -1,73 | 275 | 5,77 | ||||
| 2025-07-17 | 13F | Janney Montgomery Scott LLC | 50.690 | 24,74 | 3 | 50,00 | ||||
| 2025-08-04 | 13F | Atria Investments Llc | 35.623 | 13,72 | 2.237 | 22,44 | ||||
| 2025-07-15 | 13F | Avaii Wealth Management, Llc | 4.744 | 0,00 | 298 | 7,61 | ||||
| 2025-08-14 | 13F | Quantinno Capital Management LP | 3.921 | 246 | ||||||
| 2025-08-08 | 13F | Larson Financial Group LLC | 207 | 0,00 | 13 | 8,33 | ||||
| 2025-05-07 | 13F | Alteri Wealth LLC | 0 | -100,00 | 0 | |||||
| 2025-08-13 | 13F | VestGen Advisors, LLC | 4.974 | -7,13 | 312 | 0,00 | ||||
| 2025-08-06 | 13F | Garrison Point Advisors, Llc | 7.275 | 0,00 | 457 | 7,55 | ||||
| 2025-08-13 | 13F/A | StoneX Group Inc. | 3.609 | -16,13 | 226 | -8,13 | ||||
| 2025-07-08 | 13F | Parallel Advisors, LLC | 33.353 | 11,81 | 2.095 | 20,34 | ||||
| 2025-07-31 | 13F | Buckingham Strategic Partners | 22.271 | 19,12 | 1.399 | 28,26 | ||||
| 2025-07-30 | 13F | Financial Perspectives, Inc | 96 | 1,05 | 6 | 20,00 | ||||
| 2025-05-06 | 13F | One Wealth Advisors, LLC | 0 | -100,00 | 0 | |||||
| 2025-07-17 | 13F | Archford Capital Strategies, LLC | 12.852 | -55,99 | 807 | -52,61 | ||||
| 2025-08-05 | 13F | Tme Financial, Inc. | 7.948 | -1,99 | 499 | 5,50 | ||||
| 2025-08-07 | 13F | Runnymede Capital Advisors, Inc. | 0 | -100,00 | 0 | |||||
| 2025-08-13 | 13F | Providence Capital Advisors, LLC | 193 | 12 | ||||||
| 2025-07-31 | 13F | Wealthfront Advisers Llc | 3.440 | 216 | ||||||
| 2025-08-13 | 13F | Beacon Pointe Advisors, LLC | 6.203 | -3,09 | 390 | 4,29 | ||||
| 2025-08-11 | 13F | HighTower Advisors, LLC | 66.924 | 2,68 | 4.203 | 10,52 | ||||
| 2025-06-24 | NP | TNWIX - 1290 Retirement 2050 Fund Class I | 805 | 0,00 | 48 | 2,17 | ||||
| 2025-07-08 | 13F | Zrc Wealth Management, Llc | 544 | 1,12 | 34 | 9,68 | ||||
| 2025-07-29 | 13F | Aspiriant, Llc | 21.584 | -10,37 | 1.355 | -3,49 | ||||
| 2025-08-12 | 13F | LPL Financial LLC | 655.367 | 8,60 | 41.157 | 16,90 | ||||
| 2025-07-30 | 13F | Strategic Blueprint, LLC | 24.652 | -16,85 | 1.548 | -10,47 | ||||
| 2025-08-19 | NP | Securian Funds Trust - SFT Managed Volatility Equity Fund | 242.456 | 0,00 | 15.226 | 7,65 | ||||
| 2025-07-17 | 13F | Symmetry Partners, LLC | 108.046 | 10,76 | 6.785 | 19,22 | ||||
| 2025-08-08 | 13F | Hibernia Wealth Partners, LLC | 10.620 | 100,64 | 667 | 116,56 | ||||
| 2025-07-21 | 13F | Stock Yards Bank & Trust Co | 14.700 | 0,00 | 923 | 7,70 | ||||
| 2025-07-17 | 13F | Beacon Capital Management, LLC | 18 | 5,88 | 1 | 0,00 | ||||
| 2025-07-18 | 13F | Ewa, Llc | 5.757 | 1,16 | 362 | 8,73 | ||||
| 2025-07-22 | 13F | Merit Financial Group, LLC | 4.879 | 26,63 | 306 | 36,61 | ||||
| 2025-07-09 | 13F | Market Street Wealth Management Advisors Llc | 10.263 | -10,97 | 645 | -4,17 | ||||
| 2025-08-05 | 13F | Westside Investment Management, Inc. | 44 | -6,38 | 3 | 0,00 | ||||
| 2025-07-14 | 13F | Park Avenue Securities Llc | 8.131 | 0,10 | 1 | |||||
| 2025-05-15 | 13F | Citadel Advisors Llc | Put | 0 | -100,00 | 0 | -100,00 | |||
| 2025-07-28 | 13F | Rosenberg Matthew Hamilton | 219 | 0,00 | 14 | 8,33 | ||||
| 2025-07-24 | 13F | Blair William & Co/il | 1.532 | -2,11 | 96 | 5,49 | ||||
| 2025-08-14 | 13F | Raymond James Financial Inc | 279.696 | -10,11 | 17.565 | -3,24 | ||||
| 2025-08-27 | NP | TRANSAMERICA SERIES TRUST - Transamerica BlackRock Smart Beta 40 VP Initial | 74.824 | -3,21 | 4.699 | 4,19 | ||||
| 2025-08-12 | 13F | Insigneo Advisory Services, Llc | 4.550 | 0,00 | 286 | 7,55 | ||||
| 2025-04-09 | 13F | Roxbury Financial LLC | 0 | -100,00 | 0 | |||||
| 2025-08-14 | 13F | Horizon Investments, LLC | 56.219 | -1,49 | 3.531 | 6,04 | ||||
| 2025-07-21 | 13F | Credential Qtrade Securities Inc. | 0 | -100,00 | 0 | -100,00 | ||||
| 2025-08-06 | 13F | Adviser Investments LLC | 73.329 | -5,80 | 4.605 | 1,41 | ||||
| 2025-08-14 | 13F | Sunbelt Securities, Inc. | 117 | 0,00 | 7 | 0,00 | ||||
| 2025-07-28 | 13F | BRYN MAWR TRUST Co | 394 | -6,19 | 25 | 0,00 | ||||
| 2025-05-02 | 13F | Kingsview Wealth Management, LLC | 0 | -100,00 | 0 | |||||
| 2025-07-29 | 13F | Harbor Asset Planning, Inc. | 625 | 39 | ||||||
| 2025-08-14 | 13F | Susquehanna International Group, Llp | 11.284 | -65,32 | 709 | -62,70 | ||||
| 2025-05-15 | 13F | Millennium Management Llc | 0 | -100,00 | 0 | -100,00 | ||||
| 2025-07-29 | 13F | Ifrah Financial Services, Inc. | 57.208 | 1,11 | 3.593 | 8,85 | ||||
| 2025-07-10 | 13F | Sovran Advisors, LLC | 3.820 | 241 | ||||||
| 2025-08-12 | 13F | Rhumbline Advisers | 392.270 | 24,03 | 24.635 | 33,52 | ||||
| 2025-05-14 | 13F | Islay Capital Management, Llc | 0 | -100,00 | 0 | |||||
| 2025-08-14 | 13F | Bnp Paribas Arbitrage, Sa | 277 | -99,13 | 17 | -99,08 | ||||
| 2025-04-28 | 13F | Fedenia Advisers LLC | 0 | -100,00 | 0 | |||||
| 2025-07-18 | 13F | Trust Co Of Vermont | 359 | 0,00 | 23 | 10,00 | ||||
| 2025-08-27 | NP | TRANSAMERICA SERIES TRUST - Transamerica BlackRock Equity Smart Beta 100 VP Service | 67.199 | -0,19 | 4.220 | 7,46 | ||||
| 2025-08-08 | 13F | Gts Securities Llc | 11.190 | 703 | ||||||
| 2025-08-11 | 13F | TD Waterhouse Canada Inc. | 373 | 143,79 | 23 | 187,50 | ||||
| 2025-08-08 | 13F | Tortoise Investment Management, LLC | 16.115 | 0,00 | 1.012 | 7,66 | ||||
| 2025-08-14 | 13F | Smartleaf Asset Management LLC | 187 | -60,96 | 12 | -59,26 | ||||
| 2025-07-24 | 13F | Ronald Blue Trust, Inc. | 1.110 | 0,00 | 70 | 7,81 | ||||
| 2025-07-23 | 13F | Prime Capital Investment Advisors, LLC | 0 | -100,00 | 0 | |||||
| 2025-08-08 | 13F | Hartland & Co., LLC | 22.693 | 4.393,66 | 1.425 | 4.813,79 | ||||
| 2025-05-12 | 13F | Independent Advisor Alliance | 0 | -100,00 | 0 | |||||
| 2025-08-12 | 13F | JMG Financial Group, Ltd. | 11.234 | 13,69 | 705 | 22,40 | ||||
| 2025-08-08 | 13F | Cetera Investment Advisers | 159.643 | 2,07 | 10.026 | 9,86 | ||||
| 2025-05-15 | 13F | Old Mission Capital Llc | 0 | -100,00 | 0 | |||||
| 2025-08-14 | 13F | Comerica Bank | 53.991 | -2,44 | 3.391 | 5,02 | ||||
| 2025-08-15 | 13F | CI Private Wealth, LLC | 10.413 | 26,11 | 654 | 35,76 | ||||
| 2025-08-06 | 13F | Modera Wealth Management, LLC | 152.976 | -4,37 | 9.607 | 2,94 | ||||
| 2025-04-22 | 13F | Synergy Financial Management, LLC | 0 | -100,00 | 0 | |||||
| 2025-08-14 | 13F | Bank Of America Corp /de/ | 12.937.677 | -2,61 | 812.486 | 4,84 | ||||
| 2025-07-31 | 13F | Conservest Capital Advisors, Inc. | 31.617 | -1,39 | 1.986 | 6,15 | ||||
| 2025-08-13 | 13F | Colonial Trust Co / SC | 230 | 0,00 | 14 | 7,69 | ||||
| 2025-07-15 | 13F | Mather Group, Llc. | 66.895 | 0,00 | 4.201 | 7,66 | ||||
| 2025-08-12 | 13F | Virtu Financial LLC | 0 | -100,00 | 0 | |||||
| 2025-07-22 | 13F | Simplicity Wealth,LLC | 0 | -100,00 | 0 | |||||
| 2025-08-19 | 13F | Asset Dedication, LLC | 17.141 | -1,19 | 1.076 | 6,32 | ||||
| 2025-08-05 | 13F | Snider Financial Group | 7.123 | 0,52 | 447 | 8,23 | ||||
| 2025-08-08 | 13F | Pnc Financial Services Group, Inc. | 214.140 | -3,11 | 13.448 | 4,30 | ||||
| 2025-07-02 | 13F | Helen Stephens Group, LLC | 4.816 | -0,64 | 302 | 7,09 | ||||
| 2025-08-14 | 13F | C M Bidwell & Associates Ltd | 2.326 | -3,33 | 146 | 4,29 | ||||
| 2025-07-08 | 13F | Arlington Trust Co LLC | 121 | 0,00 | 8 | 0,00 | ||||
| 2025-08-11 | 13F | Citigroup Inc | 18.398 | -63,74 | 1.155 | -60,98 | ||||
| 2025-07-01 | 13F | Harbor Investment Advisory, Llc | 182 | 0,00 | 11 | 10,00 | ||||
| 2025-07-29 | 13F | Signature Estate & Investment Advisors Llc | 30.397 | 2,55 | 1.909 | 10,35 | ||||
| 2025-08-05 | 13F | Carolinas Wealth Consulting Llc | 0 | -100,00 | 0 | -100,00 | ||||
| 2025-08-11 | 13F | Mosaic Family Wealth Partners, Llc | 5.441 | 0,13 | 342 | 7,57 | ||||
| 2025-07-08 | 13F | Apella Capital, LLC | 69.864 | -14,41 | 4.397 | -4,60 | ||||
| 2025-08-13 | 13F | Baird Financial Group, Inc. | 154.439 | -0,50 | 9.699 | 7,10 | ||||
| 2025-05-01 | 13F | Quest 10 Wealth Builders, Inc. | 3 | -75,00 | 0 | |||||
| 2025-07-17 | 13F | Sound Income Strategies, LLC | 228 | 0,00 | 14 | 7,69 | ||||
| 2025-07-25 | 13F | Cwm, Llc | 16.753 | -28,63 | 1 | 0,00 | ||||
| 2025-08-01 | 13F | Envestnet Asset Management Inc | 753.504 | -0,82 | 47.320 | 6,76 | ||||
| 2025-09-09 | 13F | Cambridge Financial Group, LLC | 11.848 | -0,80 | 744 | 6,90 | ||||
| 2025-08-12 | 13F | Hillsdale Investment Management Inc. | 8 | 1 | ||||||
| 2025-08-11 | 13F | Nordwand Advisors, LLC | 23 | 1 | ||||||
| 2025-08-13 | 13F | Rsm Us Wealth Management Llc | 5.144 | -8,39 | 323 | -1,22 | ||||
| 2025-07-17 | 13F | Independence Bank of Kentucky | 590 | 0,00 | 37 | 8,82 | ||||
| 2025-08-04 | 13F | Creekmur Asset Management LLC | 99 | -49,49 | 6 | -45,45 | ||||
| 2025-05-09 | 13F | Wade Financial Advisory, Inc | 119.049 | 1,17 | 6.945 | 1,79 | ||||
| 2025-08-05 | 13F | Cherry Tree Wealth Management, LLC | 7.645 | 0,00 | 480 | 7,62 | ||||
| 2025-08-28 | NP | Northern Lights Fund Trust - Ocean Park International ETF | 2.029 | 127 | ||||||
| 2025-08-12 | 13F | Nemes Rush Group LLC | 244 | 15 | ||||||
| 2025-07-17 | 13F | Neumann Capital Management, LLC | 8.236 | 0,00 | 517 | 7,71 | ||||
| 2025-07-22 | 13F | Appleton Partners Inc/ma | 4.987 | 0 | ||||||
| 2025-08-08 | 13F | Avantax Advisory Services, Inc. | 107.207 | 5,60 | 6.733 | 13,68 | ||||
| 2025-08-14 | 13F | UBS Group AG | 1.103.754 | -43,11 | 69.316 | -38,76 | ||||
| 2025-08-06 | 13F | AE Wealth Management LLC | 1.854 | -2,88 | 116 | 4,50 | ||||
| 2025-07-01 | 13F | Burkett Financial Services, Llc | 275.092 | 0,70 | 17.276 | 8,40 | ||||
| 2025-08-13 | 13F | EverSource Wealth Advisors, LLC | 84 | -1,18 | 5 | 25,00 | ||||
| 2025-07-17 | 13F | Park Place Capital Corp | 380 | -62,93 | 24 | -61,02 | ||||
| 2025-08-07 | 13F | Montag A & Associates Inc | 102 | 6 | ||||||
| 2025-07-25 | 13F | Endowment Wealth Management, Inc. | 24.979 | 25,08 | 1.569 | 34,59 | ||||
| 2025-08-11 | 13F | Sykon Capital Llc | 44.623 | 2.802 | ||||||
| 2025-05-12 | 13F | Sandy Spring Bank | 199 | 12 | ||||||
| 2025-08-08 | 13F | WASHINGTON TRUST Co | 0 | -100,00 | 0 | |||||
| 2025-07-17 | 13F | CogentBlue Wealth Advisors, LLC | 3.607 | -0,06 | 227 | 7,62 | ||||
| 2025-08-04 | 13F | Assetmark, Inc | 13.683 | -0,57 | 859 | 7,11 | ||||
| 2025-07-15 | 13F | Foster Victor Wealth Advisors, LLC | 61.188 | 3.848 | ||||||
| 2025-04-21 | 13F | Kingswood Wealth Advisors, Llc | 0 | -100,00 | 0 | |||||
| 2025-08-11 | 13F | Actinver Wealth Management, Inc. | 5.792 | 5,93 | 364 | 13,79 | ||||
| 2025-07-22 | 13F | Mascoma Wealth Management LLC | 2.399 | 0,00 | 151 | 7,91 | ||||
| 2025-08-13 | 13F | Continuum Advisory, LLC | 0 | -100,00 | 0 | -100,00 | ||||
| 2025-07-18 | 13F | Naples Global Advisors, Llc | 3.540 | -1,12 | 222 | 6,73 | ||||
| 2025-08-28 | 13F/A | Tolleson Wealth Management, Inc. | 0 | -100,00 | 0 | -100,00 | ||||
| 2025-08-11 | 13F | Private Advisor Group, LLC | 20.368 | -10,08 | 1.279 | -3,18 | ||||
| 2025-08-01 | 13F | MorganRosel Wealth Management, LLC | 10.141 | 4,83 | 637 | 12,77 | ||||
| 2025-08-08 | 13F | Capital Investment Advisory Services, LLC | 1.116 | 0,00 | 70 | 7,69 | ||||
| 2025-08-01 | 13F | Cedar Point Capital Partners, LLC | 3.194 | 201 | ||||||
| 2025-07-28 | NP | SPGEX - Symmetry Panoramic Global Equity Fund Class I Shares | 7.500 | 0,00 | 457 | 6,05 | ||||
| 2025-07-21 | 13F | Ameriflex Group, Inc. | 0 | -100,00 | 0 | |||||
| 2025-08-18 | 13F | Old North State Trust, LLC | 6.281 | -36,63 | 0 | |||||
| 2025-04-11 | 13F | Godsey & Gibb Associates | 0 | -100,00 | 0 | |||||
| 2025-07-23 | 13F | Nbt Bank N A /ny | 34.124 | -5,34 | 2.143 | 1,85 | ||||
| 2025-08-11 | 13F | United Capital Financial Advisers, Llc | 21.483 | -23,10 | 1.349 | -17,19 | ||||
| 2025-07-18 | 13F | Bartlett & Co. Wealth Management Llc | 1.640 | -72,39 | 103 | -70,52 | ||||
| 2025-08-18 | 13F | Hollencrest Capital Management | 89 | 1,14 | 6 | 0,00 | ||||
| 2025-04-23 | 13F | Mascagni Wealth Management, Inc. | 0 | -100,00 | 0 | -100,00 | ||||
| 2025-08-14 | 13F | Hrt Financial Lp | 6.183 | 0 | ||||||
| 2025-07-18 | 13F | TPG Advisors LLC | 16.125 | 0,44 | 1.013 | 8,12 | ||||
| 2025-04-21 | 13F | Nelson, Van Denburg & Campbell Wealth Management Group, LLC | 0 | -100,00 | 0 | |||||
| 2025-07-17 | 13F | Global Trust Asset Management, LLC | 3 | 0,00 | 0 | |||||
| 2025-08-13 | 13F | Russell Investments Group, Ltd. | 8 | 0,00 | 1 | |||||
| 2025-07-30 | 13F | Whittier Trust Co Of Nevada Inc | 5.474 | 3,46 | 344 | 11,36 | ||||
| 2025-08-01 | 13F | Banco Santander, S.A. | 264.448 | -0,30 | 16.607 | 7,32 | ||||
| 2025-08-14 | 13F | Evergreen Capital Management Llc | 3.864 | 243 | ||||||
| 2025-07-22 | 13F | Miracle Mile Advisors, LLC | 13.807 | 15,37 | 867 | 24,21 | ||||
| 2025-07-30 | 13F | Brookstone Capital Management | 157.618 | -6,74 | 9.898 | 0,40 | ||||
| 2025-08-14 | 13F | 10Elms LLP | 94 | 0,00 | 6 | 0,00 | ||||
| 2025-07-30 | 13F | Evermay Wealth Management Llc | 406 | 0,74 | 26 | 8,70 | ||||
| 2025-05-14 | 13F | Jane Street Group, Llc | 0 | -100,00 | 0 | |||||
| 2025-09-04 | 13F/A | Advisor Group Holdings, Inc. | 77.932 | -4,95 | 4.895 | 2,32 | ||||
| 2025-07-17 | 13F | Hanson & Doremus Investment Management | 329 | 0,00 | 0 | |||||
| 2025-07-11 | 13F | Lantz Financial LLC | 3.904 | -0,71 | 245 | 6,99 | ||||
| 2025-08-14 | 13F | Modern Wealth Management, LLC | 106.590 | -7,04 | 6.694 | 0,06 | ||||
| 2025-07-25 | 13F | Envestnet Portfolio Solutions, Inc. | 6.659 | -6,25 | 418 | 0,97 | ||||
| 2025-07-14 | 13F | AdvisorNet Financial, Inc | 1.008 | 11,01 | 63 | 21,15 | ||||
| 2025-08-12 | 13F | Deutsche Bank Ag\ | 150 | 0,00 | 9 | 12,50 | ||||
| 2025-08-13 | 13F | Quadrature Capital Ltd | 0 | -100,00 | 0 | |||||
| 2025-07-24 | 13F | Bryant Woods Investment Advisors, LLC | 3.487 | -2,81 | 219 | 4,78 | ||||
| 2025-05-15 | 13F | Glenmede Trust Co Na | 16.015 | -10,41 | 934 | -9,85 | ||||
| 2025-08-05 | 13F | Bank Of Montreal /can/ | 2.450 | 21,35 | 154 | 30,77 | ||||
| 2025-07-30 | 13F | Bleakley Financial Group, LLC | 60.194 | 3.780 | ||||||
| 2025-08-12 | 13F | Clearwater Capital Advisors, LLC | 0 | -100,00 | 0 | |||||
| 2025-08-12 | 13F | SRS Capital Advisors, Inc. | 773 | 1,18 | 49 | 9,09 | ||||
| 2025-08-19 | 13F | National Asset Management, Inc. | 0 | -100,00 | 0 | |||||
| 2025-07-23 | 13F | Armbruster Capital Management, Inc. | 13.181 | 0,24 | 828 | 7,82 | ||||
| 2025-08-05 | 13F | Key FInancial Inc | 100 | 0,00 | 6 | 20,00 | ||||
| 2025-08-14 | 13F | Wells Fargo & Company/mn | 647.695 | 1,22 | 40.675 | 8,95 | ||||
| 2025-08-01 | 13F | Y-Intercept (Hong Kong) Ltd | 4.704 | 295 | ||||||
| 2025-07-25 | 13F | Stephens Consulting, LLC | 244 | 0,00 | 15 | 7,14 | ||||
| 2025-08-08 | 13F | Creative Planning | 159.097 | -6,40 | 9.991 | 0,76 | ||||
| 2025-08-14 | 13F | Godshalk Welsh Capital Management, Inc. | 7.800 | 0,00 | 490 | 7,47 | ||||
| 2025-07-21 | 13F | HighMark Wealth Management LLC | 293 | 0,00 | 18 | 5,88 | ||||
| 2025-07-25 | 13F | Sequoia Financial Advisors, LLC | 39.857 | -38,60 | 2.503 | -33,91 | ||||
| 2025-07-31 | 13F | Cambridge Investment Research Advisors, Inc. | 27.676 | 0,05 | 2 | 0,00 | ||||
| 2025-07-25 | 13F | Northwest Capital Management Inc | 9.865 | -45,08 | 620 | -40,94 | ||||
| 2025-05-09 | 13F | NewEdge Wealth, LLC | 0 | -100,00 | 0 | |||||
| 2025-07-24 | 13F | Stonebridge Financial Group, LLC | 0 | -100,00 | 0 | |||||
| 2025-08-14 | 13F | Goldman Sachs Group Inc | 50.603 | 613,72 | 3.178 | 669,25 | ||||
| 2025-08-15 | 13F | Tower Research Capital LLC (TRC) | 11 | 1 | ||||||
| 2025-07-21 | 13F | Barrett & Company, Inc. | 79 | 0,00 | 5 | 0,00 | ||||
| 2025-08-12 | 13F | Franklin Resources Inc | 1.350 | -58,90 | 85 | -56,02 | ||||
| 2025-07-31 | 13F | Glass Jacobson Investment Advisors llc | 1.778 | -15,93 | 112 | -9,02 | ||||
| 2025-08-14 | 13F | EP Wealth Advisors, Inc. | 8.763 | 3,61 | 550 | 11,56 | ||||
| 2025-05-02 | 13F | Transcendent Capital Group LLC | 0 | -100,00 | 0 | |||||
| 2025-08-14 | 13F | CoreCap Advisors, LLC | 192 | 3,78 | 12 | 20,00 | ||||
| 2025-07-28 | NP | SPGTX - Symmetry Panoramic Tax Managed Global Equity Fund Class I Shares | 1.000 | 0,00 | 61 | 5,26 | ||||
| 2025-07-23 | 13F | Prasad Wealth Partners, LLC | 4.173 | -2,68 | 262 | 4,80 | ||||
| 2025-08-12 | 13F | MAI Capital Management | 24.029 | -1,76 | 1.509 | 5,82 | ||||
| 2025-04-23 | 13F | Pinnacle Bancorp, Inc. | 0 | -100,00 | 0 | |||||
| 2025-07-28 | NP | SPILX - Symmetry Panoramic International Equity Fund Class I Shares | 114.151 | -20,04 | 6.954 | -15,21 | ||||
| 2025-07-14 | 13F | Ridgewood Investments LLC | 2.238 | 0,00 | 141 | 7,69 | ||||
| 2025-07-24 | 13F | Us Bancorp \de\ | 6.894 | -2,30 | 433 | 5,11 | ||||
| 2025-08-12 | 13F | O'shaughnessy Asset Management, Llc | 2.762 | 223,42 | 173 | 253,06 | ||||
| 2025-08-11 | 13F | Brown Brothers Harriman & Co | 366 | -30,29 | 23 | -26,67 | ||||
| 2025-07-24 | 13F | Capital Advisors, Ltd. LLC | 1.394 | 0,00 | 0 | |||||
| 2025-07-23 | 13F | Sachetta, LLC | 11.899 | -0,34 | 747 | 7,33 | ||||
| 2025-07-11 | 13F/A | Umb Bank N A/mo | 26.519 | -0,42 | 1.665 | 7,21 | ||||
| 2025-04-28 | 13F | Mainstream Capital Management LLC | 0 | -100,00 | 0 | |||||
| 2025-07-11 | 13F | Bond & Devick Financial Network, Inc. | 11.867 | 0,00 | 745 | 7,66 | ||||
| 2025-07-08 | 13F/A | Salem Investment Counselors Inc | 286 | 0,00 | 18 | 6,25 | ||||
| 2025-07-09 | 13F | Burt Wealth Advisors | 4.817 | 0,00 | 303 | 7,47 | ||||
| 2025-08-14 | 13F | Wilshire Associates Inc | 0 | -100,00 | 0 | |||||
| 2025-07-28 | 13F | Aries Wealth Management | 7.167 | -39,66 | 450 | -34,97 | ||||
| 2025-08-05 | 13F | Huntington National Bank | 75 | 368,75 | ||||||
| 2025-07-24 | 13F | Morton Brown Family Wealth, LLC | 5.461 | 0,00 | 343 | 7,55 | ||||
| 2025-07-10 | 13F | Exchange Traded Concepts, Llc | 2.029 | 127 | ||||||
| 2025-08-14 | 13F/A | Rockefeller Capital Management L.P. | 36.796 | 9,46 | 2.311 | 17,80 | ||||
| 2025-08-07 | 13F | Brio Consultants, LLC | 196.971 | 1,44 | 12.370 | 9,20 | ||||
| 2025-08-14 | 13F | Federation des caisses Desjardins du Quebec | 2.705 | 37,17 | 170 | 46,96 | ||||
| 2025-07-09 | 13F | Pallas Capital Advisors LLC | 9.915 | -88,50 | 623 | -87,63 | ||||
| 2025-08-08 | 13F | Vestcor Inc | 312.760 | 45,43 | 20 | 58,33 | ||||
| 2025-08-15 | 13F | Morgan Stanley | 2.447.393 | 4,33 | 153.696 | 12,31 | ||||
| 2025-08-14 | 13F | Atomi Financial Group, Inc. | 7.619 | 1,76 | 478 | 9,63 | ||||
| 2025-07-08 | 13F | Webster Bank, N. A. | 5.672 | 0,00 | 356 | 7,88 | ||||
| 2025-08-11 | 13F | Bell Investment Advisors, Inc | 333 | 1,22 | 21 | 5,26 | ||||
| 2025-08-14 | 13F | Mariner, LLC | 187.815 | -9,51 | 11.795 | -2,59 | ||||
| 2025-08-14 | 13F | Stifel Financial Corp | 26.323 | -3,08 | 1.653 | 4,36 | ||||
| 2025-05-12 | 13F | Bristlecone Advisors, LLC | 0 | -100,00 | 0 | |||||
| 2025-08-12 | 13F | Ameritas Investment Partners, Inc. | 9.835 | 0,02 | 618 | 7,68 | ||||
| 2025-07-30 | 13F | Caliber Wealth Management, LLC / KS | 4.673 | -14,71 | 293 | -8,15 | ||||
| 2025-08-06 | NP | LINCOLN VARIABLE INSURANCE PRODUCTS TRUST - LVIP BlackRock Global Growth ETF Allocation Managed Risk Fund Standard Class | 411.268 | -1,00 | 25.828 | 6,57 | ||||
| 2025-08-11 | 13F | Aptus Capital Advisors, LLC | 401 | 1,01 | 25 | 8,70 | ||||
| 2025-08-14 | 13F | Colony Group, LLC | 28.148 | 7,63 | 1.768 | 15,87 | ||||
| 2025-07-15 | 13F | Well Done, LLC | 84.266 | -6,70 | 5.292 | 1,03 | ||||
| 2025-07-21 | 13F | Ameritas Advisory Services, LLC | 1.999 | 126 | ||||||
| 2025-08-13 | 13F | Congress Wealth Management LLC / DE / | 39.119 | -14,55 | 2.457 | -8,01 | ||||
| 2025-08-13 | 13F | Johnson Financial Group, Inc. | 0 | -100,00 | 0 | |||||
| 2025-07-25 | 13F | NorthRock Partners, LLC | 2.831 | -4,49 | 178 | 2,91 | ||||
| 2025-08-04 | 13F | Mayflower Financial Advisors, LLC | 25.493 | -5,03 | 1.601 | 2,24 | ||||
| 2025-08-12 | 13F | Archer Investment Corp | 90 | 0,00 | 6 | 0,00 | ||||
| 2025-06-24 | NP | TNIIX - 1290 Retirement 2020 Fund Class I | 31 | 0,00 | 2 | 0,00 | ||||
| 2025-08-13 | 13F | Financial Freedom, LLC | 130 | 0,00 | 8 | 14,29 | ||||
| 2025-08-12 | 13F | Rock Creek Group, LP | 36.900 | 2.215 | ||||||
| 2025-08-14 | 13F | Ameriprise Financial Inc | 1.697.902 | -1,18 | 106.781 | 6,53 | ||||
| 2025-07-28 | 13F | Harbour Investments, Inc. | 9.006 | 0,75 | 566 | 8,45 | ||||
| 2025-06-24 | NP | TNLIX - 1290 Retirement 2035 Fund Class I | 309 | 0,00 | 18 | 0,00 | ||||
| 2025-07-25 | 13F | Iron Financial, LLC | 8.048 | 0,15 | 505 | 7,91 | ||||
| 2025-08-07 | 13F | Mitsubishi UFJ Kokusai Asset Management Co., Ltd. | 27.251 | 0,00 | 1.711 | 7,68 | ||||
| 2025-08-14 | 13F | Mercer Global Advisors Inc /adv | 225.925 | -2,76 | 14.188 | 4,68 | ||||
| 2025-08-11 | 13F | Synergy Investment Management, LLC | 0 | -100,00 | 0 | |||||
| 2025-08-07 | 13F | New England Private Wealth Advisors LLC | 23.501 | 0,31 | 1.468 | 7,39 | ||||
| 2025-08-15 | 13F | Equitable Holdings, Inc. | 4.643 | -41,41 | 292 | -37,01 | ||||
| 2025-05-15 | 13F | Rise Advisors, LLC | 0 | -100,00 | 0 | |||||
| 2025-07-16 | 13F | Dakota Wealth Management | 23.195 | -11,67 | 1.457 | -4,96 | ||||
| 2025-08-08 | 13F | Atlantic Trust, LLC | 47 | 3 | ||||||
| 2025-08-27 | NP | TRANSAMERICA SERIES TRUST - Transamerica BlackRock Smart Beta 75 VP Service | 98.568 | -1,49 | 6.190 | 6,05 | ||||
| 2025-08-13 | 13F | WCG Wealth Advisors LLC | 17.760 | 0,01 | 1.115 | 7,63 | ||||
| 2025-08-05 | 13F | Mma Asset Management Llc | 3.819 | 0,50 | 240 | 8,14 | ||||
| 2025-08-15 | 13F | Kestra Advisory Services, LLC | 76.939 | 0,03 | 4.832 | 7,67 | ||||
| 2025-07-10 | 13F | Anderson Hoagland & Co | 167.657 | 1,73 | 10.529 | 17,80 | ||||
| 2025-08-13 | 13F | Lido Advisors, LLC | 6.349 | 0,00 | 399 | 7,57 | ||||
| 2025-08-14 | 13F | Citadel Advisors Llc | Call | 9.200 | 578 | |||||
| 2025-08-14 | 13F | Citadel Advisors Llc | 6.767 | 425 | ||||||
| 2025-07-08 | 13F | Ballew Advisors, Inc | 3.215 | 204 | ||||||
| 2025-08-13 | 13F | SageView Advisory Group, LLC | 10.305 | -4,43 | 645 | 2,38 | ||||
| 2025-08-01 | 13F | Rossby Financial, LCC | 159 | 0,00 | 10 | 0,00 | ||||
| 2025-08-14 | 13F | Aberdeen Wealth Management LLC | 16.575 | 0,00 | 1.041 | 7,66 | ||||
| 2025-07-24 | 13F | IFP Advisors, Inc | 1.594 | 0,00 | 100 | 8,70 | ||||
| 2025-08-12 | 13F | J.w. Cole Advisors, Inc. | 4.812 | -11,04 | 302 | -4,13 | ||||
| 2025-06-24 | NP | TNJIX - 1290 Retirement 2025 Fund Class I | 18 | -25,00 | 1 | 0,00 | ||||
| 2025-05-16 | 13F | Laidlaw Wealth Management LLC | 0 | -100,00 | 0 | -100,00 | ||||
| 2025-08-14 | 13F | Toronto Dominion Bank | 0 | -100,00 | 0 | |||||
| 2025-06-24 | NP | TNKIX - 1290 Retirement 2030 Fund Class I | 252 | 0,00 | 15 | 0,00 | ||||
| 2025-07-16 | 13F | Perigon Wealth Management, LLC | 15.650 | -1,76 | 983 | 5,71 | ||||
| 2025-08-27 | 13F/A | Brinker Capital Investments, LLC | 4.247 | 267 | ||||||
| 2025-06-24 | NP | TNOIX - 1290 Retirement 2045 Fund Class I | 725 | 0,00 | 43 | 2,38 | ||||
| 2025-08-06 | 13F | Founders Financial Securities Llc | 56.422 | 0,03 | 3.543 | 6,33 | ||||
| 2025-08-13 | 13F | Vermillion & White Wealth Management Group, LLC | 324 | 0,31 | 20 | 11,11 | ||||
| 2025-07-28 | 13F | Sagespring Wealth Partners, Llc | 12.814 | -28,91 | 805 | -23,50 | ||||
| 2025-08-15 | 13F | Captrust Financial Advisors | 284.978 | -4,65 | 17.897 | 2,64 | ||||
| 2025-07-17 | 13F | Wolff Wiese Magana Llc | 185 | 0,00 | 12 | 10,00 | ||||
| 2025-08-06 | 13F | Savant Capital, LLC | 24.939 | -5,60 | 1.566 | 1,62 | ||||
| 2025-08-14 | 13F | Wiley Bros.-aintree Capital, Llc | 22.379 | 3,07 | 1.405 | 10,98 | ||||
| 2025-07-15 | 13F | Carr Financial Group Corp | 22.720 | 1,02 | 1.427 | 8,69 | ||||
| 2025-08-05 | 13F | Tsfg, Llc | 1.837 | 0,00 | 0 | |||||
| 2025-07-31 | 13F | Kathleen S. Wright Associates Inc. | 12.924 | -18,56 | 812 | -12,32 | ||||
| 2025-08-07 | 13F | Cumberland Advisors Inc | 4.270 | 0,00 | 268 | 7,63 | ||||
| 2025-08-12 | 13F | Fairscale Capital, LLC | 305 | 0,00 | 19 | 5,88 | ||||
| 2025-08-13 | 13F | Cerity Partners LLC | 91.312 | -7,19 | 5.734 | -0,09 | ||||
| 2025-07-10 | 13F | YHB Investment Advisors, Inc. | 46.640 | 6,80 | 2.929 | 14,96 | ||||
| 2025-08-12 | 13F | CIBC Private Wealth Group, LLC | 1.014 | 589,80 | 64 | 800,00 | ||||
| 2025-08-07 | 13F | Summit X, LLC | 4.780 | 4,57 | 300 | 12,78 | ||||
| 2025-08-12 | 13F | Jpmorgan Chase & Co | 335.762 | 28,03 | 21.086 | 37,81 | ||||
| 2025-07-29 | 13F | LMG Wealth Partners, LLC | 62.163 | -0,65 | 3.904 | 6,93 | ||||
| 2025-06-24 | NP | TNNIX - 1290 Retirement 2040 Fund Class I | 641 | 0,00 | 38 | 2,70 | ||||
| 2025-07-14 | 13F | Foster Group, Inc. | 14.011 | 2,29 | 880 | 10,01 | ||||
| 2025-07-30 | 13F | Securian Asset Management, Inc | 242.456 | 0,00 | 15.226 | 7,65 | ||||
| 2025-08-11 | 13F | Principal Securities, Inc. | 16.404 | -7,59 | 1.030 | 0,10 | ||||
| 2025-07-25 | 13F | Johnson Investment Counsel Inc | 36.490 | 5,34 | 2.292 | 13,42 | ||||
| 2025-08-14 | 13F | City National Bank Of Florida /msd | 0 | -100,00 | 0 | |||||
| 2025-07-23 | 13F | Columbus Macro, LLC | 4.393 | -24,88 | 276 | -19,35 | ||||
| 2025-08-14 | 13F | Transamerica Financial Advisors, Inc. | 6.292 | -6,40 | 395 | |||||
| 2025-08-04 | 13F | Pensionmark Financial Group, Llc | 83.217 | 16,54 | 5.226 | 25,47 | ||||
| 2025-07-22 | 13F | Plimoth Trust Co Llc | 31.428 | -0,80 | 1.974 | 6,76 | ||||
| 2025-08-13 | 13F | Kayne Anderson Rudnick Investment Management Llc | 1.327 | 0,00 | 83 | 7,79 | ||||
| 2025-08-01 | 13F | Chilton Capital Management Llc | 1.320 | 0,00 | 83 | 6,49 | ||||
| 2025-08-13 | 13F | Summit Financial, LLC | 16.554 | -19,86 | 1.040 | -13,78 | ||||
| 2025-07-10 | 13F | Farmers & Merchants Trust Co of Chambersburg PA | 0 | -100,00 | 0 | |||||
| 2025-08-14 | 13F | Snowden Capital Advisors LLC | 17.261 | -0,74 | 1.084 | 6,90 | ||||
| 2025-05-08 | 13F | Endeavor Private Wealth, Inc. | 0 | -100,00 | 0 | |||||
| 2025-07-21 | 13F | Jmac Enterprises Llc | 119.292 | 3,40 | 7.492 | 11,31 | ||||
| 2025-07-23 | 13F | Friedenthal Financial | 99.246 | -0,92 | 6.233 | 6,66 | ||||
| 2025-07-08 | 13F | Lowe Wealth Advisors, LLC | 245 | 0,00 | 15 | 7,14 | ||||
| 2025-07-29 | 13F | Stratos Wealth Advisors, LLC | 18.993 | 5,04 | 1.193 | 13,09 | ||||
| 2025-07-29 | 13F | Arcus Capital Partners, LLC | 6.412 | -0,28 | 403 | 7,20 | ||||
| 2025-08-14 | 13F | Integrated Wealth Concepts LLC | 25.403 | 1,48 | 1.595 | 9,25 | ||||
| 2025-08-05 | 13F | Magnolia Capital Advisors Llc | 6.963 | 13,46 | 437 | 22,07 | ||||
| 2025-07-11 | 13F | Farther Finance Advisors, LLC | 1.893 | 53,78 | 119 | 66,20 | ||||
| 2025-06-24 | NP | TNQIX - 1290 Retirement 2055 Fund Class I | 826 | 0,00 | 49 | 2,08 | ||||
| 2025-07-24 | 13F | Beacon Bridge Wealth Partners, LLC | 110.936 | 3,16 | 6.967 | 11,05 | ||||
| 2025-07-29 | 13F | John G Ullman & Associates Inc | 5.350 | 0,00 | 336 | 7,37 | ||||
| 2025-08-13 | 13F | Idaho Trust Bank | 68.315 | -1,98 | 4.289 | 5,51 | ||||
| 2025-07-24 | 13F | Lester Murray Antman dba SimplyRich | 253.407 | -1,58 | 16 | 0,00 | ||||
| 2025-07-17 | 13F | Johnson & White Wealth Management, LLC | 30.536 | 3,93 | 2 | 0,00 | ||||
| 2025-08-14 | 13F | Daiwa Securities Group Inc. | 20.900 | -11,81 | 1 | 0,00 | ||||
| 2025-07-23 | 13F | Heck Capital Advisors, LLC | 5.677 | 357 | ||||||
| 2025-05-02 | 13F | Cable Hill Partners, LLC | 5.476 | 18,45 | 326 | 21,27 | ||||
| 2025-07-25 | 13F | RHS Financial, LLC | 27.570 | 14,22 | 1.731 | 22,94 | ||||
| 2025-08-04 | 13F | Heritage Investors Management Corp | 3.400 | 0 | ||||||
| 2025-08-13 | 13F | Jones Financial Companies Lllp | 21.164 | 39,23 | 1.325 | 49,44 | ||||
| 2025-08-12 | 13F | Journey Strategic Wealth Llc | 42.289 | -5,30 | 2.656 | 1,92 | ||||
| 2025-08-06 | 13F | Atlantic Union Bankshares Corp | 199 | 12 | ||||||
| 2025-07-18 | 13F | Truist Financial Corp | 59.936 | -5,34 | 3.764 | 1,87 | ||||
| 2025-07-31 | 13F | Whipplewood Advisors, LLC | 21.337 | 11.249,47 | 1.340 | 6,78 | ||||
| 2025-08-07 | 13F | Parkside Financial Bank & Trust | 2.046 | 0,00 | 128 | 7,56 | ||||
| 2025-08-12 | 13F | BlackRock, Inc. | 2.730.404 | 8,19 | 171.469 | 16,46 | ||||
| 2025-07-21 | 13F | Hilltop National Bank | 34.679 | -3,37 | 2.178 | 4,61 | ||||
| 2025-07-25 | 13F | Concord Wealth Partners | 244 | 15 | ||||||
| 2025-07-16 | 13F | Investment Partners Asset Management, Inc. | 19.705 | 0,45 | 1.237 | 8,13 | ||||
| 2025-07-18 | 13F | O'ROURKE & COMPANY, Inc | 4.776 | 0,78 | 300 | 8,33 | ||||
| 2025-08-07 | 13F | Tacita Capital Inc | 735 | -55,72 | 46 | -52,08 | ||||
| 2025-08-14 | 13F | Alaska Permanent Fund Corp | 0 | -100,00 | 0 | |||||
| 2025-08-06 | 13F | Atlas Legacy Advisors, LLC | 14.195 | 10,70 | 891 | 18,17 | ||||
| 2025-08-11 | 13F | Cornerstone Planning Group LLC | 107 | 0,00 | 7 | 0,00 | ||||
| 2025-08-14 | 13F | Mission Creek Capital Partners, Inc. | 8.780 | 0,70 | 551 | 8,46 | ||||
| 2025-07-18 | 13F | Parsons Capital Management Inc/ri | 4.722 | 0,00 | 297 | 7,64 | ||||
| 2025-05-16 | 13F | Coppell Advisory Solutions LLC | 0 | -100,00 | 0 | |||||
| 2025-08-04 | 13F | IFG Advisory, LLC | 4.084 | 4,61 | 256 | 12,78 | ||||
| 2025-07-28 | 13F | Ckw Financial Group | 412 | 0,00 | 0 | |||||
| 2025-08-14 | 13F | Glen Eagle Advisors, LLC | 630 | 0,16 | 40 | 8,33 | ||||
| 2025-07-28 | 13F | Rik Saylor Financial, Inc. | 4.729 | -0,30 | 297 | 7,25 | ||||
| 2025-07-29 | 13F | Activest Wealth Management | 0 | 0 | ||||||
| 2025-08-14 | 13F | Royal Bank Of Canada | 189.666 | -2,81 | 11.911 | 4,61 | ||||
| 2025-07-31 | 13F | Oppenheimer & Co Inc | 43.729 | 2,97 | 2.746 | 10,86 | ||||
| 2025-08-14 | 13F | Aqr Capital Management Llc | 6.575 | 413 | ||||||
| 2025-07-14 | 13F | Sowell Financial Services LLC | 3.241 | -7,77 | 204 | -0,98 | ||||
| 2025-08-14 | 13F | GWM Advisors LLC | 36.926 | 58,73 | 2.319 | 70,82 | ||||
| 2025-08-06 | 13F | Commonwealth Equity Services, Llc | 267.436 | -4,41 | 17 | 0,00 | ||||
| 2025-08-04 | 13F | Clear Investment Research, Llc | 4.017 | 0,27 | 252 | 8,15 | ||||
| 2025-08-14 | 13F | Mml Investors Services, Llc | 28.845 | -2,66 | 2 | 0,00 | ||||
| 2025-07-17 | 13F | Vermillion Wealth Management, Inc. | 167 | 1,21 | 11 | 11,11 | ||||
| 2025-04-21 | 13F | PSI Advisors, LLC | 0 | -100,00 | 0 | |||||
| 2025-08-12 | 13F | Frontier Asset Management, LLC | 156.619 | -8,17 | 9.836 | -1,15 | ||||
| 2025-08-06 | 13F | First Horizon Advisors, Inc. | 841 | 0,00 | 53 | 6,12 | ||||
| 2025-08-12 | 13F | Coldstream Capital Management Inc | 7.343 | 351,60 | 461 | 390,43 | ||||
| 2025-07-11 | 13F | Grove Bank & Trust | 132 | 8 | ||||||
| 2025-07-30 | 13F | Whittier Trust Co | 11.547 | 0,87 | 725 | 8,70 | ||||
| 2025-05-14 | 13F | Main Street Group, LTD | 0 | -100,00 | 0 | |||||
| 2025-08-12 | 13F | Steward Partners Investment Advisory, Llc | 57.571 | 1,03 | 3.615 | 8,75 | ||||
| 2025-08-11 | 13F | Shufro Rose & Co Llc | 5.504 | -0,40 | 321 | -0,31 | ||||
| 2025-08-11 | 13F | Bellwether Advisors, LLC | 10.419 | 1,34 | 654 | 9,18 | ||||
| 2025-07-14 | 13F | UMA Financial Services, Inc. | 26.940 | -3,71 | 1.692 | 3,62 | ||||
| 2025-07-30 | 13F | Rehmann Capital Advisory Group | 12.874 | -0,59 | 809 | 7,02 | ||||
| 2025-08-14 | 13F | Glenmede Investment Management, LP | 15.978 | 1.003 | ||||||
| 2025-07-17 | 13F | Alpine Bank Wealth Management | 423 | 27 | ||||||
| 2025-08-06 | 13F | SOUTH STATE Corp | 438 | 0,00 | 28 | 8,00 | ||||
| 2025-05-16 | 13F/A | Kestra Investment Management, LLC | 0 | -100,00 | 0 | |||||
| 2025-07-15 | 13F | Fifth Third Bancorp | 468 | 3.020,00 | 29 | |||||
| 2025-07-15 | 13F | Patriot Investment Management Inc. | 8.136 | -2,12 | 511 | 5,37 | ||||
| 2025-08-13 | 13F | Transce3nd, LLC | 581 | -5,22 | 36 | 2,86 | ||||
| 2025-08-12 | 13F | AlphaCore Capital LLC | 606 | 10,99 | 38 | 22,58 | ||||
| 2025-07-15 | 13F | Evanson Asset Management, LLC | 4.844 | 0,00 | 304 | 7,80 | ||||
| 2025-07-25 | 13F | Atria Wealth Solutions, Inc. | 0 | -100,00 | 0 | |||||
| 2025-08-08 | 13F | Citizens Financial Group Inc/ri | 5.250 | -64,74 | 330 | -62,10 | ||||
| 2025-08-14 | 13F | Qube Research & Technologies Ltd | 74.777 | 289,28 | 4.696 | 319,20 | ||||
| 2025-07-24 | 13F | Riverchase Wealth Management, Llc | 12.718 | 0,00 | 799 | 7,69 | ||||
| 2025-07-28 | 13F | Private Wealth Asset Management, LLC | 2.970 | 0,00 | 187 | 7,51 | ||||
| 2025-08-04 | 13F | Spire Wealth Management | 199 | -80,72 | 12 | -80,00 | ||||
| 2025-08-13 | 13F | Renaissance Technologies Llc | 10.900 | 685 | ||||||
| 2025-08-07 | 13F | Allworth Financial LP | 3.008 | -2,50 | 189 | 3,30 | ||||
| 2025-04-23 | 13F | New World Advisors LLC | 0 | -100,00 | 0 | |||||
| 2025-08-12 | 13F | Global Retirement Partners, LLC | 7.393 | 5,57 | 464 | 14,29 | ||||
| 2025-07-22 | 13F | BridgePort Financial Solutions, LLC | 7.796 | 4,56 | 490 | 12,41 | ||||
| 2025-08-04 | 13F | Arkadios Wealth Advisors | 8.578 | -1,58 | 539 | 5,91 | ||||
| 2025-08-27 | NP | TRANSAMERICA SERIES TRUST - Transamerica BlackRock Smart Beta 50 VP Service | 178.181 | -2,11 | 11.190 | 5,37 | ||||
| 2025-08-01 | 13F | Teacher Retirement System Of Texas | 0 | -100,00 | 0 | |||||
| 2025-08-12 | 13F | Proequities, Inc. | 0 | 0 | ||||||
| 2025-08-18 | 13F | Geneos Wealth Management Inc. | 494 | -56,40 | 31 | -53,03 | ||||
| 2025-07-07 | 13F | Retirement Wealth Solutions LLC | 1 | 0,00 | 0 | |||||
| 2025-05-14 | 13F | Van Hulzen Asset Management, LLC | 0 | -100,00 | 0 | |||||
| 2025-07-23 | 13F | Venturi Wealth Management, LLC | 304.298 | 173,56 | 19.110 | 194,48 | ||||
| 2025-07-10 | 13F | Cypress Point Wealth Management, LLC | 4.460 | 0,00 | 280 | 7,69 | ||||
| 2025-07-30 | 13F | D.a. Davidson & Co. | 10.636 | 0,66 | 668 | 8,28 |