Grundlæggende statistik
| Institutionelle aktier (lange) | 32.523.337 - 69,51% (ex 13D/G) - change of 0,68MM shares 2,13% MRQ |
| Institutionel værdi (lang) | $ 263.899 USD ($1000) |
Institutionelt ejerskab og aktionærer
Ginkgo Bioworks Holdings, Inc. (US:DNA) har 188 institutionelle ejere og aktionærer, der har indsendt 13D/G- eller 13F-formularer til Securities Exchange Commission (SEC). Disse institutioner har i alt 32,523,337 aktier. Største aktionærer omfatter Viking Global Investors Lp, BlackRock, Inc., Vanguard Group Inc, Baillie Gifford & Co, Erste Asset Management GmbH, Anchorage Capital Group, L.L.C., Legal & General Group Plc, State Street Corp, Forbes J M & Co Llp, and Geode Capital Management, Llc .
Ginkgo Bioworks Holdings, Inc. (NYSE:DNA) institutionel ejerskabsstruktur viser aktuelle positioner i virksomheden efter institutioner og fonde, samt seneste ændringer i positionsstørrelse. Større aktionærer kan omfatte individuelle investorer, investeringsforeninger, hedgefonde eller institutioner. Skema 13D angiver, at investoren besidder (eller besidder) mere end 5 % af virksomheden og har til hensigt (eller har til hensigt at) aktivt at forfølge en ændring i forretningsstrategi. Skema 13G indikerer en passiv investering på over 5%.
The share price as of April 24, 2026 is 7,87 / share. Previously, on April 28, 2025, the share price was 8,02 / share. This represents a decline of 1,87% over that period.

Fondens stemningsscore
Fund Sentiment Score (fka Ownership Accumulation Score) finder de aktier, der bliver mest købt af fonde. Det er resultatet af en sofistikeret, multi-faktor kvantitativ model, der identificerer virksomheder med de højeste niveauer af institutionel akkumulering. Scoringsmodellen bruger en kombination af den samlede stigning i oplyste ejere, ændringerne i porteføljeallokeringer i disse ejere og andre målinger. Tallet går fra 0 til 100, hvor højere tal indikerer et højere niveau af akkumulering for sine jævnaldrende, og 50 er gennemsnittet.
Opdateringsfrekvens: Dagligt
Se Ownership Explorer, som giver en liste over højest rangerende virksomheder.
AI+ Ask Fintel’s AI assistant about Ginkgo Bioworks Holdings, Inc..
Select a question to share a public post with an AI-crafted answer.
Thinking of good questions…
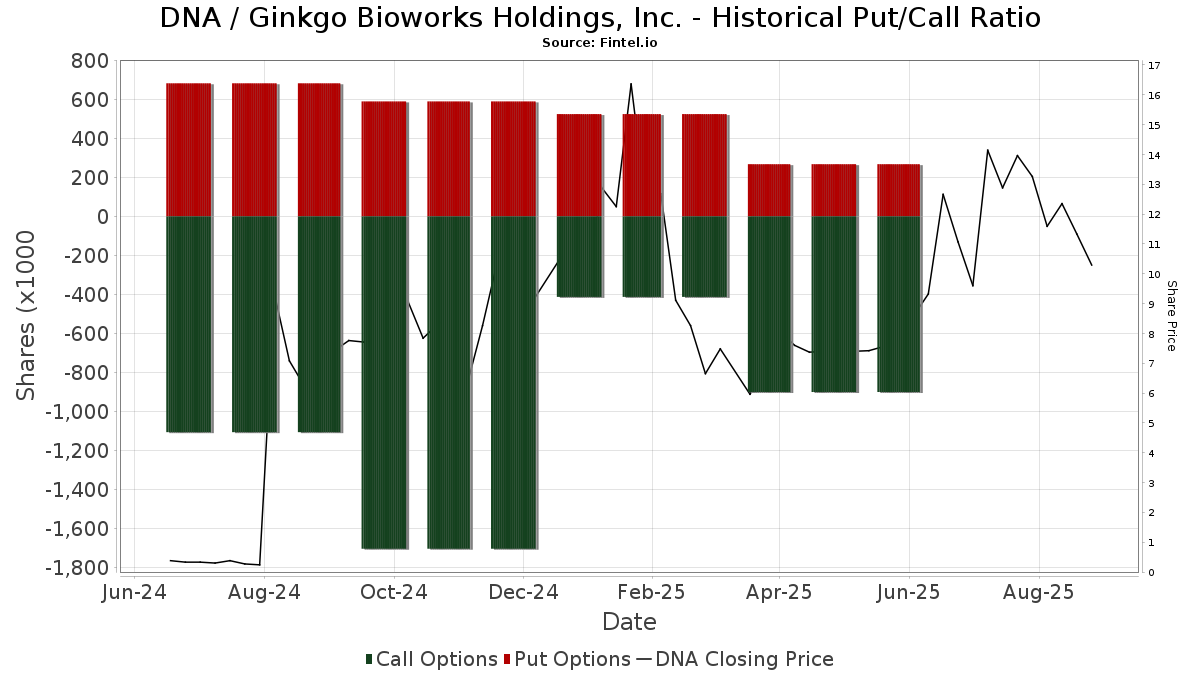
Institutionel Put/Call-forhold
Ud over at indberette standardaktie- og gældsudstedelser skal institutter med mere end 100 mill. aktiver under forvaltning også oplyse deres put- og call-optionsbeholdninger. Da salgsoptioner generelt indikerer negativ stemning, og købsoptioner indikerer positiv stemning, kan vi få en fornemmelse af den overordnede institutionelle stemning ved at plotte forholdet mellem put og kald. Diagrammet til højre viser det historiske put/call-forhold for dette instrument.
Brug af Put/Call Ratio som en indikator for investorernes stemning overvinder en af de vigtigste mangler ved at bruge totalt institutionelt ejerskab, som er, at en betydelig mængde af aktiver under forvaltning investeres passivt for at spore indekser. Passivt forvaltede fonde køber typisk ikke optioner, så indikatoren for put/call-forholdet følger mere nøje følelsen af aktivt forvaltede fonde.
13D/G-arkivering
Vi præsenterer 13D/G ansøgninger separat fra 13F ansøgninger på grund af den forskellige behandling af SEC. 13D/G-ansøgninger kan indgives af grupper af investorer (med én ledende), hvorimod 13F-ansøgninger ikke kan. Dette resulterer i situationer, hvor en investor kan indsende en 13D/G, der rapporterer én værdi for de samlede aktier (der repræsenterer alle de aktier, der ejes af investorgruppen), men derefter indsender en 13F, der rapporterer en anden værdi for de samlede aktier (der udelukkende repræsenterer deres egne) ejendomsret). Det betyder, at aktieejerskab af 13D/G-arkiver og 13F-arkiveringer ofte ikke er direkte sammenlignelige, så vi præsenterer dem separat.
Bemærk: Fra den 16. maj 2021 viser vi ikke længere ejere, der ikke har indsendt en 13D/G inden for det seneste år. Tidligere viste vi den fulde historie af 13D/G-arkiver. Generelt skal enheder, der er forpligtet til at indgive 13D/G-ansøgninger, indgive mindst årligt, før de indsender en afsluttende ansøgning. Dog forlader fonde nogle gange positioner uden at indsende en afsluttende ansøgning (dvs. de afvikler), så visning af den fulde historie resulterede nogle gange i forvirring om det nuværende ejerskab. For at undgå forvirring viser vi nu kun 'aktuelle' ejere - det vil sige - ejere, der har anmeldt inden for det seneste år.
Upgrade to unlock premium data.
| Fil dato | Form | Investor | Forrige Aktier |
Seneste Aktier |
Δ Aktier (Procent) |
Ejendomsret (Procent) |
Δ Ejerskab (Procent) |
|
|---|---|---|---|---|---|---|---|---|
| 2026-02-05 | BAILLIE GIFFORD & CO | 134,425,866 | 2,391,649 | -98.22 | 4.90 | -37.74 | ||
| 2025-11-14 | CASCADE INVESTMENT, L.L.C. | 151,865,481 | 3,621,636 | -97.62 | 7.50 | -34.21 | ||
| 2025-07-29 | VANGUARD GROUP INC | 2,013,548 | 2,381,115 | 18.25 | 5.13 | 15.28 | ||
| 2025-07-17 | BlackRock, Inc. | 3,001,643 | 6.50 |
13F og NPORT arkivering
Detaljer om 13F-arkivering er gratis. Detaljer om NP-ansøgninger kræver et premium-medlemskab. Grønne rækker angiver nye positioner. Røde rækker angiver lukkede positioner. Klik på linket ikon for at se den fulde transaktionshistorik.
Opgrader
for at låse premium-data op og eksportere til Excel ![]() .
.
| Fil dato | Kilde | Investor | Type | Gennemsnitlig pris (Øst) |
Aktier | Δ Aktier (%) |
Rapporteret Værdi ($1000) |
Δ Værdi (%) |
Port Alloc (%) |
|
|---|---|---|---|---|---|---|---|---|---|---|
| 2026-02-13 | 13F | Manufacturers Life Insurance Company, The | 0 | -100,00 | 0 | |||||
| 2026-04-13 | 13F | True Wealth Design, LLC | 27 | -38,64 | 0 | |||||
| 2026-02-13 | 13F | Citigroup Inc | 1.171 | -59,26 | 10 | -78,05 | ||||
| 2026-02-13 | 13F | SRS Capital Advisors, Inc. | 3 | -96,84 | 0 | -100,00 | ||||
| 2026-02-17 | 13F | D. E. Shaw & Co., Inc. | Call | 222.800 | 36,10 | 1.851 | -22,42 | |||
| 2025-11-10 | 13F | Monaco Asset Management SAM | 0 | -100,00 | 0 | |||||
| 2026-01-28 | 13F | Universal- Beteiligungs- und Servicegesellschaft mbH | 140.000 | 0,00 | 1.141 | -44,10 | ||||
| 2026-04-13 | 13F | IFP Advisors, Inc | 43 | 0 | ||||||
| 2026-02-11 | 13F | Ameritas Investment Partners, Inc. | 3.284 | 27 | ||||||
| 2026-02-17 | 13F | D. E. Shaw & Co., Inc. | 33.772 | 281 | ||||||
| 2025-10-27 | 13F | Kiker Wealth Management, LLC | 0 | -100,00 | 0 | |||||
| 2026-02-10 | 13F | Intech Investment Management Llc | 14.487 | -8,36 | 120 | -47,83 | ||||
| 2026-02-06 | 13F | Prescott Group Capital Management, L.l.c. | 541.845 | 4.503 | ||||||
| 2026-02-12 | 13F | Swiss National Bank | 65.063 | 11,29 | 541 | -36,62 | ||||
| 2026-02-13 | 13F | Ubs Asset Management Americas Inc | 57.736 | 0,10 | 480 | -42,98 | ||||
| 2026-02-12 | 13F | Quadrant Capital Group Llc | 448 | 0,00 | 4 | -50,00 | ||||
| 2026-01-26 | 13F | Asset Dedication, LLC | 1.000 | 8 | ||||||
| 2026-02-10 | 13F | Savant Capital, LLC | 0 | -100,00 | 0 | |||||
| 2025-11-14 | 13F | Wolverine Trading, Llc | Call | 72.900 | 964 | |||||
| 2025-11-14 | 13F | Wolverine Trading, Llc | Put | 37.200 | 492 | |||||
| 2026-02-04 | 13F | Virginia Retirement Systems Et Al | 13.200 | 0,00 | 110 | -43,23 | ||||
| 2026-02-10 | 13F | State of Wyoming | 0 | -100,00 | 0 | |||||
| 2026-02-10 | 13F | Welch & Forbes Llc | 30.000 | 0,00 | 249 | -43,02 | ||||
| 2026-02-17 | 13F | Numerai GP LLC | 25.625 | 94,07 | 213 | 10,42 | ||||
| 2025-11-14 | 13F | Opaleye Management Inc. | 0 | -100,00 | 0 | |||||
| 2026-02-17 | 13F | PDT Partners, LLC | 16.168 | -59,38 | 134 | -76,90 | ||||
| 2025-11-14 | 13F | XTX Topco Ltd | 0 | -100,00 | 0 | -100,00 | ||||
| 2026-02-10 | 13F/A | Northwestern Mutual Wealth Management Co | 756 | -5,62 | 6 | -45,45 | ||||
| 2026-02-13 | 13F | Barclays Plc | 64.465 | 11,53 | 536 | -36,46 | ||||
| 2026-02-09 | 13F | Employees Retirement System of Texas | 0 | -100,00 | 0 | |||||
| 2026-02-12 | 13F | BlackRock, Inc. | 3.573.369 | 4,55 | 29.695 | -40,41 | ||||
| 2026-02-17 | 13F | Comprehensive Financial Management LLC | 17.656 | 0,00 | 147 | -43,19 | ||||
| 2026-02-09 | 13F | Harbour Investments, Inc. | 39 | 0,00 | 0 | |||||
| 2026-02-17 | 13F | Algert Global Llc | 152.160 | 1 | ||||||
| 2026-04-13 | 13F | Salem Investment Counselors Inc | 781 | 5 | ||||||
| 2025-11-12 | 13F | Ameriflex Group, Inc. | 0 | -100,00 | 0 | |||||
| 2026-02-19 | 13F | Invesco Ltd. | 261.706 | 23,95 | 2.175 | -29,37 | ||||
| 2026-02-17 | 13F | Advisor Group Holdings, Inc. | 5.328 | -3,36 | 44 | -38,89 | ||||
| 2025-11-19 | 13F | Caitong International Asset Management Co., Ltd | 0 | -100,00 | 0 | |||||
| 2026-01-21 | 13F | Westfuller Advisors, LLC | 1.698 | 14 | ||||||
| 2026-04-15 | 13F | Hartford Financial Management Inc. | 65 | 0,00 | 0 | |||||
| 2026-02-10 | 13F | Daiwa Securities Group Inc. | 6.850 | 18,76 | 0 | |||||
| 2025-11-12 | 13F | Transce3nd, LLC | 0 | -100,00 | 0 | |||||
| 2026-04-24 | 13F | Root Financial Partners, LLC | 24 | 0 | ||||||
| 2026-02-12 | 13F | BRYN MAWR TRUST Co | 50 | 0,00 | 0 | |||||
| 2026-02-13 | 13F | SPX Equities Gestao de Recursos Ltda | 0 | -100,00 | 0 | |||||
| 2026-01-15 | 13F | Nisa Investment Advisors, Llc | 0 | -100,00 | 0 | |||||
| 2025-11-07 | 13F | Shell Asset Management Co | 886 | 5,10 | 0 | |||||
| 2026-04-08 | 13F | Wealth Enhancement Advisory Services, Llc | 11.907 | 82 | ||||||
| 2026-02-11 | 13F | Hughes Financial Services, LLC | 19 | 0,00 | 0 | |||||
| 2026-02-13 | 13F | Headlands Technologies LLC | 38.712 | -5,57 | 322 | -46,23 | ||||
| 2026-02-17 | 13F | Dv Equities, Llc | 400 | 3 | ||||||
| 2026-02-17 | 13F | SageView Advisory Group, LLC | 12 | 0 | ||||||
| 2026-02-10 | 13F | Evolution Wealth Management Inc. | 8 | 0,00 | 0 | |||||
| 2026-02-13 | 13F | Gen-Wealth Partners Inc | 5 | 0,00 | 0 | |||||
| 2026-02-17 | 13F | Equitable Holdings, Inc. | 48.379 | -41,20 | 402 | -66,47 | ||||
| 2026-02-17 | 13F | Tower Research Capital LLC (TRC) | 1.016 | -11,27 | 8 | -50,00 | ||||
| 2026-02-12 | 13F | MetLife Investment Management, LLC | 18.469 | -23,83 | 153 | -56,66 | ||||
| 2025-11-07 | 13F | Gsa Capital Partners Llp | 0 | -100,00 | 0 | |||||
| 2026-02-12 | 13F | Penserra Capital Management LLC | 246 | -98,10 | 0 | |||||
| 2026-04-07 | 13F | Estate Planners Group, LLC | 2 | 0 | ||||||
| 2026-02-09 | 13F | Geode Capital Management, Llc | 999.600 | 23,66 | 8.309 | -29,52 | ||||
| 2026-02-13 | 13F | Colony Group, LLC | 11.028 | 123 | ||||||
| 2026-02-17 | 13F | Russell Investments Group, Ltd. | 22.407 | 4,63 | 186 | -40,38 | ||||
| 2026-04-15 | 13F | FNY Investment Advisers, LLC | 15.380 | 49,32 | 0 | |||||
| 2026-04-15 | 13F | FNY Investment Advisers, LLC | Call | 150 | 0 | |||||
| 2026-04-22 | 13F | Sterling Capital Management LLC | 1.366 | -39,15 | 8 | -55,56 | ||||
| 2026-02-17 | 13F | Engineers Gate Manager LP | 31.108 | 259 | ||||||
| 2026-02-10 | 13F | Acadian Asset Management Llc | 34.699 | 431,62 | 0 | |||||
| 2026-02-13 | 13F | Caxton Associates Llp | 172.580 | 33,18 | 1.434 | -24,09 | ||||
| 2026-02-13 | 13F | Madrona Venture Group, LLC | 42.430 | 0,00 | 0 | |||||
| 2026-04-20 | 13F | Boston Standard Wealth Management, LLC | 15.165 | 97 | ||||||
| 2026-02-23 | 13F | Wealth Preservation Advisors, LLC | 50 | 0,00 | 0 | |||||
| 2026-02-06 | 13F | Pnc Financial Services Group, Inc. | 65 | -69,91 | 1 | -100,00 | ||||
| 2026-02-13 | 13F | American Century Companies Inc | 88.295 | 10,18 | 734 | -37,24 | ||||
| 2026-02-11 | 13F | United Financial Planning Group LLC | 55 | 0 | ||||||
| 2026-01-27 | 13F | Zurcher Kantonalbank (Zurich Cantonalbank) | 3.700 | 0,00 | 31 | -43,40 | ||||
| 2026-02-03 | 13F | SBI Securities Co., Ltd. | 3.670 | 0,94 | 30 | -43,40 | ||||
| 2025-11-14 | 13F | National Bank Of Canada /fi/ | 0 | -100,00 | 0 | |||||
| 2026-04-17 | 13F | HHM Wealth Advisors, LLC | 100 | 0,00 | 1 | |||||
| 2026-02-12 | 13F | Hollencrest Capital Management | 75 | 0,00 | 1 | -100,00 | ||||
| 2026-02-17 | 13F | Brevan Howard Capital Management LP | 11.401 | 95 | ||||||
| 2026-02-05 | 13F | Tucker Asset Management Llc | 9 | 0 | ||||||
| 2026-02-17 | 13F | PharVision Advisers, LLC | 0 | -100,00 | 0 | |||||
| 2026-02-03 | 13F | Legacy Wealth Managment, LLC/ID | 112 | 0,00 | 1 | -100,00 | ||||
| 2026-02-13 | 13F | Mariner, LLC | 53.475 | 1,14 | 444 | -42,34 | ||||
| 2026-01-29 | 13F | UBS Group AG | 489.418 | 86,40 | 4.067 | 6,24 | ||||
| 2025-11-14 | 13F | Cubist Systematic Strategies, LLC | 0 | -100,00 | 0 | -100,00 | ||||
| 2026-02-24 | 13F | Bell Investment Advisors, Inc | 0 | -100,00 | 0 | |||||
| 2026-02-10 | 13F | Exor Capital LLP | 250.282 | 0,00 | 2.080 | -43,03 | ||||
| 2026-01-08 | 13F | Versant Capital Management, Inc | 0 | -100,00 | 0 | |||||
| 2026-02-06 | 13F | Nano Cap New Millennium Growth Fund L P | 20.000 | 166 | ||||||
| 2026-02-06 | 13F | Covestor Ltd | 1 | 0,00 | 0 | |||||
| 2026-04-20 | 13F | Jfs Wealth Advisors, Llc | 1 | 0 | ||||||
| 2026-02-10 | 13F | Bank of New York Mellon Corp | 121.781 | -0,13 | 1.012 | -43,11 | ||||
| 2026-02-11 | 13F | Capital Analysts, Inc. | 1.134 | 0,00 | 0 | |||||
| 2026-02-13 | 13F | Jacobs Levy Equity Management, Inc | 244.419 | 244,90 | 2.031 | 96,61 | ||||
| 2026-02-12 | 13F | Edgewood Management Llc | 50.000 | 416 | ||||||
| 2026-02-06 | 13F | GPS Wealth Strategies Group, LLC | 0 | -100,00 | 0 | |||||
| 2026-02-06 | 13F | EverSource Wealth Advisors, LLC | 330 | -1,20 | 3 | -50,00 | ||||
| 2026-02-10 | 13F | Belvedere Trading LLC | Call | 33.400 | 0,00 | 7 | -36,36 | |||
| 2026-02-10 | 13F | Belvedere Trading LLC | 177 | 1 | ||||||
| 2026-02-10 | 13F | Belvedere Trading LLC | Put | 800 | 0,00 | 0 | ||||
| 2026-02-18 | 13F | Sb Investment Advisers (uk) Ltd | 610.729 | 0,00 | 5.075 | -43,00 | ||||
| 2026-04-07 | 13F | Farther Finance Advisors, LLC | 332 | -60,43 | 2 | -66,67 | ||||
| 2026-02-17 | 13F | Optiver Holding B.V. | 127 | 0,00 | 1 | 0,00 | ||||
| 2026-01-29 | 13F | Quent Capital, LLC | 1.009 | 0,00 | 8 | -42,86 | ||||
| 2026-02-11 | 13F | Allianz Asset Management GmbH | 449.788 | 134,07 | 3.738 | 33,42 | ||||
| 2026-02-12 | 13F | Steward Partners Investment Advisory, Llc | 654 | 4,47 | 5 | -44,44 | ||||
| 2025-11-14 | 13F | Corton Capital Inc. | 0 | -100,00 | 0 | |||||
| 2026-02-05 | 13F | Western Wealth Management, LLC | 10.000 | 83 | ||||||
| 2026-02-17 | 13F | Glenview Capital Management, Llc | 149.379 | 0,00 | 1.241 | -42,99 | ||||
| 2026-02-09 | 13F | Hartland & Co., LLC | 2 | 0,00 | 0 | |||||
| 2026-02-13 | 13F | Police & Firemen's Retirement System of New Jersey | 10.170 | 0,00 | 85 | -43,24 | ||||
| 2026-02-17 | 13F | Cape Investment Advisory, Inc. | 0 | -100,00 | 0 | |||||
| 2026-02-09 | 13F | Quest Partners LLC | 37.279 | 249,64 | 310 | 99,35 | ||||
| 2026-02-14 | 13F | Rockefeller Capital Management L.P. | 7.912 | -28,38 | 66 | -59,63 | ||||
| 2026-02-13 | 13F | Sofos Investments, Inc. | 0 | -100,00 | 0 | |||||
| 2026-02-12 | 13F | Jane Street Group, Llc | Put | 0 | -100,00 | 0 | -100,00 | |||
| 2026-02-13 | 13F | State Street Corp | 1.292.071 | 38,36 | 10.737 | -21,14 | ||||
| 2026-02-17 | 13F | Royal Bank Of Canada | 1.372 | -97,42 | 12 | -98,45 | ||||
| 2026-02-13 | 13F | Walleye Trading LLC | Call | 13.100 | 109 | |||||
| 2026-02-13 | 13F | Walleye Trading LLC | 2.637 | 22 | ||||||
| 2026-02-13 | 13F | Walleye Trading LLC | Put | 3.500 | 29 | |||||
| 2026-01-30 | 13F | Us Bancorp \de\ | 6.806 | 6,98 | 57 | -39,13 | ||||
| 2026-01-22 | 13F | Financial Consulate, Inc | 0 | -100,00 | 0 | |||||
| 2026-02-17 | 13F | Fmr Llc | 3.915 | 42,67 | 33 | -20,00 | ||||
| 2026-02-10 | 13F | Goldman Sachs Group Inc | 919.309 | 11,39 | 7.639 | -36,51 | ||||
| 2026-02-17 | 13F | Bank Of America Corp /de/ | 602.576 | -43,61 | 5.007 | -67,86 | ||||
| 2026-02-11 | 13F | LPL Financial LLC | 31.527 | -2,73 | 262 | -44,70 | ||||
| 2026-02-13 | 13F | Verition Fund Management LLC | 95.989 | -0,45 | 798 | -43,27 | ||||
| 2026-02-17 | 13F | Casdin Capital, LLC | 36.493 | 0,00 | 303 | -43,05 | ||||
| 2026-04-23 | 13F | TFC Financial Management | 300 | 0,00 | 2 | -50,00 | ||||
| 2026-02-13 | 13F | Squarepoint Ops LLC | 196.820 | 1.636 | ||||||
| 2026-02-13 | 13F | Charles Schwab Investment Management Inc | 358.295 | 4,29 | 2.977 | -40,57 | ||||
| 2026-02-17 | 13F | Coastal Bridge Advisors, LLC | 276.817 | 0,00 | 2.300 | -43,00 | ||||
| 2026-02-17 | 13F | Caption Management, LLC | 0 | -100,00 | 0 | |||||
| 2026-02-17 | 13F | Atom Investors LP | 12.635 | 105 | ||||||
| 2026-04-23 | 13F | CWM Advisors, LLC | 83.905 | 46,45 | 514 | 7,98 | ||||
| 2026-02-17 | 13F | Caption Management, LLC | Call | 0 | -100,00 | 0 | ||||
| 2026-02-10 | 13F | Td Asset Management Inc | 13.046 | 0,00 | 108 | -43,16 | ||||
| 2026-02-17 | 13F | Alliancebernstein L.p. | 23.092 | 0,00 | 192 | -43,15 | ||||
| 2026-01-16 | 13F | Hopwood Financial Services, Inc. | 0 | -100,00 | 0 | |||||
| 2026-01-23 | 13F | Baillie Gifford & Co | 2.391.649 | -26,08 | 19.875 | -57,87 | ||||
| 2026-02-11 | 13F | Jpmorgan Chase & Co | 16.685 | 5,76 | 139 | -40,00 | ||||
| 2026-02-17 | 13F | Two Sigma Advisers, Lp | 11.856 | -61,89 | 99 | -78,37 | ||||
| 2026-02-10 | 13F | Bnp Paribas Arbitrage, Sa | 174.792 | -5,87 | 1.453 | -46,36 | ||||
| 2026-03-12 | 13F/A | Peak6 Llc | 162.837 | 1.353 | ||||||
| 2026-03-12 | 13F/A | Peak6 Llc | Call | 20.800 | 173 | |||||
| 2026-02-23 | 13F | Leonteq Securities AG | 0 | -100,00 | 0 | |||||
| 2026-02-12 | 13F | Pfizer Inc | 2.928 | 0,00 | 24 | -42,86 | ||||
| 2026-01-29 | 13F | Vanguard Group Inc | 2.900.952 | 16,95 | 24.107 | -33,34 | ||||
| 2026-02-17 | 13F | Tudor Investment Corp Et Al | 193.962 | 1.612 | ||||||
| 2026-02-03 | 13F | Winch Advisory Services, LLC | 33 | 0,00 | 0 | |||||
| 2026-02-10 | 13F | Axq Capital, Lp | 11.997 | 100 | ||||||
| 2026-01-27 | 13F | TD Waterhouse Canada Inc. | 50 | 0,00 | 0 | |||||
| 2026-02-17 | 13F | AH Capital Management, L.L.C. | 108.568 | 0,00 | 902 | -42,98 | ||||
| 2026-01-21 | 13F | Modera Wealth Management, LLC | 21.828 | 0,00 | 181 | -43,08 | ||||
| 2026-02-12 | 13F | Federation des caisses Desjardins du Quebec | 2.250 | 0,00 | 19 | -43,75 | ||||
| 2026-01-22 | 13F | Bartlett & Co. Wealth Management Llc | 12 | 0,00 | 0 | |||||
| 2026-02-13 | 13F | Quarry LP | 0 | -100,00 | 0 | |||||
| 2026-02-10 | 13F | Quantbot Technologies LP | 2.400 | 20 | ||||||
| 2026-02-10 | 13F | Rothschild Investment Llc | 14 | 0 | ||||||
| 2026-02-03 | 13F/A | Bank Of America Corp /de/ | Put | 0 | -100,00 | 0 | -100,00 | |||
| 2026-02-17 | 13F | Public Employees Retirement System Of Ohio | 20.500 | 170 | ||||||
| 2026-02-17 | 13F | Point72 Asset Management, L.P. | 76.908 | 639 | ||||||
| 2026-04-16 | 13F | Forbes J M & Co Llp | 1.028.391 | -1,16 | 6.304 | -27,09 | ||||
| 2026-02-02 | 13F | Strs Ohio | 0 | -100,00 | 0 | |||||
| 2026-01-22 | 13F | Massachusetts Financial Services Co /ma/ | 50.273 | 66,09 | 418 | -5,44 | ||||
| 2026-02-13 | 13F | Wells Fargo & Company/mn | 52.135 | 63,43 | 433 | -6,88 | ||||
| 2026-02-17 | 13F | Graham Capital Management, L.P. | 88.038 | 732 | ||||||
| 2026-01-28 | 13F | Hoey Investments, Inc | 65 | 0,00 | 1 | |||||
| 2026-04-06 | 13F | GAMMA Investing LLC | 835 | 59,66 | 5 | 25,00 | ||||
| 2026-02-17 | 13F | Anchorage Capital Group, L.L.C. | 1.746.363 | 0,00 | 14.512 | -43,00 | ||||
| 2026-02-12 | 13F | Dimensional Fund Advisors Lp | 102.614 | 670,61 | 853 | 339,18 | ||||
| 2026-04-23 | 13F | SJS Investment Consulting Inc. | 16 | 0 | ||||||
| 2026-02-17 | 13F | Janus Henderson Group Plc | 14.534 | 0,00 | 120 | -43,13 | ||||
| 2026-02-12 | 13F | New York State Common Retirement Fund | 12.300 | 0,00 | 102 | -43,02 | ||||
| 2026-02-13 | 13F | Walleye Capital LLC | Put | 4.100 | -51,19 | 34 | -72,13 | |||
| 2026-02-11 | 13F | Erste Asset Management GmbH | 2.000.000 | -9,09 | 16.620 | -42,90 | ||||
| 2026-02-13 | 13F | Walleye Capital LLC | 5.079 | 42 | ||||||
| 2026-02-12 | 13F | Principal Securities, Inc. | 0 | -100,00 | 0 | |||||
| 2026-02-13 | 13F | Walleye Capital LLC | Call | 33.400 | 1.987,50 | 278 | 1.104,35 | |||
| 2026-02-17 | 13F | Shay Capital LLC | 43.899 | 107,09 | 365 | 17,80 | ||||
| 2026-02-05 | 13F | Allworth Financial LP | 29 | 52,63 | 0 | |||||
| 2026-02-17 | 13F | Viking Global Investors Lp | 3.577.128 | 0,00 | 29.726 | -43,01 | ||||
| 2026-02-17 | 13F | Sherbrooke Park Advisers Llc | 0 | -100,00 | 0 | |||||
| 2026-04-15 | 13F | Fortitude Family Office, LLC | 0 | -100,00 | 0 | |||||
| 2026-02-17 | 13F | Millennium Management Llc | 48.901 | 113,88 | 406 | 21,92 | ||||
| 2026-02-17 | 13F | Northern Trust Corp | 313.275 | -3,76 | 2.603 | -45,14 | ||||
| 2026-02-17 | 13F | Aqr Capital Management Llc | 170.555 | 13,18 | 1.417 | -35,50 | ||||
| 2026-01-29 | 13F | Teachers Retirement System Of The State Of Kentucky | 9.246 | -56,89 | 0 | |||||
| 2026-01-28 | 13F | Klp Kapitalforvaltning As | 7.183 | 53,38 | 60 | -13,24 | ||||
| 2026-02-14 | 13F | Tao Capital Management LP | 0 | -100,00 | 0 | |||||
| 2026-02-17 | 13F | Meteora Capital, LLC | 22.100 | -1,69 | 184 | -44,04 | ||||
| 2026-02-11 | 13F | Strategic Advocates LLC | 4.381 | 808,92 | 36 | 400,00 | ||||
| 2026-04-07 | 13F | Signaturefd, Llc | 249 | -54,89 | 2 | -75,00 | ||||
| 2026-02-11 | 13F | Simplex Trading, Llc | 0 | -100,00 | 0 | |||||
| 2026-02-12 | 13F | Nuveen, LLC | 179.638 | 205,41 | 1.493 | 74,10 | ||||
| 2026-04-16 | 13F | Capital Advisors, Ltd. LLC | 1.269 | -1,01 | 0 | |||||
| 2025-11-17 | 13F | Sender Co & Partners, Inc. | 0 | -100,00 | 0 | |||||
| 2026-04-03 | 13F | Adirondack Trust Co | 43 | 0,00 | 0 | |||||
| 2026-04-15 | 13F | Exchange Traded Concepts, Llc | 321.962 | -7,96 | 1.974 | -32,11 | ||||
| 2026-02-12 | 13F | Jane Street Group, Llc | Call | 21.018 | -80,00 | 175 | -88,64 | |||
| 2026-02-12 | 13F | Jane Street Group, Llc | 181.755 | 113,78 | 1.510 | 21,87 | ||||
| 2026-02-13 | 13F | MAI Capital Management | 6 | 0 | ||||||
| 2026-02-17 | 13F | MIRAE ASSET GLOBAL ETFS HOLDINGS Ltd. | 19.175 | 6,16 | 159 | -39,54 | ||||
| 2026-02-12 | 13F | CIBC Private Wealth Group, LLC | 75 | 0,00 | 1 | -100,00 | ||||
| 2026-02-17 | 13F | Bank Of America Corp /de/ | Call | 0 | -100,00 | 0 | -100,00 | |||
| 2026-02-06 | 13F | Global Retirement Partners, LLC | 25 | 0,00 | 0 | |||||
| 2026-02-10 | 13F | Allen Operations Llc | 61.951 | 0,00 | 515 | -43,08 | ||||
| 2026-04-07 | 13F | Green Alpha Advisors, LLC | 13.776 | -3,85 | 84 | -29,41 | ||||
| 2026-02-11 | 13F | Parallel Advisors, LLC | 438 | 0,00 | 4 | -50,00 | ||||
| 2026-02-06 | 13F | VSM Wealth Advisory, LLC | 1.000 | 0,00 | 8 | -42,86 | ||||
| 2026-02-17 | 13F | Price T Rowe Associates Inc /md/ | 94.873 | 2,01 | 1 | -100,00 | ||||
| 2026-02-17 | 13F | Ameriprise Financial Inc | 49.278 | 410 | ||||||
| 2026-02-13 | 13F | Fifth Lane Capital, Lp | Call | 3.000 | 25 | |||||
| 2026-02-17 | 13F | Raymond James Financial Inc | 0 | -100,00 | 0 | |||||
| 2026-02-06 | 13F | Larson Financial Group LLC | 0 | -100,00 | 0 | |||||
| 2026-02-20 | 13F | Sunbelt Securities, Inc. | 35 | 0,00 | 0 | |||||
| 2026-02-05 | 13F | Amalgamated Bank | 1.298 | -2,26 | 0 | |||||
| 2026-02-17 | 13F | Jones Financial Companies Lllp | 251 | 0,80 | 2 | 0,00 | ||||
| 2026-02-17 | 13F | Two Sigma Investments, Lp | 60.360 | -65,44 | 502 | -80,32 | ||||
| 2026-02-13 | 13F | Rhumbline Advisers | 48.871 | -15,71 | 406 | -51,95 | ||||
| 2026-02-17 | 13F | Balyasny Asset Management Llc | 37.977 | -61,22 | 316 | -77,93 | ||||
| 2026-02-09 | 13F | Legal & General Group Plc | 1.577.927 | -1,93 | 13.113 | -44,10 | ||||
| 2026-02-13 | 13F | Morgan Stanley | 766.487 | 138,99 | 6.370 | 36,21 | ||||
| 2025-11-14 | 13F | Susquehanna Fundamental Investments, Llc | 0 | -100,00 | 0 | -100,00 | ||||
| 2026-02-17 | 13F | Signature Equity Partners, LLC | 29 | 0 | ||||||
| 2026-02-17 | 13F | Jump Financial, LLC | 0 | -100,00 | 0 | |||||
| 2026-02-11 | 13F | Deutsche Bank Ag\ | 35.689 | 3,50 | 297 | -41,04 | ||||
| 2026-02-18 | 13F | Garton & Associates Financial Advisors LLC | 75 | 1 | ||||||
| 2026-02-12 | 13F | Ensign Peak Advisors, Inc | 330.323 | -1,42 | 2.745 | -43,83 | ||||
| 2026-02-11 | 13F | Group One Trading, L.p. | 14.459 | 137,66 | 120 | 36,36 | ||||
| 2026-02-03 | 13F | Mitsubishi UFJ Kokusai Asset Management Co., Ltd. | 30.727 | 3,79 | 267 | -38,05 | ||||
| 2026-01-21 | 13F | Newbridge Financial Services Group, Inc. | 0 | -100,00 | 0 | |||||
| 2026-02-17 | 13F | California State Teachers Retirement System | 36.146 | 0,32 | 300 | -42,86 | ||||
| 2026-02-17 | 13F | Susquehanna International Group, Llp | 100.996 | -57,40 | 839 | -75,72 | ||||
| 2025-11-14 | 13F | Citadel Advisors Llc | 0 | -100,00 | 0 | -100,00 | ||||
| 2026-02-17 | 13F | Citadel Advisors Llc | Put | 71.630 | 60,11 | 595 | -8,74 | |||
| 2026-02-17 | 13F | Advisory Services Network, LLC | 0 | -100,00 | 0 | |||||
| 2026-02-17 | 13F | Citadel Advisors Llc | Call | 137.000 | -32,96 | 1.138 | -61,80 | |||
| 2026-02-17 | 13F | Susquehanna International Group, Llp | Put | 96.100 | -66,33 | 799 | -80,82 | |||
| 2026-02-17 | 13F | Susquehanna Portfolio Strategies, LLC | 77.202 | -29,16 | 642 | -59,63 | ||||
| 2026-02-13 | 13F | Public Employees Retirement Association Of Colorado | 2.928 | 0,00 | 0 | |||||
| 2026-02-17 | 13F | Susquehanna International Group, Llp | Call | 254.300 | -30,77 | 2.113 | -60,54 | |||
| 2026-01-26 | 13F | Cwm, Llc | 10.304 | -5,89 | 0 |