Grundlæggende statistik
| Institutionelle aktier (lange) | 102.828.750 - 62,31% (ex 13D/G) - change of 8,46MM shares 8,97% MRQ |
| Institutionel værdi (lang) | $ 1.155.677 USD ($1000) |
Institutionelt ejerskab og aktionærer
DLocal Limited (US:DLO) har 151 institutionelle ejere og aktionærer, der har indsendt 13D/G- eller 13F-formularer til Securities Exchange Commission (SEC). Disse institutioner har i alt 102,828,750 aktier. Største aktionærer omfatter General Atlantic Llc, Bank Of America Corp /de/, Ribbit Management Company, LLC, Baillie Gifford & Co, Marshall Wace, Llp, Jane Street Group, Llc, Jane Street Group, Llc, Fourth Sail Capital LP, Jane Street Group, Llc, and Morgan Stanley .
DLocal Limited (NasdaqGS:DLO) institutionel ejerskabsstruktur viser aktuelle positioner i virksomheden efter institutioner og fonde, samt seneste ændringer i positionsstørrelse. Større aktionærer kan omfatte individuelle investorer, investeringsforeninger, hedgefonde eller institutioner. Skema 13D angiver, at investoren besidder (eller besidder) mere end 5 % af virksomheden og har til hensigt (eller har til hensigt at) aktivt at forfølge en ændring i forretningsstrategi. Skema 13G indikerer en passiv investering på over 5%.
The share price as of September 8, 2025 is 13,36 / share. Previously, on September 9, 2024, the share price was 8,30 / share. This represents an increase of 60,96% over that period.

Fondens stemningsscore
Fund Sentiment Score (fka Ownership Accumulation Score) finder de aktier, der bliver mest købt af fonde. Det er resultatet af en sofistikeret, multi-faktor kvantitativ model, der identificerer virksomheder med de højeste niveauer af institutionel akkumulering. Scoringsmodellen bruger en kombination af den samlede stigning i oplyste ejere, ændringerne i porteføljeallokeringer i disse ejere og andre målinger. Tallet går fra 0 til 100, hvor højere tal indikerer et højere niveau af akkumulering for sine jævnaldrende, og 50 er gennemsnittet.
Opdateringsfrekvens: Dagligt
Se Ownership Explorer, som giver en liste over højest rangerende virksomheder.
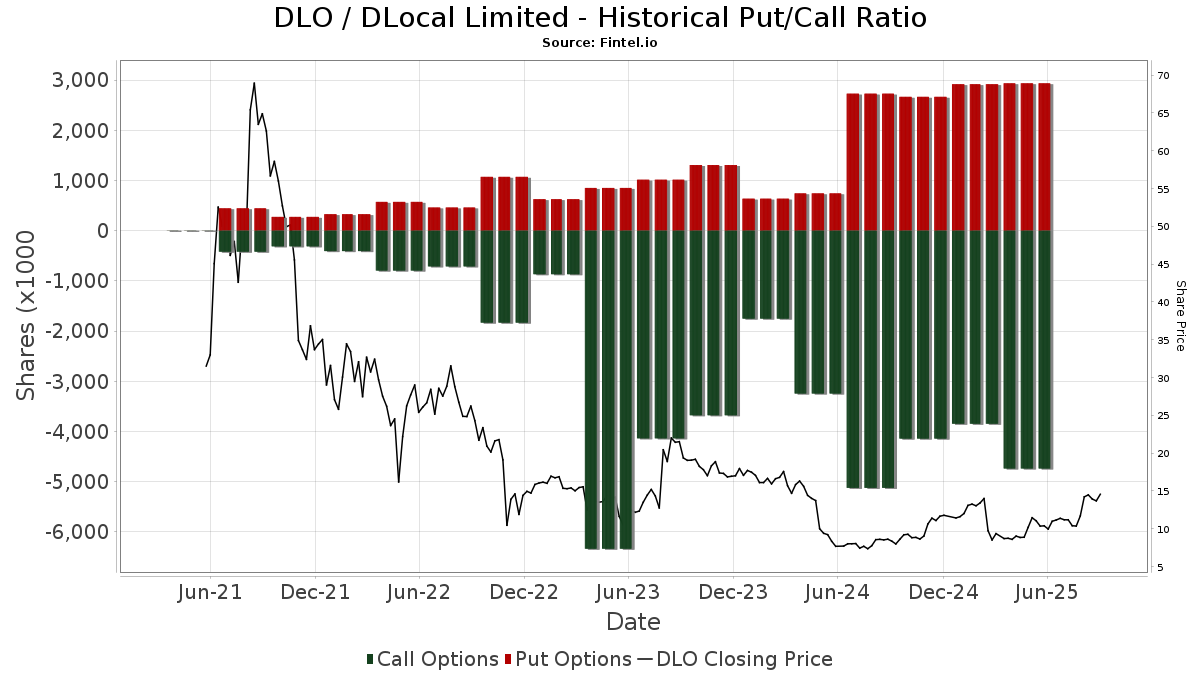
Institutionel Put/Call-forhold
Ud over at indberette standardaktie- og gældsudstedelser skal institutter med mere end 100 mill. aktiver under forvaltning også oplyse deres put- og call-optionsbeholdninger. Da salgsoptioner generelt indikerer negativ stemning, og købsoptioner indikerer positiv stemning, kan vi få en fornemmelse af den overordnede institutionelle stemning ved at plotte forholdet mellem put og kald. Diagrammet til højre viser det historiske put/call-forhold for dette instrument.
Brug af Put/Call Ratio som en indikator for investorernes stemning overvinder en af de vigtigste mangler ved at bruge totalt institutionelt ejerskab, som er, at en betydelig mængde af aktiver under forvaltning investeres passivt for at spore indekser. Passivt forvaltede fonde køber typisk ikke optioner, så indikatoren for put/call-forholdet følger mere nøje følelsen af aktivt forvaltede fonde.
13D/G-arkivering
Vi præsenterer 13D/G ansøgninger separat fra 13F ansøgninger på grund af den forskellige behandling af SEC. 13D/G-ansøgninger kan indgives af grupper af investorer (med én ledende), hvorimod 13F-ansøgninger ikke kan. Dette resulterer i situationer, hvor en investor kan indsende en 13D/G, der rapporterer én værdi for de samlede aktier (der repræsenterer alle de aktier, der ejes af investorgruppen), men derefter indsender en 13F, der rapporterer en anden værdi for de samlede aktier (der udelukkende repræsenterer deres egne) ejendomsret). Det betyder, at aktieejerskab af 13D/G-arkiver og 13F-arkiveringer ofte ikke er direkte sammenlignelige, så vi præsenterer dem separat.
Bemærk: Fra den 16. maj 2021 viser vi ikke længere ejere, der ikke har indsendt en 13D/G inden for det seneste år. Tidligere viste vi den fulde historie af 13D/G-arkiver. Generelt skal enheder, der er forpligtet til at indgive 13D/G-ansøgninger, indgive mindst årligt, før de indsender en afsluttende ansøgning. Dog forlader fonde nogle gange positioner uden at indsende en afsluttende ansøgning (dvs. de afvikler), så visning af den fulde historie resulterede nogle gange i forvirring om det nuværende ejerskab. For at undgå forvirring viser vi nu kun 'aktuelle' ejere - det vil sige - ejere, der har anmeldt inden for det seneste år.
Upgrade to unlock premium data.
| Fil dato | Form | Investor | Forrige Aktier |
Seneste Aktier |
Δ Aktier (Procent) |
Ejendomsret (Procent) |
Δ Ejerskab (Procent) |
|
|---|---|---|---|---|---|---|---|---|
| 2025-02-14 | Fogel Kaplan Sergio Enrique | 50,893,599 | 50,893,599 | 0.00 | 25.40 | 4.96 | ||
| 2025-02-14 | Fernandez Balague Emiliano Sebastian | 14,603,576 | 16,346,624 | 11.94 | 10.80 | 20.00 | ||
| 2024-11-12 | FMR LLC | 9,542,170 | 95,435 | -99.00 | 0.06 | -99.05 |
13F og NPORT arkivering
Detaljer om 13F-arkivering er gratis. Detaljer om NP-ansøgninger kræver et premium-medlemskab. Grønne rækker angiver nye positioner. Røde rækker angiver lukkede positioner. Klik på linket ikon for at se den fulde transaktionshistorik.
Opgrader
for at låse premium-data op og eksportere til Excel ![]() .
.
| Fil dato | Kilde | Investor | Type | Gennemsnitlig pris (Øst) |
Aktier | Δ Aktier (%) |
Rapporteret Værdi ($1000) |
Δ Værdi (%) |
Port Alloc (%) |
|
|---|---|---|---|---|---|---|---|---|---|---|
| 2025-08-07 | 13F | Mitsubishi UFJ Kokusai Asset Management Co., Ltd. | 23.956 | 1,26 | 272 | 37,56 | ||||
| 2025-08-14 | 13F | Bnp Paribas Arbitrage, Sa | 394.793 | 9,71 | 4.477 | 49,15 | ||||
| 2025-08-14 | 13F | Verition Fund Management LLC | 47.871 | 42,19 | 543 | 93,57 | ||||
| 2025-05-15 | 13F | Barclays Plc | 0 | -100,00 | 0 | |||||
| 2025-08-12 | 13F | Legal & General Group Plc | 18.317 | -7,21 | 208 | 26,22 | ||||
| 2025-08-13 | 13F | National Bank Of Canada /fi/ | 0 | -100,00 | 0 | |||||
| 2025-05-15 | 13F | Alliancebernstein L.p. | 0 | -100,00 | 0 | |||||
| 2025-08-13 | 13F | EverSource Wealth Advisors, LLC | 0 | -100,00 | 0 | |||||
| 2025-08-12 | 13F | Jefferies Financial Group Inc. | 137.691 | 1.561 | ||||||
| 2025-05-15 | 13F | Mirabella Financial Services Llp | 0 | -100,00 | 0 | |||||
| 2025-08-12 | 13F | Insigneo Advisory Services, Llc | 16.011 | 182 | ||||||
| 2025-08-14 | 13F | Holocene Advisors, LP | 491.680 | -11,73 | 5.576 | 20,02 | ||||
| 2025-08-14 | 13F | Fieldview Capital Management, LLC | 17.108 | 194 | ||||||
| 2025-08-11 | 13F | Citigroup Inc | 4.315 | 4,43 | 49 | 41,18 | ||||
| 2025-08-18 | 13F | Wolverine Trading, Llc | Call | 136.700 | 1.569 | |||||
| 2025-08-18 | 13F | Wolverine Trading, Llc | Put | 17.100 | 196 | |||||
| 2025-08-18 | 13F | Wolverine Trading, Llc | 17.783 | 204 | ||||||
| 2025-07-09 | 13F | Northwest & Ethical Investments L.P. | 0 | -100,00 | 0 | -100,00 | ||||
| 2025-08-08 | 13F | Geode Capital Management, Llc | 142.677 | 0,80 | 1.618 | 37,03 | ||||
| 2025-08-14 | 13F | Goldman Sachs Group Inc | 378.090 | -34,26 | 4.288 | -10,61 | ||||
| 2025-08-26 | NP | NORTHERN FUNDS - NORTHERN SMALL CAP CORE FUND Class K | 36.430 | -5,58 | 413 | 28,66 | ||||
| 2025-08-14 | 13F | Boothbay Fund Management, Llc | 10.768 | 122 | ||||||
| 2025-08-15 | 13F | Tower Research Capital LLC (TRC) | 3.228 | 225,08 | 37 | 350,00 | ||||
| 2025-08-14 | 13F | Peak6 Llc | Put | 107.500 | 0,00 | 1.219 | 36,05 | |||
| 2025-08-14 | 13F | Peak6 Llc | Call | 332.600 | 2,84 | 3.772 | 39,82 | |||
| 2025-07-24 | NP | ONEQ - Fidelity Nasdaq Composite Index Tracking Stock This fund is a listed as child fund of Fmr Llc and if that institution has disclosed ownership in this security, then these positions will not be double counted when calculating total shares and total value | 57.194 | 0,49 | 621 | 14,36 | ||||
| 2025-08-14 | 13F | Millennium Management Llc | Put | 0 | -100,00 | 0 | ||||
| 2025-08-14 | 13F | Axa S.a. | 82.270 | 933 | ||||||
| 2025-08-14 | 13F | Alkeon Capital Management Llc | 823.837 | 0,00 | 9.342 | 35,98 | ||||
| 2025-05-14 | 13F | Walleye Trading LLC | 0 | -100,00 | 0 | -100,00 | ||||
| 2025-08-28 | NP | KEMQ - KraneShares Emerging Markets Consumer Technology Index ETF | 17.145 | -10,47 | 194 | 22,01 | ||||
| 2025-08-19 | 13F | State of Wyoming | 27.116 | 45,12 | 307 | 98,06 | ||||
| 2025-08-14 | 13F | Bayesian Capital Management, LP | 25.106 | 285 | ||||||
| 2025-07-30 | 13F | FNY Investment Advisers, LLC | 936 | 0 | ||||||
| 2025-09-04 | 13F/A | Advisor Group Holdings, Inc. | 9.108 | 17,08 | 103 | 60,94 | ||||
| 2025-07-31 | 13F | R Squared Ltd | 11.176 | 127 | ||||||
| 2025-08-14 | 13F | Vident Advisory, LLC | 24.195 | 48,71 | 274 | 102,96 | ||||
| 2025-08-11 | 13F | Empowered Funds, LLC | 0 | -100,00 | 0 | |||||
| 2025-05-13 | 13F | Marcho Partners LLP | 0 | -100,00 | 0 | |||||
| 2025-08-28 | NP | GHTA - Goose Hollow Tactical Allocation ETF | 64.964 | 737 | ||||||
| 2025-05-13 | 13F | Marcho Partners LLP | Call | 0 | -100,00 | 0 | ||||
| 2025-08-04 | 13F | Yorktown Management & Research Co Inc | 41.500 | 0,00 | 471 | 35,84 | ||||
| 2025-08-14 | 13F | Fmr Llc | 0 | -100,00 | 0 | |||||
| 2025-08-14 | 13F | Two Sigma Advisers, Lp | 353.107 | -50,06 | 4.004 | -32,10 | ||||
| 2025-07-29 | 13F | Activest Wealth Management | 7.067 | 80 | ||||||
| 2025-05-05 | 13F | Migdal Insurance & Financial Holdings Ltd. | 0 | -100,00 | 0 | |||||
| 2025-08-14 | 13F | Millennium Management Llc | Call | 0 | -100,00 | 0 | ||||
| 2025-08-14 | 13F | Ameriprise Financial Inc | 563.990 | 6,88 | 6.396 | 45,34 | ||||
| 2025-08-01 | 13F | Lane Generational LLC | 525.530 | 0,00 | 5.960 | 35,99 | ||||
| 2025-08-13 | 13F | PharVision Advisers, LLC | 20.984 | 238 | ||||||
| 2025-08-14 | 13F | Millennium Management Llc | 866.818 | 53,98 | 9.830 | 109,39 | ||||
| 2025-08-14 | 13F | Hrt Financial Lp | 314.265 | 237,23 | 4 | |||||
| 2025-05-14 | 13F | Stifel Financial Corp | 0 | -100,00 | 0 | |||||
| 2025-08-14 | 13F/A | Skopos Labs, Inc. | 836 | 9 | ||||||
| 2025-08-14 | 13F | Voloridge Investment Management, Llc | 45.553 | -84,67 | 517 | -79,18 | ||||
| 2025-05-29 | NP | MFMIX - Frontier Markets Portfolio Class I | 0 | -100,00 | 0 | -100,00 | ||||
| 2025-08-12 | 13F | Clear Street Markets Llc | 0 | -100,00 | 0 | |||||
| 2025-08-14 | 13F | PDT Partners, LLC | 332.739 | -1,03 | 3.773 | 34,61 | ||||
| 2025-08-12 | 13F | Jpmorgan Chase & Co | 12.180 | -87,50 | 138 | -83,00 | ||||
| 2025-08-12 | 13F | Main Management ETF Advisors, LLC | 146.579 | 1,66 | 2 | 0,00 | ||||
| 2025-08-14 | 13F | Caption Management, LLC | 131.249 | 1.066,76 | 1.488 | 1.500,00 | ||||
| 2025-07-31 | 13F | Caitong International Asset Management Co., Ltd | 736 | 65,39 | 8 | 166,67 | ||||
| 2025-08-12 | 13F | Deutsche Bank Ag\ | 0 | -100,00 | 0 | |||||
| 2025-08-13 | 13F | Polen Capital Management Llc | 605.885 | -3,45 | 6.871 | 31,28 | ||||
| 2025-05-06 | 13F | Y-Intercept (Hong Kong) Ltd | 0 | -100,00 | 0 | |||||
| 2025-08-14 | 13F | Wells Fargo & Company/mn | 2.455 | 439,56 | 28 | 800,00 | ||||
| 2025-07-25 | 13F | Gw Henssler & Associates Ltd | 15.873 | 0,00 | 180 | 36,36 | ||||
| 2025-08-15 | 13F | Morgan Stanley | 1.121.067 | 2,64 | 12.713 | 39,57 | ||||
| 2025-06-25 | NP | BKSE - BNY Mellon US Small Cap Core Equity ETF | 3.377 | -27,66 | 30 | -52,46 | ||||
| 2025-08-27 | NP | PCEM - Polen Capital Emerging Markets ex-China Growth ETF | 8.738 | 0,00 | 99 | 37,50 | ||||
| 2025-06-27 | NP | PNQI - Invesco NASDAQ Internet ETF This fund is a listed as child fund of Invesco Ltd. and if that institution has disclosed ownership in this security, then these positions will not be double counted when calculating total shares and total value | 32.880 | -7,88 | 291 | -38,43 | ||||
| 2025-08-07 | 13F | Fourth Sail Capital LP | 1.546.639 | 33,75 | 17.539 | 81,85 | ||||
| 2025-07-25 | 13F | Cwm, Llc | 10.000 | 0 | ||||||
| 2025-08-13 | 13F | Corsair Capital Management, L.p. | 30.000 | 340 | ||||||
| 2025-08-14 | 13F | Sunbelt Securities, Inc. | 0 | -100,00 | 0 | |||||
| 2025-08-14 | 13F | SummitTX Capital, L.P. | 0 | -100,00 | 0 | |||||
| 2025-07-24 | NP | FNCMX - Fidelity Nasdaq Composite Index Fund This fund is a listed as child fund of Fmr Llc and if that institution has disclosed ownership in this security, then these positions will not be double counted when calculating total shares and total value | 85.025 | 0,00 | 923 | 13,67 | ||||
| 2025-08-28 | NP | KOMP - SPDR S&P Kensho New Economies Composite ETF This fund is a listed as child fund of State Street Corp and if that institution has disclosed ownership in this security, then these positions will not be double counted when calculating total shares and total value | 169.663 | -68,90 | 1.924 | -57,73 | ||||
| 2025-08-12 | 13F | Proequities, Inc. | 0 | 0 | ||||||
| 2025-05-15 | 13F/A | Clear Street Llc | Put | 0 | -100,00 | 0 | -100,00 | |||
| 2025-08-08 | 13F | Pnc Financial Services Group, Inc. | 15 | -75,41 | 0 | |||||
| 2025-08-14 | 13F | Jane Street Group, Llc | Put | 1.762.900 | 0,11 | 19.991 | 36,12 | |||
| 2025-08-14 | 13F | Jane Street Group, Llc | Call | 1.860.400 | 5,14 | 21.097 | 42,97 | |||
| 2025-08-13 | 13F | Renaissance Technologies Llc | 526.000 | 62,34 | 5.965 | 120,73 | ||||
| 2025-08-13 | 13F | ExodusPoint Capital Management, LP | 20.917 | 0 | ||||||
| 2025-08-14 | 13F | Jane Street Group, Llc | 1.230.623 | 11,24 | 13.955 | 51,26 | ||||
| 2025-08-14 | 13F | Petrus Trust Company, LTA | 24.766 | 281 | ||||||
| 2025-08-14 | 13F | State Street Corp | 169.263 | -68,97 | 1.919 | -57,81 | ||||
| 2025-08-13 | 13F | Russell Investments Group, Ltd. | 53 | 0,00 | 1 | |||||
| 2025-08-13 | 13F | Marshall Wace, Llp | 2.683.988 | 64,03 | 30.436 | 123,04 | ||||
| 2025-08-14 | 13F | Two Sigma Investments, Lp | 747.799 | -25,87 | 8.480 | 0,80 | ||||
| 2025-07-22 | 13F | IMC-Chicago, LLC | 125.838 | 245,10 | 1.427 | 369,41 | ||||
| 2025-08-14 | 13F | Wiley Bros.-aintree Capital, Llc | 35.181 | 399 | ||||||
| 2025-08-28 | NP | Amplify ETF Trust - Amplify Mobile Payments ETF | 112.436 | -5,32 | 1.275 | 28,79 | ||||
| 2025-08-12 | 13F | Proem Advisors LLC | 313.298 | 3.553 | ||||||
| 2025-08-14 | 13F | J. Goldman & Co LP | 1.014.813 | 11.508 | ||||||
| 2025-08-11 | 13F | Absolute Gestao de Investimentos Ltda. | 45.045 | 511 | ||||||
| 2025-08-26 | NP | GAFCX - Virtus AlphaSimplex Global Alternatives Fund Class C | 7.826 | 3,55 | 89 | 39,68 | ||||
| 2025-07-21 | 13F | Mirae Asset Global Investments Co., Ltd. | 486 | -88,01 | 6 | |||||
| 2025-08-14 | 13F | Parvin Asset Management, LLC | 4.900 | 0,00 | 56 | 37,50 | ||||
| 2025-08-13 | 13F | Jones Financial Companies Lllp | 1.500 | 2.900,00 | 17 | |||||
| 2025-08-08 | 13F | SG Americas Securities, LLC | 23.384 | -20,96 | 0 | |||||
| 2025-08-14 | 13F | J. Goldman & Co LP | Call | 1.000.000 | 11.340 | |||||
| 2025-08-14 | 13F | Price T Rowe Associates Inc /md/ | 0 | -100,00 | 0 | |||||
| 2025-08-14 | 13F | Man Group plc | 11.472 | 130 | ||||||
| 2025-08-12 | 13F | Virtu Financial LLC | 38.536 | 0,70 | 0 | |||||
| 2025-07-10 | 13F | Exchange Traded Concepts, Llc | 24.213 | 275 | ||||||
| 2025-06-27 | NP | TMAT - Main Thematic Innovation ETF | 144.589 | 1,40 | 1.280 | -32,04 | ||||
| 2025-08-12 | 13F | Advisors Asset Management, Inc. | 951 | -8,91 | 11 | 25,00 | ||||
| 2025-08-14 | 13F | GWM Advisors LLC | 945 | 0,00 | 11 | 42,86 | ||||
| 2025-08-28 | NP | DODEX - Dodge & Cox Emerging Markets Stock Fund | 34.500 | -17,07 | 391 | 13,01 | ||||
| 2025-08-13 | 13F | Invesco Ltd. | 35.987 | -22,40 | 408 | 5,70 | ||||
| 2025-07-24 | 13F | PayPay Securities Corp | 30 | -25,00 | 0 | |||||
| 2025-08-14 | 13F | Citadel Advisors Llc | 359.657 | -42,22 | 4.079 | -21,43 | ||||
| 2025-08-14 | 13F | Citadel Advisors Llc | Call | 423.300 | 0,24 | 4.800 | 36,32 | |||
| 2025-08-13 | 13F | Quantbot Technologies LP | 22.407 | 254 | ||||||
| 2025-08-14 | 13F | Citadel Advisors Llc | Put | 215.700 | 5,89 | 2.446 | 44,05 | |||
| 2025-08-27 | 13F/A | Squarepoint Ops LLC | Call | 20.600 | -68,98 | 234 | -57,87 | |||
| 2025-08-27 | 13F/A | Squarepoint Ops LLC | 73.160 | 830 | ||||||
| 2025-08-14 | 13F | Parallax Volatility Advisers, L.P. | Put | 20.000 | 0,00 | 227 | 36,14 | |||
| 2025-04-22 | NP | GINN - Goldman Sachs Innovate Equity ETF | 23.509 | -24,55 | 225 | -37,08 | ||||
| 2025-08-14 | 13F | Royal Bank Of Canada | 9.855 | -79,75 | 112 | -72,41 | ||||
| 2025-05-15 | 13F/A | Clear Street Llc | 0 | -100,00 | 0 | -100,00 | ||||
| 2025-07-28 | 13F | Harbour Investments, Inc. | 1.000 | 0,00 | 11 | 37,50 | ||||
| 2025-08-11 | 13F | Vanguard Group Inc | 69.848 | -17,12 | 792 | 12,82 | ||||
| 2025-08-14 | 13F | Point72 (DIFC) Ltd | 2.600 | 29 | ||||||
| 2025-08-14 | 13F | Parallax Volatility Advisers, L.P. | Call | 40.000 | 0,00 | 454 | 36,04 | |||
| 2025-08-14 | 13F | MIRAE ASSET GLOBAL ETFS HOLDINGS Ltd. | 102.121 | -3,48 | 1.159 | 31,29 | ||||
| 2025-08-12 | 13F | BlackRock, Inc. | 151.403 | -46,80 | 1.717 | -27,69 | ||||
| 2025-08-14 | 13F | Susquehanna Portfolio Strategies, LLC | 17.700 | 201 | ||||||
| 2025-05-15 | 13F | Hidden Lake Asset Management LP | 0 | -100,00 | 0 | |||||
| 2025-08-14 | 13F | Bank Of America Corp /de/ | Call | 49.700 | 0,00 | 564 | 35,99 | |||
| 2025-08-13 | 13F | Walleye Capital LLC | 70.822 | 50.128,37 | 803 | 80.200,00 | ||||
| 2025-08-14 | 13F | Mariner, LLC | 18.606 | -22,74 | 211 | 5,00 | ||||
| 2025-08-13 | 13F | Walleye Capital LLC | Put | 3.000 | -41,18 | 34 | -19,05 | |||
| 2025-08-14 | 13F | Raymond James Financial Inc | 62.951 | 714 | ||||||
| 2025-08-06 | 13F | Baillie Gifford & Co | 2.699.607 | 3,73 | 30.614 | 41,04 | ||||
| 2025-08-14 | 13F | Lazard Asset Management Llc | 3.823 | 0 | ||||||
| 2025-08-14 | 13F | Bank Of America Corp /de/ | 7.335.958 | 3.174,08 | 83.190 | 4.353,37 | ||||
| 2025-06-30 | NP | APITX - Yorktown Growth Fund Class L Shares | 41.500 | 0,00 | 367 | -32,91 | ||||
| 2025-08-14 | 13F | Winton Capital Group Ltd | 25.665 | 291 | ||||||
| 2025-08-06 | 13F | Stone House Investment Management, LLC | 1.000 | 0,00 | 11 | 37,50 | ||||
| 2025-05-05 | 13F | Creekmur Asset Management LLC | 0 | -100,00 | 0 | |||||
| 2025-08-06 | 13F | Penserra Capital Management LLC | 112.436 | -5,32 | 1 | |||||
| 2025-08-08 | 13F | Larson Financial Group LLC | 218 | 26,74 | 2 | 100,00 | ||||
| 2025-08-14 | 13F | Federation des caisses Desjardins du Quebec | 7.400 | 0,00 | 84 | 36,07 | ||||
| 2025-08-11 | 13F | Krane Funds Advisors LLC | 17.145 | -10,47 | 194 | 22,01 | ||||
| 2025-08-14 | 13F | Point72 Hong Kong Ltd | 23.300 | 264 | ||||||
| 2025-08-08 | 13F | SBI Securities Co., Ltd. | 17.146 | -1,66 | 194 | 33,79 | ||||
| 2025-04-25 | 13F | New Wave Wealth Advisors Llc | 0 | -100,00 | 0 | |||||
| 2025-06-30 | NP | VT - Vanguard Total World Stock Index Fund ETF Shares | 51.770 | 0,00 | 458 | -32,94 | ||||
| 2025-05-05 | 13F | IFP Advisors, Inc | 0 | -100,00 | 0 | |||||
| 2025-07-30 | NP | HEQFX - Monteagle Opportunity Equity Fund Investor Class | 10.648 | 0,00 | 116 | 13,86 | ||||
| 2025-06-27 | 13F/A | Goldman Sachs Group Inc | Put | 0 | -100,00 | 0 | -100,00 | |||
| 2025-05-16 | 13F | Bell Investment Advisors, Inc | 0 | -100,00 | 0 | |||||
| 2025-05-14 | 13F/A | Norges Bank | 194.769 | -30,13 | 2.863 | -41,94 | ||||
| 2025-08-26 | NP | FTKI - First Trust Small Cap BuyWrite Income ETF | 0 | -100,00 | 0 | -100,00 | ||||
| 2025-08-14 | 13F | Group One Trading, L.p. | 26.888 | 305 | ||||||
| 2025-08-14 | 13F | Susquehanna International Group, Llp | Put | 782.600 | 0,68 | 8.875 | 36,90 | |||
| 2025-08-14 | 13F | Susquehanna International Group, Llp | 825.805 | 14,03 | 9.365 | 55,06 | ||||
| 2025-08-14 | 13F | Tudor Investment Corp Et Al | 18.061 | -41,13 | 205 | -20,00 | ||||
| 2025-08-14 | 13F | Susquehanna International Group, Llp | Call | 703.800 | -28,71 | 7.981 | -3,06 | |||
| 2025-08-07 | 13F | Parkside Financial Bank & Trust | 35 | 0,00 | 0 | |||||
| 2025-06-30 | NP | TRFM - AAM Transformers ETF | 16.270 | 1,47 | 144 | -32,23 | ||||
| 2025-08-14 | 13F | Balyasny Asset Management Llc | 437.145 | 405,04 | 4.957 | 587,52 | ||||
| 2025-05-29 | NP | CPAEX - Counterpoint Tactical Equity Fund Class A Shares | 41.525 | -28,26 | 346 | -25,27 | ||||
| 2025-08-18 | 13F/A | Kestra Investment Management, LLC | 120 | 1,69 | 1 | |||||
| 2025-05-15 | 13F | Canada Pension Plan Investment Board | 0 | -100,00 | 0 | -100,00 | ||||
| 2025-05-15 | 13F | Tairen Capital Ltd | 0 | -100,00 | 0 | |||||
| 2025-08-14 | 13F | UBS Group AG | 216.718 | 88,01 | 2.458 | 155,67 | ||||
| 2025-08-11 | 13F | Y.D. More Investments Ltd | 1.383 | 84,40 | 16 | 50,00 | ||||
| 2025-08-12 | 13F | Trexquant Investment LP | 0 | -100,00 | 0 | |||||
| 2025-08-13 | 13F | Walleye Capital LLC | Call | 0 | -100,00 | 0 | -100,00 | |||
| 2025-08-06 | 13F | Fox Run Management, L.l.c. | 47.325 | 61,25 | 537 | 119,67 | ||||
| 2025-07-14 | 13F | Ridgewood Investments LLC | 3.796 | 0,00 | 43 | 38,71 | ||||
| 2025-08-11 | 13F | TD Waterhouse Canada Inc. | 0 | -100,00 | 0 | |||||
| 2025-08-14 | 13F | TB Capital Gestao de Recursos Ltda. | 641.185 | 7.271 | ||||||
| 2025-06-30 | NP | PRFZ - Invesco FTSE RAFI US 1500 Small-Mid ETF This fund is a listed as child fund of Invesco Ltd. and if that institution has disclosed ownership in this security, then these positions will not be double counted when calculating total shares and total value | 12.391 | -31,35 | 110 | -54,20 | ||||
| 2025-08-14 | 13F | D. E. Shaw & Co., Inc. | 274.175 | 3.109 | ||||||
| 2025-08-05 | 13F | Simplex Trading, Llc | 58.025 | 1 | ||||||
| 2025-08-14 | 13F | General Atlantic Llc | 63.906.695 | 0,00 | 724.702 | 35,97 | ||||
| 2025-08-14 | 13F | Tikvah Management LLC | 1.054.499 | 0,00 | 11.958 | 35,98 | ||||
| 2025-08-14 | 13F | Point72 Asia (Singapore) Pte. Ltd. | 2.508 | 28 | ||||||
| 2025-05-14 | 13F | Peak6 Llc | 0 | -100,00 | 0 | -100,00 | ||||
| 2025-08-13 | 13F | Bond Capital Management, LP | 927.500 | 0,00 | 10.518 | 35,97 | ||||
| 2025-08-14 | 13F | Cubist Systematic Strategies, LLC | 449.106 | 5.093 | ||||||
| 2025-08-14 | 13F | Ribbit Management Company, LLC | 3.891.900 | 0,00 | 44.134 | 35,97 | ||||
| 2025-08-13 | 13F | Northern Trust Corp | 119.825 | -2,18 | 1.359 | 33,01 | ||||
| 2025-07-29 | NP | ESGV - Vanguard ESG U.S. Stock ETF ETF Shares | 18.958 | 5,50 | 206 | 19,88 | ||||
| 2025-04-25 | NP | FDFF - Fidelity Disruptive Finance ETF | 92.793 | 8,03 | 887 | -9,78 | ||||
| 2025-08-14 | 13F | Engineers Gate Manager LP | 11.685 | -77,74 | 133 | -69,79 | ||||
| 2025-08-13 | 13F | Centiva Capital, LP | 0 | -100,00 | 0 | |||||
| 2025-07-30 | NP | FINX - Global X FinTech ETF This fund is a listed as child fund of Mirae Asset Global Investments Co., Ltd. and if that institution has disclosed ownership in this security, then these positions will not be double counted when calculating total shares and total value | 95.576 | -23,06 | 1.038 | -12,56 | ||||
| 2025-05-15 | 13F | Crestline Management, LP | 0 | -100,00 | 0 | |||||
| 2025-08-14 | 13F | Point72 Asset Management, L.P. | 191.800 | 2.175 | ||||||
| 2025-07-22 | 13F | Gsa Capital Partners Llp | 157.391 | 391,63 | 2 | |||||
| 2025-08-14 | 13F | Azora Capital LP | 0 | -100,00 | 0 | |||||
| 2025-06-25 | NP | PGEIX - Polen Global Emerging Markets Growth Fund Institutional Class | 40.773 | -15,95 | 361 | -43,75 | ||||
| 2025-08-13 | 13F | Walleye Trading LLC | Call | 172.400 | 115,77 | 1.955 | 193,54 | |||
| 2025-08-14 | 13F | Quarry LP | 6.929 | 76,81 | 79 | 151,61 | ||||
| 2025-08-13 | 13F | Walleye Trading LLC | Put | 30.600 | 2,00 | 347 | 38,80 | |||
| 2025-08-04 | 13F | Quaker Wealth Management, LLC | Put | 0 | -100,00 | 0 | ||||
| 2025-08-14 | 13F | Summit Trail Advisors, Llc | 940.820 | 0,00 | 10.669 | 35,97 | ||||
| 2025-08-13 | 13F | Dodge & Cox | 36.700 | -18,26 | 416 | 11,23 | ||||
| 2025-07-14 | 13F | GAMMA Investing LLC | 24 | 0,00 | 0 |
Other Listings
| MX:DLO N |