Grundlæggende statistik
| Institutionelle ejere | 108 total, 108 long only, 0 short only, 0 long/short - change of 14,74% MRQ |
| Gennemsnitlig porteføljeallokering | 0.3059 % - change of 11,10% MRQ |
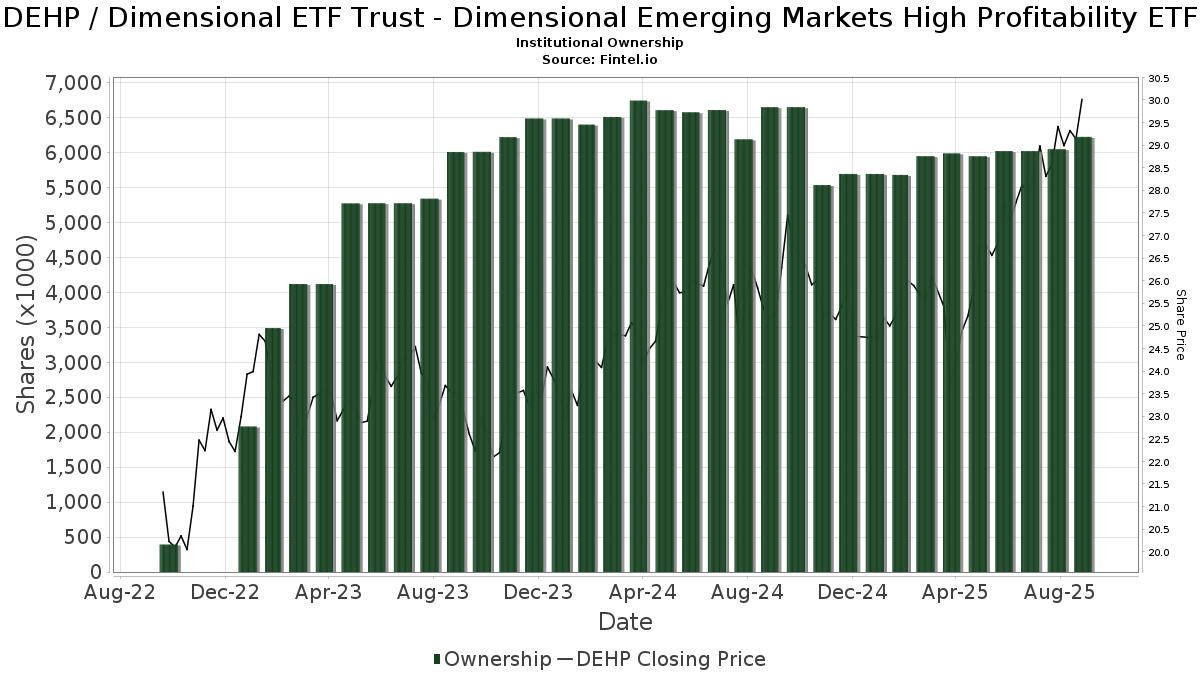
| Institutionelle aktier (lange) | 6.427.114 (ex 13D/G) - change of 0,44MM shares 7,28% MRQ |
| Institutionel værdi (lang) | $ 199.735 USD ($1000) |
Institutionelt ejerskab og aktionærer
Dimensional ETF Trust - Dimensional Emerging Markets High Profitability ETF (US:DEHP) har 108 institutionelle ejere og aktionærer, der har indsendt 13D/G- eller 13F-formularer til Securities Exchange Commission (SEC). Disse institutioner har i alt 6,427,114 aktier. Største aktionærer omfatter Unison Advisors LLC, Three Arch Wealth Management LLC, Beacon Pointe Advisors, LLC, RFG Advisory, LLC, Vestmark Advisory Solutions, Inc., DiNuzzo Private Wealth, Inc., United Wealth Management, LLC, Farther Finance Advisors, LLC, Fortress Wealth Management, Inc., and Envestnet Asset Management Inc .
Dimensional ETF Trust - Dimensional Emerging Markets High Profitability ETF (ARCA:DEHP) institutionel ejerskabsstruktur viser aktuelle positioner i virksomheden efter institutioner og fonde, samt seneste ændringer i positionsstørrelse. Større aktionærer kan omfatte individuelle investorer, investeringsforeninger, hedgefonde eller institutioner. Skema 13D angiver, at investoren besidder (eller besidder) mere end 5 % af virksomheden og har til hensigt (eller har til hensigt at) aktivt at forfølge en ændring i forretningsstrategi. Skema 13G indikerer en passiv investering på over 5%.
The share price as of March 26, 2026 is 33,00 / share. Previously, on March 27, 2025, the share price was 25,81 / share. This represents an increase of 27,86% over that period.
Fondens stemningsscore
Fund Sentiment Score (fka Ownership Accumulation Score) finder de aktier, der bliver mest købt af fonde. Det er resultatet af en sofistikeret, multi-faktor kvantitativ model, der identificerer virksomheder med de højeste niveauer af institutionel akkumulering. Scoringsmodellen bruger en kombination af den samlede stigning i oplyste ejere, ændringerne i porteføljeallokeringer i disse ejere og andre målinger. Tallet går fra 0 til 100, hvor højere tal indikerer et højere niveau af akkumulering for sine jævnaldrende, og 50 er gennemsnittet.
Opdateringsfrekvens: Dagligt
Se Ownership Explorer, som giver en liste over højest rangerende virksomheder.
AI+ Ask Fintel’s AI assistant about Dimensional ETF Trust - Dimensional Emerging Markets High Profitability ETF.
Select a question to share a public post with an AI-crafted answer.
Thinking of good questions…
Institutionel Put/Call-forhold
Ud over at indberette standardaktie- og gældsudstedelser skal institutter med mere end 100 mill. aktiver under forvaltning også oplyse deres put- og call-optionsbeholdninger. Da salgsoptioner generelt indikerer negativ stemning, og købsoptioner indikerer positiv stemning, kan vi få en fornemmelse af den overordnede institutionelle stemning ved at plotte forholdet mellem put og kald. Diagrammet til højre viser det historiske put/call-forhold for dette instrument.
Brug af Put/Call Ratio som en indikator for investorernes stemning overvinder en af de vigtigste mangler ved at bruge totalt institutionelt ejerskab, som er, at en betydelig mængde af aktiver under forvaltning investeres passivt for at spore indekser. Passivt forvaltede fonde køber typisk ikke optioner, så indikatoren for put/call-forholdet følger mere nøje følelsen af aktivt forvaltede fonde.
13F og NPORT arkivering
Detaljer om 13F-arkivering er gratis. Detaljer om NP-ansøgninger kræver et premium-medlemskab. Grønne rækker angiver nye positioner. Røde rækker angiver lukkede positioner. Klik på linket ikon for at se den fulde transaktionshistorik.
Opgrader
for at låse premium-data op og eksportere til Excel ![]() .
.
| Fil dato | Kilde | Investor | Type | Gennemsnitlig pris (Øst) |
Aktier | Δ Aktier (%) |
Rapporteret Værdi ($1000) |
Δ Værdi (%) |
Port Alloc (%) |
|
|---|---|---|---|---|---|---|---|---|---|---|
| 2026-01-20 | 13F | Austin Private Wealth, LLC | 14.117 | 0,50 | 455 | 6,06 | ||||
| 2025-11-04 | 13F | UMA Financial Services, Inc. | 0 | -100,00 | 0 | |||||
| 2026-02-13 | 13F | Three Arch Wealth Management LLC | 583.089 | 18.805 | ||||||
| 2026-02-17 | 13F | Old Mission Capital Llc | 10.149 | 327 | ||||||
| 2026-01-12 | 13F | Sax Wealth Advisors, Llc | 9.570 | 0,00 | 309 | 5,48 | ||||
| 2026-02-12 | 13F | Hm Payson & Co | 33.892 | 0,00 | 1.093 | 5,60 | ||||
| 2026-01-15 | 13F | Brookstone Capital Management | 6.402 | -14,12 | 206 | -9,25 | ||||
| 2026-02-17 | 13F | Envision Financial Planning, LLC | 29.651 | 0,00 | 956 | 5,64 | ||||
| 2026-01-29 | 13F | Approach Retirement Advisors, LLC | 10.479 | 338 | ||||||
| 2026-02-12 | 13F | Jane Street Group, Llc | 0 | -100,00 | 0 | |||||
| 2026-02-04 | 13F | Schubert & Co | 47.691 | 11,97 | 1.538 | 18,31 | ||||
| 2026-02-10 | 13F | Envestnet Asset Management Inc | 152.080 | -0,76 | 4.905 | 4,79 | ||||
| 2026-01-20 | 13F | Signaturefd, Llc | 1.194 | 39 | ||||||
| 2026-01-07 | 13F | Yeomans Consulting Group, Inc. | 58.722 | 1,63 | 1.894 | 6,29 | ||||
| 2026-01-20 | 13F | Savvy Advisors, Inc. | 6.502 | 210 | ||||||
| 2026-02-11 | 13F | Jpmorgan Chase & Co | 59.801 | -2,99 | 1.929 | 2,44 | ||||
| 2026-02-13 | 13F | Pinney & Scofield, Inc. | 24.736 | 52,25 | 798 | 60,69 | ||||
| 2026-01-27 | 13F | Mills Wealth Advisors LLC | 56.972 | 8,66 | 1.837 | 14,74 | ||||
| 2025-10-16 | 13F | Fortress Wealth Management, Inc. | 161.663 | -0,49 | 4.937 | 8,55 | ||||
| 2026-01-16 | 13F | Wealth Advisors Northwest LLC | 92.516 | 8,27 | 2.984 | 14,33 | ||||
| 2026-02-06 | 13F | Tortoise Investment Management, LLC | 43.325 | 4,74 | 1.397 | 10,61 | ||||
| 2026-02-09 | 13F | Rhl Group, Llc | 1.346 | 43 | ||||||
| 2026-02-13 | 13F | Wells Fargo & Company/mn | 256 | 54,22 | 8 | 60,00 | ||||
| 2026-01-16 | 13F | DiNuzzo Private Wealth, Inc. | 217.678 | -7,86 | 7.020 | 1,90 | ||||
| 2026-02-03 | 13F | RFG Advisory, LLC | 286.291 | -0,68 | 9.233 | 4,87 | ||||
| 2026-02-12 | 13F | Steward Partners Investment Advisory, Llc | 400 | 0,00 | 13 | 0,00 | ||||
| 2026-01-26 | 13F | WorthPointe, LLC | 29.574 | 954 | ||||||
| 2026-02-09 | 13F | Integrity Advisory Solutions, LLC | 138.338 | 9,48 | 4.461 | 15,60 | ||||
| 2026-02-10 | 13F | Acorn Wealth Advisors, LLC | 24.970 | 64,24 | 805 | 73,49 | ||||
| 2026-01-23 | 13F | Farther Finance Advisors, LLC | 167.197 | 12.303,34 | 5.392 | 13.051,22 | ||||
| 2026-02-17 | 13F | Citadel Advisors Llc | 12.576 | -74,72 | 406 | -73,34 | ||||
| 2026-02-06 | 13F | Mach-1 Financial Group, Inc. | 0 | -100,00 | 0 | |||||
| 2026-02-12 | 13F | Triumph Capital Management | 361 | 12 | ||||||
| 2026-02-10 | 13F | Ritter Daniher Financial Advisory LLC / DE | 6 | 0,00 | 0 | |||||
| 2026-02-12 | 13F | Principal Securities, Inc. | 0 | -100,00 | 0 | -100,00 | ||||
| 2025-11-13 | 13F | Total Investment Management Inc | 0 | -100,00 | 0 | |||||
| 2026-02-06 | 13F | HighTower Advisors, LLC | 30.428 | 0,00 | 981 | 5,60 | ||||
| 2026-02-03 | 13F | Sequoia Financial Advisors, LLC | 76.643 | -2,82 | 2.472 | 2,62 | ||||
| 2026-02-18 | 13F | Beacon Pointe Advisors, LLC | 370.177 | -0,94 | 11.938 | 4,61 | ||||
| 2026-02-12 | 13F | Cowa, Llc | 11.025 | -0,67 | 356 | 5,03 | ||||
| 2026-02-10 | 13F/A | Northwestern Mutual Wealth Management Co | 179 | 6 | ||||||
| 2026-02-11 | 13F | Arrowroot Family Office, LLC | 8.669 | 0,28 | 280 | 5,68 | ||||
| 2026-02-03 | 13F | Coston, McIsaac & Partners | 115 | 0 | ||||||
| 2026-02-02 | 13F | Millstone Evans Group, LLC | 408 | 12,40 | 13 | 18,18 | ||||
| 2026-02-11 | 13F | LPL Financial LLC | 35.461 | 3,41 | 1.144 | 9,17 | ||||
| 2026-01-14 | 13F | Wealthcare Advisory Partners LLC | 32.656 | 4,39 | 1.053 | 10,26 | ||||
| 2026-02-27 | 13F/A | Retirement Solution Inc. | 0 | -100,00 | 0 | |||||
| 2026-01-12 | 13F | Evanson Asset Management, LLC | 40.839 | 0,02 | 1.317 | 5,61 | ||||
| 2026-02-10 | 13F | Root Financial Partners, LLC | 2.693 | -8,65 | 87 | -4,44 | ||||
| 2026-01-28 | 13F | Pacific Asset Management, LLC | 12.414 | 0,22 | 400 | 5,82 | ||||
| 2026-03-04 | 13F | Rehmann Capital Advisory Group | 13.330 | 2,21 | 430 | 7,79 | ||||
| 2026-02-12 | 13F | von Borstel & Associates, Inc. | 0 | -100,00 | 0 | |||||
| 2026-01-16 | 13F | Meredith Wealth Planning | 103.516 | 3,88 | 3.338 | 9,69 | ||||
| 2025-11-04 | 13F | Jones Financial Companies Lllp | 0 | -100,00 | 0 | |||||
| 2026-02-12 | 13F | Betterment LLC | 58.233 | 0,20 | 2 | 0,00 | ||||
| 2026-01-26 | 13F | AE Wealth Management LLC | 1.844 | 0,16 | 59 | 5,36 | ||||
| 2026-02-10 | 13F | TAGStone Capital, Inc. | 14.263 | 41,12 | 460 | 49,03 | ||||
| 2026-02-06 | 13F | Vestmark Advisory Solutions, Inc. | 230.153 | -0,14 | 7.422 | 5,44 | ||||
| 2026-03-12 | 13F | Nalls Sherbakoff Group, Llc | 3.356 | 69,15 | 108 | 125,00 | ||||
| 2026-02-12 | 13F | Commonwealth Equity Services, Llc | 35.484 | -0,63 | 1.144 | 114.300,00 | ||||
| 2026-01-29 | 13F | Quadcap Wealth Management, LLC | 131.243 | -1,71 | 4.233 | 3,78 | ||||
| 2026-01-28 | 13F | Fischer Investment Strategies, Llc | 104.928 | 3.384 | ||||||
| 2026-02-05 | 13F | Kane Co Wealth Management, Inc. | 15.834 | 511 | ||||||
| 2026-01-20 | 13F | Maryland Capital Advisors Inc. | 13.349 | 9,12 | 430 | 15,28 | ||||
| 2026-02-18 | 13F | GWM Advisors LLC | 97.420 | -30,03 | 3.142 | -26,13 | ||||
| 2026-01-29 | 13F | Quent Capital, LLC | 89 | 3 | ||||||
| 2026-02-05 | 13F | Allworth Financial LP | 1.133 | 0,00 | 37 | 5,88 | ||||
| 2026-01-29 | 13F | Comerica Bank | 109 | -4,39 | 4 | 0,00 | ||||
| 2026-02-10 | 13F | Savant Capital, LLC | 35.909 | 0,34 | 1.158 | 6,04 | ||||
| 2025-11-14 | 13F | Strategic Wealth Partners, Ltd. | 859 | 26 | ||||||
| 2026-02-12 | 13F | Brinker Capital Investments, LLC | 51.072 | 0,33 | 1.647 | 5,98 | ||||
| 2026-02-11 | 13F | United Wealth Management, LLC | 168.497 | 2,96 | 5.434 | 8,72 | ||||
| 2026-01-08 | 13F | Firethorn Wealth Partners, Llc | 12.695 | -3,32 | 409 | 2,00 | ||||
| 2026-02-13 | 13F | Excelsior Advisor Network LLC | 8.571 | 276 | ||||||
| 2026-01-29 | 13F | Index Fund Advisors, Inc. | 7.498 | 242 | ||||||
| 2026-02-03 | 13F | Washington Trust Advisors, Inc. | 8.978 | -5,71 | 290 | -0,34 | ||||
| 2026-02-17 | 13F | Advisor Group Holdings, Inc. | 96.461 | 24,74 | 3.112 | 33,96 | ||||
| 2026-01-15 | 13F | Sollinda Capital Management LLC | 27.337 | 48,35 | 882 | 56,76 | ||||
| 2026-02-11 | 13F | M Holdings Securities, Inc. | 30.171 | 0,00 | 1 | |||||
| 2025-11-14 | 13F | Skopos Labs, Inc. | 0 | -100,00 | 0 | |||||
| 2025-11-14 | 13F | Raymond James Financial Inc | 0 | -100,00 | 0 | |||||
| 2026-01-05 | 13F | Park Avenue Securities Llc | 106.306 | 18,40 | 3 | 50,00 | ||||
| 2026-01-29 | 13F | UBS Group AG | 14.064 | 5,39 | 454 | 11,30 | ||||
| 2026-01-20 | 13F | Alpha Financial Advisors, LLC | 48.785 | -5,83 | 1.573 | -0,57 | ||||
| 2026-01-21 | 13F | Unison Advisors LLC | 899.007 | 0,47 | 28.993 | 6,09 | ||||
| 2026-02-20 | 13F | Capstone Wealth Management, Inc. | 66.816 | 2.204 | ||||||
| 2026-01-28 | 13F | Chicago Partners Investment Group LLC | 136.942 | -0,24 | 4.763 | 8,40 | ||||
| 2026-02-12 | 13F | Great Valley Advisor Group, Inc. | 6.327 | -24,53 | 204 | -20,31 | ||||
| 2026-02-13 | 13F | Kestra Advisory Services, LLC | 0 | -100,00 | 0 | |||||
| 2026-01-15 | 13F | RCS Financial Planning, LLC | 11.706 | -9,40 | 378 | -4,31 | ||||
| 2026-02-13 | 13F | Tableaux Llc | 73.976 | -11,21 | 1.408 | -44,65 | ||||
| 2026-01-22 | 13F | Glass Jacobson Investment Advisors llc | 6.094 | 0,53 | 197 | 5,95 | ||||
| 2026-02-13 | 13F | Resources Investment Advisors, LLC. | 60.208 | 31,05 | 1.942 | 38,35 | ||||
| 2026-02-13 | 13F | Integrated Wealth Concepts LLC | 57.342 | -33,88 | 1.849 | -30,17 | ||||
| 2026-02-13 | 13F | Citigroup Inc | 8.147 | 18,92 | 263 | 25,36 | ||||
| 2026-02-04 | 13F | Summit Wealth Group Llc / Co | 57.792 | 1.864 | ||||||
| 2026-02-09 | 13F | Integrity Alliance, Llc. | 110.638 | 6,94 | 3.568 | 12,95 | ||||
| 2026-02-17 | 13F | Abel Hall, LLC | 58.453 | -4,30 | 1.885 | 1,07 | ||||
| 2026-02-11 | 13F | Daner Wealth Management, LLC | 10.561 | -6,42 | 378 | 7,41 | ||||
| 2026-02-17 | 13F | SageView Advisory Group, LLC | 8.047 | -3,58 | 260 | 1,97 | ||||
| 2026-01-21 | 13F | Capital Investment Advisory Services, LLC | 13.653 | 74,75 | 440 | 84,87 | ||||
| 2026-01-21 | 13F | Sutton Place Investors Llc | 20.359 | 4,55 | 657 | 10,44 | ||||
| 2026-02-17 | 13F | Bank Of America Corp /de/ | 52.879 | 8,54 | 1.705 | 14,66 | ||||
| 2026-01-13 | 13F | Two West Capital Advisors LLC | 19.493 | 0,75 | 629 | 2,28 | ||||
| 2026-01-26 | 13F | Forteris Wealth Management Inc. | 23.241 | 750 | ||||||
| 2026-02-13 | 13F | Morgan Stanley | 1 | -94,74 | 0 | |||||
| 2026-02-26 | 13F | BDFS Capital LLC | 25.234 | 814 | ||||||
| 2026-02-04 | 13F | Nwam Llc | 7.056 | 1,88 | 228 | 7,58 | ||||
| 2026-02-02 | 13F | Truist Financial Corp | 12.256 | -4,39 | 395 | 1,02 | ||||
| 2026-02-02 | 13F | Vantage Point Financial LLC | 11.970 | 79,11 | 386 | 89,22 | ||||
| 2026-02-11 | 13F | O'shaughnessy Asset Management, Llc | 193 | 0,00 | 6 | 20,00 | ||||
| 2025-12-02 | 13F | IFP Advisors, Inc | 0 | -100,00 | 0 | |||||
| 2026-01-23 | 13F | Vestment Financial LLC | 10.477 | 0,02 | 353 | 8,95 | ||||
| 2026-02-12 | 13F | Wealthspire Advisors, LLC | 63.061 | -22,90 | 2.034 | -18,61 | ||||
| 2026-01-16 | 13F | Applied Capital LLC | 55.548 | -3,30 | 1.791 | 2,11 | ||||
| 2026-02-02 | 13F | Pillar Financial Advisors, LLC | 915 | 0,00 | 30 | 7,41 | ||||
| 2026-02-17 | 13F | Royal Bank Of Canada | 5.558 | 60,87 | 179 | 68,87 | ||||
| 2026-02-20 | 13F | SB Capital Management Inc | 105.035 | 3.387 | ||||||
| 2026-02-05 | 13F | Cambridge Investment Research Advisors, Inc. | 12.589 | 11,36 | 0 | |||||
| 2026-02-17 | 13F | Foundry Financial LLC | 70.802 | 2.283 |