Grundlæggende statistik
| Institutionelle ejere | 164 total, 164 long only, 0 short only, 0 long/short - change of 4,43% MRQ |
| Gennemsnitlig porteføljeallokering | 0.5530 % - change of 24,90% MRQ |
| Institutionelle aktier (lange) | 50.056.762 (ex 13D/G) - change of 5,67MM shares 12,77% MRQ |
| Institutionel værdi (lang) | $ 1.249.549 USD ($1000) |
Institutionelt ejerskab og aktionærer
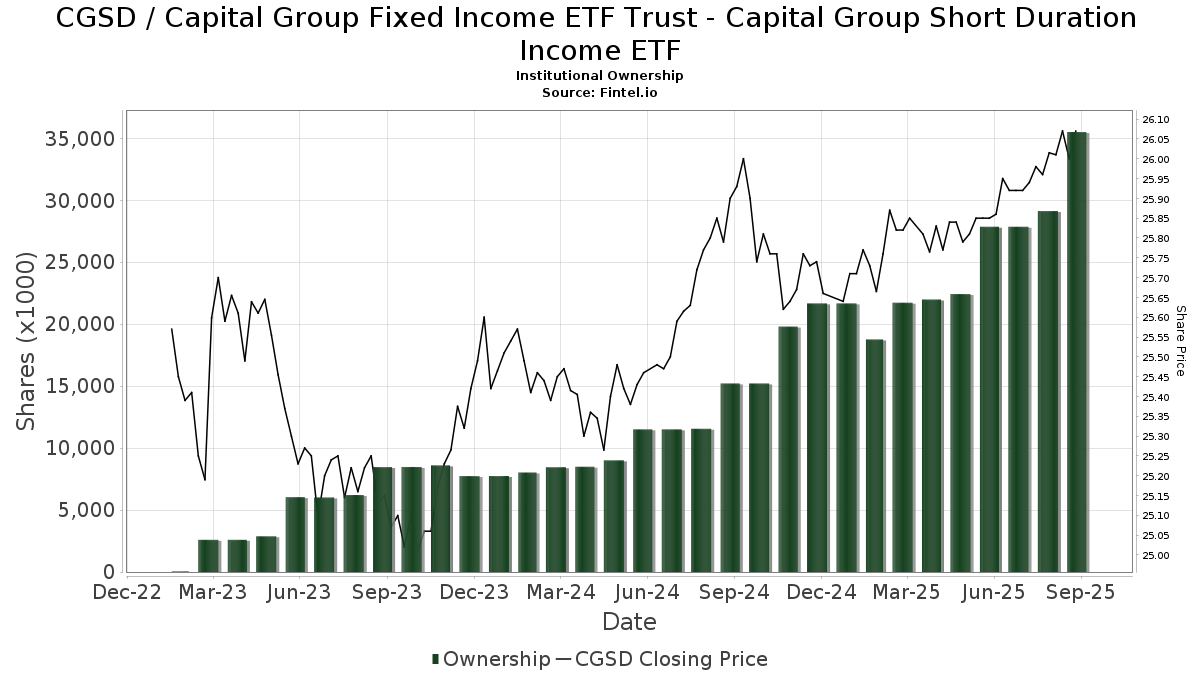
Capital Group Fixed Income ETF Trust - Capital Group Short Duration Income ETF (US:CGSD) har 164 institutionelle ejere og aktionærer, der har indsendt 13D/G- eller 13F-formularer til Securities Exchange Commission (SEC). Disse institutioner har i alt 50,056,762 aktier. Største aktionærer omfatter LPL Financial LLC, Morgan Stanley, Capital Group Private Client Services, Inc., Cetera Investment Advisers, Commonwealth Equity Services, Llc, Merit Financial Group, LLC, Wells Fargo & Company/mn, Wood Tarver Financial Group, LLC, Jones Financial Companies Lllp, and Royal Bank Of Canada .
Capital Group Fixed Income ETF Trust - Capital Group Short Duration Income ETF (ARCA:CGSD) institutionel ejerskabsstruktur viser aktuelle positioner i virksomheden efter institutioner og fonde, samt seneste ændringer i positionsstørrelse. Større aktionærer kan omfatte individuelle investorer, investeringsforeninger, hedgefonde eller institutioner. Skema 13D angiver, at investoren besidder (eller besidder) mere end 5 % af virksomheden og har til hensigt (eller har til hensigt at) aktivt at forfølge en ændring i forretningsstrategi. Skema 13G indikerer en passiv investering på over 5%.
The share price as of April 24, 2026 is 25,94 / share. Previously, on April 28, 2025, the share price was 25,93 / share. This represents an increase of 0,04% over that period.
Fondens stemningsscore
Fund Sentiment Score (fka Ownership Accumulation Score) finder de aktier, der bliver mest købt af fonde. Det er resultatet af en sofistikeret, multi-faktor kvantitativ model, der identificerer virksomheder med de højeste niveauer af institutionel akkumulering. Scoringsmodellen bruger en kombination af den samlede stigning i oplyste ejere, ændringerne i porteføljeallokeringer i disse ejere og andre målinger. Tallet går fra 0 til 100, hvor højere tal indikerer et højere niveau af akkumulering for sine jævnaldrende, og 50 er gennemsnittet.
Opdateringsfrekvens: Dagligt
Se Ownership Explorer, som giver en liste over højest rangerende virksomheder.
AI+ Ask Fintel’s AI assistant about Capital Group Fixed Income ETF Trust - Capital Group Short Duration Income ETF.
Select a question to share a public post with an AI-crafted answer.
Thinking of good questions…
Institutionel Put/Call-forhold
Ud over at indberette standardaktie- og gældsudstedelser skal institutter med mere end 100 mill. aktiver under forvaltning også oplyse deres put- og call-optionsbeholdninger. Da salgsoptioner generelt indikerer negativ stemning, og købsoptioner indikerer positiv stemning, kan vi få en fornemmelse af den overordnede institutionelle stemning ved at plotte forholdet mellem put og kald. Diagrammet til højre viser det historiske put/call-forhold for dette instrument.
Brug af Put/Call Ratio som en indikator for investorernes stemning overvinder en af de vigtigste mangler ved at bruge totalt institutionelt ejerskab, som er, at en betydelig mængde af aktiver under forvaltning investeres passivt for at spore indekser. Passivt forvaltede fonde køber typisk ikke optioner, så indikatoren for put/call-forholdet følger mere nøje følelsen af aktivt forvaltede fonde.
13F og NPORT arkivering
Detaljer om 13F-arkivering er gratis. Detaljer om NP-ansøgninger kræver et premium-medlemskab. Grønne rækker angiver nye positioner. Røde rækker angiver lukkede positioner. Klik på linket ikon for at se den fulde transaktionshistorik.
Opgrader
for at låse premium-data op og eksportere til Excel ![]() .
.
| Fil dato | Kilde | Investor | Type | Gennemsnitlig pris (Øst) |
Aktier | Δ Aktier (%) |
Rapporteret Værdi ($1000) |
Δ Værdi (%) |
Port Alloc (%) |
|
|---|---|---|---|---|---|---|---|---|---|---|
| 2026-02-13 | 13F | Inspire Advisors, LLC | 111.658 | 1,88 | 2.904 | 2,00 | ||||
| 2026-04-13 | 13F | IFP Advisors, Inc | 85.729 | 381,43 | 2.211 | 377,32 | ||||
| 2026-02-17 | 13F | Royal Bank Of Canada | 1.294.091 | 13,10 | 33.659 | 13,23 | ||||
| 2026-04-22 | 13F | Hartmann Taylor Wealth Management, LLC | 8.950 | 231 | ||||||
| 2026-04-17 | 13F | Richards, Merrill & Peterson, Inc. | 186.984 | 50,39 | 4.822 | 49,15 | ||||
| 2026-02-17 | 13F | Cetera Investment Advisers | 2.329.829 | 12,00 | 60.599 | 12,13 | ||||
| 2026-02-13 | 13F | Arkadios Wealth Advisors | 11.944 | 41,25 | 311 | 41,55 | ||||
| 2026-04-13 | 13F | Thayer Financial, L.L.C. | 438.992 | 6,36 | 11.322 | 5,46 | ||||
| 2026-03-03 | 13F | NWF Advisory Services Inc. | 169.214 | -5,81 | 4.401 | -5,70 | ||||
| 2026-04-22 | 13F | Spire Wealth Management | 5.126 | 0,61 | 132 | 0,00 | ||||
| 2026-04-21 | 13F | OneAscent Financial Services LLC | 10.422 | 269 | ||||||
| 2026-02-13 | 13F | Integrated Wealth Concepts LLC | 21.188 | 35,89 | 551 | 36,05 | ||||
| 2026-04-20 | 13F | Global Financial Private Client, LLC | 8.215 | 0,00 | 212 | -0,94 | ||||
| 2026-01-26 | 13F | Valmark Advisers, Inc. | 329.671 | 285,51 | 8.575 | 286,04 | ||||
| 2026-02-05 | 13F | Burford Brothers, Inc. | 23.372 | -13,19 | 608 | -13,16 | ||||
| 2026-02-02 | 13F | Benjamin Edwards Inc | 211.031 | 14,18 | 5.489 | 14,31 | ||||
| 2026-01-21 | 13F | Capital Investment Advisory Services, LLC | 3.107 | 81 | ||||||
| 2026-02-17 | 13F | Raymond James Financial Inc | 1.279.611 | 23,48 | 33.283 | 23,62 | ||||
| 2026-02-17 | 13F | Susquehanna International Group, Llp | 0 | -100,00 | 0 | |||||
| 2026-04-15 | 13F | Nations Financial Group Inc, /ia/ /adv | 15.031 | 7,16 | 388 | 6,32 | ||||
| 2026-04-16 | 13F | Financial Management Network Inc | 282.033 | 4,38 | 7.299 | 3,94 | ||||
| 2026-01-23 | 13F | Assetmark, Inc | 12.044 | 81,17 | 313 | 81,98 | ||||
| 2026-02-05 | 13F | Allworth Financial LP | 9.460 | 0,54 | 246 | 0,82 | ||||
| 2026-01-28 | 13F | Rather & Kittrell, Inc. | 7.781 | 0,00 | 202 | 0,00 | ||||
| 2026-04-22 | 13F | Janney Montgomery Scott LLC | 79.918 | 49,73 | 2 | 100,00 | ||||
| 2025-11-14 | 13F | WNY Asset Management, LLC | 997.621 | 3,89 | 25.918 | 4,07 | ||||
| 2026-02-17 | 13F | Equitable Holdings, Inc. | 35.880 | 96,88 | 933 | 97,25 | ||||
| 2025-11-14 | 13F | Bank Of America Corp /de/ | 0 | -100,00 | 0 | -100,00 | ||||
| 2026-02-11 | 13F | Cerity Partners LLC | 29.596 | 770 | ||||||
| 2026-04-20 | 13F | Keudell/Morrison Wealth Management | 24.716 | 637 | ||||||
| 2026-04-15 | 13F | DAVENPORT & Co LLC | 31.388 | 10,46 | 810 | 9,47 | ||||
| 2026-02-11 | 13F | Capital International Investors | 71.040 | -29,67 | 1.848 | -29,61 | ||||
| 2026-03-23 | 13F | J. Derek Lewis & Associates Inc. | 19.864 | 517 | ||||||
| 2026-04-09 | 13F | Stewardship Concepts Financial Services Llc | 15.671 | 404 | ||||||
| 2026-04-20 | 13F | Kercheville Advisors, LLC | 10.220 | 17,20 | 264 | 15,86 | ||||
| 2026-02-13 | 13F | Kestra Advisory Services, LLC | 0 | -100,00 | 0 | |||||
| 2026-02-13 | 13F | Mariner, LLC | 113.457 | 5,05 | 2.951 | 5,20 | ||||
| 2026-01-15 | 13F | Lodestone Wealth Management LLC | 235.176 | 27,10 | 6.117 | 27,23 | ||||
| 2026-02-11 | 13F | LPL Financial LLC | 6.235.706 | 22,50 | 162.191 | 22,64 | ||||
| 2026-02-12 | 13F | Steward Partners Investment Advisory, Llc | 12.190 | 91,79 | 317 | 92,12 | ||||
| 2026-01-20 | 13F | Sovran Advisors, LLC | 134.109 | -4,62 | 3.491 | -4,75 | ||||
| 2026-02-10 | 13F | BlackDiamond Wealth Management Inc. | 108.847 | -6,69 | 2.838 | -6,34 | ||||
| 2026-02-14 | 13F | Rockefeller Capital Management L.P. | 13.378 | -45,06 | 348 | -45,09 | ||||
| 2026-04-16 | 13F | Johnson Bixby & Associates, LLC | 7.779 | 0,00 | 201 | -0,99 | ||||
| 2026-02-06 | 13F | Cullen/frost Bankers, Inc. | 15.414 | 199,01 | 401 | 200,75 | ||||
| 2026-02-02 | 13F | Eq Wealth Advisors, Llc | 140.746 | -9,85 | 3.661 | -9,76 | ||||
| 2026-02-17 | 13F | Guardian Wealth Advisors, Llc / Nc | 28.650 | 0,00 | 745 | 0,13 | ||||
| 2026-04-24 | 13F | ProCore Advisors, LLC | 9.900 | -42,99 | 255 | -43,46 | ||||
| 2026-01-22 | 13F | DeDora Capital, Inc. | 93.321 | 18,77 | 2.427 | 18,91 | ||||
| 2026-02-06 | 13F | Envestnet Portfolio Solutions, Inc. | 18.685 | 34,97 | 486 | 35,10 | ||||
| 2026-04-08 | 13F | Wealth Science Advisors LLC | 86.043 | 0,00 | 2.238 | 0,00 | ||||
| 2026-02-13 | 13F | Smartleaf Asset Management LLC | 4.770 | -2,65 | 124 | -2,36 | ||||
| 2026-02-13 | 13F | SRS Capital Advisors, Inc. | 10.294 | 268 | ||||||
| 2025-10-30 | 13F | Oak Hill Wealth Advisors, Llc | 21.708 | 564 | ||||||
| 2026-04-20 | 13F | Kestra Private Wealth Services, Llc | 615.304 | 7,61 | 15.869 | 6,70 | ||||
| 2026-02-17 | 13F | Wiley Bros.-aintree Capital, Llc | 294.251 | 229,26 | 7.607 | 227,70 | ||||
| 2026-04-08 | 13F | Pines Wealth Management, LLC | 38.079 | 22,68 | 982 | 21,69 | ||||
| 2026-04-14 | 13F | Wealthcare Advisory Partners LLC | 17.420 | 17,34 | 449 | 16,32 | ||||
| 2026-02-02 | 13F | New England Capital Financial Advisors LLC | 258.901 | -3,50 | 6.734 | -3,37 | ||||
| 2026-02-13 | 13F | MAI Capital Management | 19.512 | 1.167,84 | 508 | 1.200,00 | ||||
| 2026-04-14 | 13F | Prospera Financial Services Inc | 39.252 | 251,34 | 1.012 | 248,97 | ||||
| 2026-01-29 | 13F | Comerica Bank | 11.378 | -2,59 | 296 | -2,64 | ||||
| 2026-02-09 | 13F | Harbour Investments, Inc. | 53.465 | 15,15 | 1.391 | 15,26 | ||||
| 2026-02-04 | 13F | Pensionmark Financial Group, Llc | 94.363 | 46,18 | 2.454 | 46,33 | ||||
| 2026-04-08 | 13F | KWB Wealth | 14.232 | 0,00 | 370 | 0,00 | ||||
| 2026-02-12 | 13F | Commonwealth Equity Services, Llc | 2.144.817 | 6,10 | 55.787 | 107.180,77 | ||||
| 2026-02-17 | 13F | Capital Planning Advisors, LLC | 26.242 | 683 | ||||||
| 2025-11-12 | 13F | Creekmur Asset Management LLC | 199.912 | -4,68 | 5.194 | -4,52 | ||||
| 2026-02-03 | 13F | McIlrath & Eck, LLC | 878.176 | -3,11 | 22.841 | -3,00 | ||||
| 2026-02-13 | 13F | Morgan Stanley | 5.944.971 | 7,15 | 154.629 | 7,27 | ||||
| 2026-04-08 | 13F | Stonebridge Financial Group, LLC | 11.470 | -5,46 | 296 | -6,35 | ||||
| 2026-01-15 | 13F | Clg Llc | 91.026 | 11,38 | 2.368 | 11,49 | ||||
| 2026-02-18 | 13F | GWM Advisors LLC | 0 | -100,00 | 0 | |||||
| 2026-04-22 | 13F | Continuum Advisory, LLC | 17.159 | -14,85 | 443 | -15,65 | ||||
| 2026-02-02 | 13F | Mutual Advisors, LLC | 23.769 | 0,15 | 618 | -0,16 | ||||
| 2026-02-13 | 13F | Sei Investments Co | 184.594 | 71,85 | 4.801 | 72,08 | ||||
| 2026-04-16 | 13F | Tortuga Wealth Management, Inc | 20.294 | 528 | ||||||
| 2026-02-12 | 13F | Titleist Asset Management, Llc | 0 | -100,00 | 0 | |||||
| 2026-02-13 | 13F | RFP Financial Group LLC | 797.118 | 63,01 | 20.733 | 63,48 | ||||
| 2026-01-20 | 13F | Stratos Wealth Partners, LTD. | 0 | -100,00 | 0 | |||||
| 2026-02-10 | 13F | Envestnet Asset Management Inc | 1.250.272 | -1,31 | 32.520 | -1,19 | ||||
| 2026-04-24 | 13F | Tcfg Wealth Management, Llc | 29.518 | -3,07 | 761 | -3,91 | ||||
| 2026-03-05 | 13F | Gunpowder Capital Management, LLC dba Oliver Wealth Management | 395 | 10 | ||||||
| 2026-04-10 | 13F | IAM Advisory, LLC | 568.019 | 1,96 | 14.649 | 1,10 | ||||
| 2026-03-02 | 13F | Clearwave Capital, LLC | 37.207 | 968 | ||||||
| 2026-02-13 | 13F | Aptus Capital Advisors, LLC | 28.650 | 0,00 | 745 | 0,13 | ||||
| 2026-02-12 | 13F | Principal Securities, Inc. | 8.300 | 0,00 | 216 | 0,00 | ||||
| 2026-02-13 | 13F | Flow Traders U.s. Llc | 0 | -100,00 | 0 | |||||
| 2026-04-13 | 13F | Garrett Investment Advisors LLC | 28.841 | 22,42 | 744 | 21,41 | ||||
| 2026-02-06 | 13F | EverSource Wealth Advisors, LLC | 117 | 0,00 | 3 | 0,00 | ||||
| 2026-01-14 | 13F | ORG Partners LLC | 0 | -100,00 | 0 | |||||
| 2026-02-13 | 13F | Wells Fargo & Company/mn | 1.731.920 | 55,11 | 45.047 | 55,29 | ||||
| 2026-02-10 | 13F/A | Northwestern Mutual Wealth Management Co | 310.788 | 12,15 | 8.084 | 12,28 | ||||
| 2026-02-11 | 13F | Capital Analysts, Inc. | 9.422 | 16,11 | 0 | |||||
| 2026-02-11 | 13F | Capital Group Private Client Services, Inc. | 2.346.908 | 0,67 | 61.043 | 0,78 | ||||
| 2026-04-09 | 13F | Freestate Advisors LLC | 74.558 | 24,62 | 1.923 | 23,52 | ||||
| 2026-02-04 | 13F | Strategic Family Wealth Counselors, L.L.C. | 17.623 | 0,00 | 458 | 0,22 | ||||
| 2026-02-06 | 13F | Bare Financial Services, Inc | 6.521 | 170 | ||||||
| 2026-02-12 | 13F | Jane Street Group, Llc | 0 | -100,00 | 0 | |||||
| 2026-04-08 | 13F | Wealth Enhancement Advisory Services, Llc | 588.870 | -28,93 | 15.216 | -29,48 | ||||
| 2026-02-06 | 13F | GPS Wealth Strategies Group, LLC | 0 | -100,00 | 0 | |||||
| 2026-04-13 | 13F | Cyndeo Wealth Partners, LLC | 37.718 | 10,86 | 973 | 9,95 | ||||
| 2026-02-05 | 13F | Cambridge Investment Research Advisors, Inc. | 471.740 | 22,63 | 12 | 33,33 | ||||
| 2026-02-09 | 13F | Kestra Investment Management, LLC | 0 | -100,00 | 0 | |||||
| 2026-02-12 | 13F | Founders Financial Alliance, LLC | 57.244 | 22,14 | 1.489 | 22,27 | ||||
| 2026-01-21 | 13F | Landaas & Co /wi /adv | 541.876 | 118,30 | 14.094 | 118,55 | ||||
| 2026-01-21 | 13F | Flagship Harbor Advisors, Llc | 1.069 | 28 | ||||||
| 2026-01-28 | 13F | Confluence Wealth Services, Inc. | 40.802 | 3,95 | 1.061 | 4,12 | ||||
| 2026-02-03 | 13F | Entruity Wealth, LLC | 139.709 | -42,03 | 3.634 | -41,97 | ||||
| 2026-02-10 | 13F | Hazlett, Burt & Watson, Inc. | 4.980 | 0 | ||||||
| 2026-02-13 | 13F | Beacon Financial Advisory LLC | 15.129 | 9,59 | 393 | 9,78 | ||||
| 2025-10-31 | 13F | Sagespring Wealth Partners, Llc | 0 | -100,00 | 0 | |||||
| 2026-04-15 | 13F | Merit Financial Group, LLC | 1.982.361 | 3,74 | 51.125 | 2,86 | ||||
| 2026-04-24 | 13F | Saxony Capital Management, LLC | 141.747 | 4,33 | 3.656 | 3,45 | ||||
| 2026-02-13 | 13F | Baird Financial Group, Inc. | 388.852 | 947,84 | 10.114 | 949,17 | ||||
| 2026-04-13 | 13F | St Germain D J Co Inc | 2.900 | 0,00 | 75 | -1,33 | ||||
| 2026-04-07 | 13F | CoreCap Advisors, LLC | 193 | 0,00 | 5 | -20,00 | ||||
| 2026-01-26 | 13F | Private Trust Co Na | 2.738 | 0,00 | 71 | 0,00 | ||||
| 2026-02-04 | 13F | Bridgewealth Advisory Group, LLC | 964.535 | 18,50 | 25.088 | 18,64 | ||||
| 2026-04-24 | 13F | Financial Life Planners | 71 | 2 | ||||||
| 2026-02-17 | 13F | Advisory Services Network, LLC | 0 | -100,00 | 0 | |||||
| 2026-02-04 | 13F | Cannon Financial Strategists, Inc. | 29.458 | 1,20 | 766 | 1,32 | ||||
| 2025-11-03 | 13F | Bank of New York Mellon Corp | 0 | -100,00 | 0 | |||||
| 2026-02-05 | 13F | Western Wealth Management, LLC | 50.351 | 15,65 | 1.310 | 15,74 | ||||
| 2026-02-17 | 13F | Advisor Group Holdings, Inc. | 1.255.710 | 3,32 | 32.661 | 3,44 | ||||
| 2026-01-27 | 13F | Werba Rubin Papier Wealth Management | 55.315 | 3,61 | 1.439 | 3,75 | ||||
| 2025-11-07 | 13F | Beta Wealth Group, Inc. | 0 | -100,00 | 0 | |||||
| 2026-02-12 | 13F | Summit Financial, LLC | 56.168 | 4,68 | 1.461 | 4,81 | ||||
| 2026-02-19 | 13F | Birchwood Financial Partners, Inc. | 1.216 | 32 | ||||||
| 2026-02-17 | 13F | Ameriflex Group, Inc. | 4.000 | 104 | ||||||
| 2026-02-17 | 13F | Mpwm Advisory Solutions, Llc | 0 | -100,00 | 0 | |||||
| 2026-02-13 | 13F | Stifel Financial Corp | 774.810 | 9,90 | 20.153 | 10,03 | ||||
| 2026-04-07 | 13F | Farther Finance Advisors, LLC | 5 | 0,00 | 0 | |||||
| 2026-04-16 | 13F | Petredis Investment Advisors Llc | 193.112 | -7,92 | 4.980 | -8,71 | ||||
| 2026-01-23 | 13F | Smith, Moore & Co. | 20.157 | -11,88 | 524 | -11,78 | ||||
| 2026-02-17 | 13F | Captrust Financial Advisors | 1.033.111 | 4,22 | 26.871 | 4,34 | ||||
| 2026-04-07 | 13F | Central Pacific Bank - Trust Division | 0 | -100,00 | 0 | |||||
| 2026-02-12 | 13F | StoneX Group Inc. | 130.520 | -0,45 | 3.396 | -0,29 | ||||
| 2026-04-21 | 13F | Aurdan Capital Management, LLC | 24.455 | 31,10 | 631 | 29,90 | ||||
| 2026-04-08 | 13F | Dynamic Advisor Solutions LLC | 28.707 | 1,29 | 740 | 0,41 | ||||
| 2026-04-10 | 13F | Boyer Financial Services, Inc. | 36.834 | 29,02 | 950 | 28,07 | ||||
| 2026-02-05 | 13F | Cauble & Harre Wealth Management, Inc. | 345.902 | 8.997 | ||||||
| 2026-02-17 | 13F | Citadel Advisors Llc | 0 | -100,00 | 0 | |||||
| 2026-02-18 | 13F | Troutman Wealth Management, LLC | 95.733 | 2.490 | ||||||
| 2026-03-10 | 13F | Advisortrust Partners, Llc | 14.063 | 366 | ||||||
| 2026-04-20 | 13F | Sowell Financial Services LLC | 19.632 | -9,67 | 506 | -10,44 | ||||
| 2026-04-15 | 13F | LongView Wealth Management | 37.447 | 10,72 | 971 | 10,35 | ||||
| 2026-02-11 | 13F | Gateway Wealth Partners, LLC | 13.383 | 45,77 | 348 | 46,22 | ||||
| 2026-01-28 | 13F | Geneos Wealth Management Inc. | 8.092 | 5,16 | 210 | 5,53 | ||||
| 2026-02-12 | 13F | Conservest Capital Advisors, Inc. | 83.978 | 2.184 | ||||||
| 2026-02-02 | 13F | Souders Financial Advisors | 455.868 | 4,86 | 11.857 | 4,98 | ||||
| 2026-02-12 | 13F | Great Valley Advisor Group, Inc. | 267.218 | -18,81 | 6.950 | -18,71 | ||||
| 2026-04-16 | 13F | Smith Thornton Advisors LLC | 67.273 | 0,00 | 1.735 | -0,86 | ||||
| 2026-02-13 | 13F | Bay Colony Advisory Group, Inc d/b/a Bay Colony Advisors | 0 | -100,00 | 0 | |||||
| 2026-04-17 | 13F | AdvisorNet Financial, Inc | 1.359 | 5,68 | 35 | 6,06 | ||||
| 2026-04-24 | 13F | Merited Wealth, LLC | 0 | -100,00 | 0 | |||||
| 2026-02-06 | 13F | Global Retirement Partners, LLC | 19.710 | 0,00 | 513 | 0,00 | ||||
| 2026-02-10 | 13F | Rothschild Investment Llc | 155.683 | 2,55 | 4.049 | 2,66 | ||||
| 2026-01-29 | 13F | UBS Group AG | 1.281.578 | 9,46 | 33.334 | 9,58 | ||||
| 2026-04-14 | 13F | Nbc Securities, Inc. | 888 | -1,88 | 23 | -4,35 | ||||
| 2026-04-16 | 13F | Balboa Wealth Partners | 0 | -100,00 | 0 | |||||
| 2026-02-17 | 13F | Signature Equity Partners, LLC | 549 | 14 | ||||||
| 2026-02-12 | 13F | Parsonex Advisory Services, Inc. | 43.130 | 35,05 | 1.122 | 35,22 | ||||
| 2026-02-13 | 13F | Ausdal Financial Partners, Inc. | 16.370 | -5,93 | 426 | -5,97 | ||||
| 2026-01-21 | 13F | Signature Resources Capital Management, LLC | 2.127 | -6,05 | 55 | -5,17 | ||||
| 2026-02-04 | 13F | Ameritas Advisory Services, LLC | 8.375 | 189,59 | 218 | 189,33 | ||||
| 2026-02-11 | 13F | Jpmorgan Chase & Co | 0 | 0 | ||||||
| 2026-02-13 | 13F | J Hagan Capital, Inc. | 164.822 | 17,91 | 4.287 | 18,07 | ||||
| 2025-11-06 | 13F | RFG Advisory, LLC | 0 | -100,00 | 0 | |||||
| 2026-04-23 | 13F | Oppenheimer & Co Inc | 68.058 | 554,53 | 1.755 | 550,00 | ||||
| 2026-02-11 | 13F | Deutsche Bank Ag\ | 0 | -100,00 | 0 | |||||
| 2026-01-23 | 13F | Diversify Advisory Services, LLC | 9.263 | 241 | ||||||
| 2026-02-17 | 13F | Perennial Investment Advisors, LLC | 53.644 | 57,94 | 1.395 | 58,16 | ||||
| 2026-02-12 | 13F | Wood Tarver Financial Group, LLC | 1.376.244 | 569,67 | 36 | 600,00 | ||||
| 2025-11-06 | 13F | MSH Capital Advisors LLC | 0 | -100,00 | 0 | -100,00 | ||||
| 2026-04-15 | 13F | Eaton Financial Holdings Company, LLC | 36.870 | 14,57 | 951 | 13,50 | ||||
| 2026-02-09 | 13F | Integrity Alliance, Llc. | 14.063 | 366 | ||||||
| 2026-02-10 | 13F | Natixis Advisors, L.p. | 21.868 | 1 | ||||||
| 2026-02-12 | 13F | Brinker Capital Investments, LLC | 54.495 | -9,96 | 1.417 | -9,86 | ||||
| 2026-02-13 | 13F | Mml Investors Services, Llc | 502.718 | 12,26 | 13.076 | 12,39 | ||||
| 2026-04-07 | 13F | U.S. Capital Wealth Advisors, LLC | 18.619 | -9,70 | 480 | -10,45 | ||||
| 2026-04-13 | 13F | Creative Financial Designs Inc /adv | 8.962 | 120,14 | 231 | 120,00 | ||||
| 2026-02-02 | 13F | Truist Financial Corp | 41.765 | 8,77 | 1.086 | 8,93 | ||||
| 2026-02-03 | 13F | International Assets Investment Management, Llc | 126.908 | 0,66 | 3.301 | 1,04 | ||||
| 2026-01-29 | 13F | Ashton Thomas Private Wealth, LLC | 9.752 | 0,00 | 254 | 0,00 | ||||
| 2026-02-17 | 13F | Jones Financial Companies Lllp | 1.312.237 | 33,62 | 34.131 | 33,47 | ||||
| 2026-02-09 | 13F | Bleakley Financial Group, LLC | 30.082 | -14,77 | 782 | -14,63 | ||||
| 2026-02-17 | 13F | Private Advisor Group, LLC | 470.153 | 16,08 | 12.229 | 16,21 | ||||
| 2026-04-24 | 13F | SOL Capital Management CO | 0 | -100,00 | 0 | |||||
| 2026-04-16 | 13F | Brookstone Capital Management | 15.084 | -4,20 | 389 | -4,89 |