Grundlæggende statistik
| Institutionelle aktier (lange) | 20.752.797 - 56,10% (ex 13D/G) - change of -1,11MM shares -5,07% MRQ |
| Institutionel værdi (lang) | $ 348.759 USD ($1000) |
Institutionelt ejerskab og aktionærer
BlackSky Technology Inc. (US:BKSY) har 180 institutionelle ejere og aktionærer, der har indsendt 13D/G- eller 13F-formularer til Securities Exchange Commission (SEC). Disse institutioner har i alt 20,752,797 aktier. Største aktionærer omfatter BlackRock, Inc., Bank of New York Mellon Corp, Vanguard Group Inc, AWM Investment Company, Inc., Cercano Management LLC, State Street Corp, Millennium Management Llc, Daiwa Securities Group Inc., Geode Capital Management, Llc, and Van Eck Associates Corp .
BlackSky Technology Inc. (NYSE:BKSY) institutionel ejerskabsstruktur viser aktuelle positioner i virksomheden efter institutioner og fonde, samt seneste ændringer i positionsstørrelse. Større aktionærer kan omfatte individuelle investorer, investeringsforeninger, hedgefonde eller institutioner. Skema 13D angiver, at investoren besidder (eller besidder) mere end 5 % af virksomheden og har til hensigt (eller har til hensigt at) aktivt at forfølge en ændring i forretningsstrategi. Skema 13G indikerer en passiv investering på over 5%.
The share price as of April 15, 2026 is 33,07 / share. Previously, on April 16, 2025, the share price was 7,12 / share. This represents an increase of 364,47% over that period.

Fondens stemningsscore
Fund Sentiment Score (fka Ownership Accumulation Score) finder de aktier, der bliver mest købt af fonde. Det er resultatet af en sofistikeret, multi-faktor kvantitativ model, der identificerer virksomheder med de højeste niveauer af institutionel akkumulering. Scoringsmodellen bruger en kombination af den samlede stigning i oplyste ejere, ændringerne i porteføljeallokeringer i disse ejere og andre målinger. Tallet går fra 0 til 100, hvor højere tal indikerer et højere niveau af akkumulering for sine jævnaldrende, og 50 er gennemsnittet.
Opdateringsfrekvens: Dagligt
Se Ownership Explorer, som giver en liste over højest rangerende virksomheder.
AI+ Ask Fintel’s AI assistant about BlackSky Technology Inc..
Select a question to share a public post with an AI-crafted answer.
Thinking of good questions…
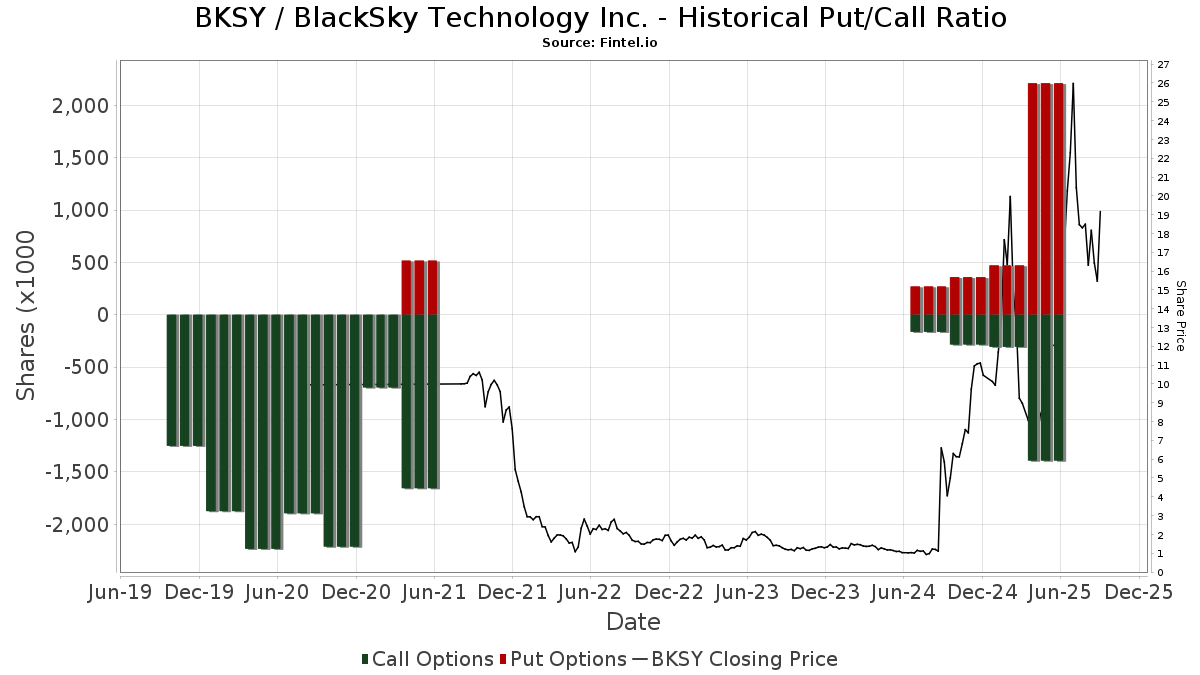
Institutionel Put/Call-forhold
Ud over at indberette standardaktie- og gældsudstedelser skal institutter med mere end 100 mill. aktiver under forvaltning også oplyse deres put- og call-optionsbeholdninger. Da salgsoptioner generelt indikerer negativ stemning, og købsoptioner indikerer positiv stemning, kan vi få en fornemmelse af den overordnede institutionelle stemning ved at plotte forholdet mellem put og kald. Diagrammet til højre viser det historiske put/call-forhold for dette instrument.
Brug af Put/Call Ratio som en indikator for investorernes stemning overvinder en af de vigtigste mangler ved at bruge totalt institutionelt ejerskab, som er, at en betydelig mængde af aktiver under forvaltning investeres passivt for at spore indekser. Passivt forvaltede fonde køber typisk ikke optioner, så indikatoren for put/call-forholdet følger mere nøje følelsen af aktivt forvaltede fonde.
13D/G-arkivering
Vi præsenterer 13D/G ansøgninger separat fra 13F ansøgninger på grund af den forskellige behandling af SEC. 13D/G-ansøgninger kan indgives af grupper af investorer (med én ledende), hvorimod 13F-ansøgninger ikke kan. Dette resulterer i situationer, hvor en investor kan indsende en 13D/G, der rapporterer én værdi for de samlede aktier (der repræsenterer alle de aktier, der ejes af investorgruppen), men derefter indsender en 13F, der rapporterer en anden værdi for de samlede aktier (der udelukkende repræsenterer deres egne) ejendomsret). Det betyder, at aktieejerskab af 13D/G-arkiver og 13F-arkiveringer ofte ikke er direkte sammenlignelige, så vi præsenterer dem separat.
Bemærk: Fra den 16. maj 2021 viser vi ikke længere ejere, der ikke har indsendt en 13D/G inden for det seneste år. Tidligere viste vi den fulde historie af 13D/G-arkiver. Generelt skal enheder, der er forpligtet til at indgive 13D/G-ansøgninger, indgive mindst årligt, før de indsender en afsluttende ansøgning. Dog forlader fonde nogle gange positioner uden at indsende en afsluttende ansøgning (dvs. de afvikler), så visning af den fulde historie resulterede nogle gange i forvirring om det nuværende ejerskab. For at undgå forvirring viser vi nu kun 'aktuelle' ejere - det vil sige - ejere, der har anmeldt inden for det seneste år.
Upgrade to unlock premium data.
| Fil dato | Form | Investor | Forrige Aktier |
Seneste Aktier |
Δ Aktier (Procent) |
Ejendomsret (Procent) |
Δ Ejerskab (Procent) |
|
|---|---|---|---|---|---|---|---|---|
| 2026-02-13 | AWM Investment Company, Inc. | 2,209,926 | 1,725,610 | -21.92 | 4.80 | -23.81 | ||
| 2026-01-30 | VANGUARD GROUP INC | 1,837,002 | 5.10 | |||||
| 2026-01-29 | Bank of New York Mellon Corp | 2,072,543 | 5.80 | |||||
| 2025-10-17 | BlackRock, Inc. | 1,642,300 | 2,287,439 | 39.28 | 6.50 | 22.64 | ||
| 2025-08-11 | Mithril LP | 2,328,503 | 6.60 |
13F og NPORT arkivering
Detaljer om 13F-arkivering er gratis. Detaljer om NP-ansøgninger kræver et premium-medlemskab. Grønne rækker angiver nye positioner. Røde rækker angiver lukkede positioner. Klik på linket ikon for at se den fulde transaktionshistorik.
Opgrader
for at låse premium-data op og eksportere til Excel ![]() .
.
| Fil dato | Kilde | Investor | Type | Gennemsnitlig pris (Øst) |
Aktier | Δ Aktier (%) |
Rapporteret Værdi ($1000) |
Δ Værdi (%) |
Port Alloc (%) |
|
|---|---|---|---|---|---|---|---|---|---|---|
| 2026-02-17 | 13F | Aquatic Capital Management LLC | 12.404 | 233 | ||||||
| 2026-04-07 | 13F | CoreCap Advisors, LLC | 40 | 0,00 | 1 | |||||
| 2026-02-17 | 13F | Citadel Advisors Llc | Call | 151.500 | -30,54 | 2.841 | -35,37 | |||
| 2026-02-17 | 13F | Janus Henderson Group Plc | 12.289 | 0,00 | 230 | -6,88 | ||||
| 2026-02-17 | 13F | Citadel Advisors Llc | Put | 245.200 | -15,48 | 4.598 | -21,35 | |||
| 2026-02-17 | 13F | Citadel Advisors Llc | 154.965 | -17,50 | 2.906 | -23,23 | ||||
| 2026-02-12 | 13F | Penserra Capital Management LLC | 110.138 | 58,13 | 2 | 100,00 | ||||
| 2026-04-02 | 13F | Noble Wealth Management PBC | 23 | 1 | ||||||
| 2026-02-13 | 13F | Squarepoint Ops LLC | 0 | -100,00 | 0 | |||||
| 2026-02-13 | 13F | Rhumbline Advisers | 36.952 | -9,73 | 693 | -16,02 | ||||
| 2026-02-13 | 13F | Wexford Capital Lp | 0 | -100,00 | 0 | |||||
| 2025-11-14 | 13F | Wolverine Trading, Llc | 11.119 | -79,86 | 222 | -79,35 | ||||
| 2025-11-14 | 13F | Wolverine Trading, Llc | Call | 81.800 | 160,51 | 1.634 | 167,27 | |||
| 2025-11-14 | 13F | Wolverine Trading, Llc | Put | 32.000 | -14,21 | 639 | -11,98 | |||
| 2026-02-12 | 13F | Wealthspire Advisors, LLC | 0 | -100,00 | 0 | |||||
| 2026-02-17 | 13F | Bank Of America Corp /de/ | 161.253 | 43,55 | 3.023 | 33,58 | ||||
| 2026-02-12 | 13F | Jane Street Group, Llc | Put | 38.600 | -30,45 | 724 | -35,33 | |||
| 2026-02-12 | 13F | Jane Street Group, Llc | Call | 72.200 | -62,69 | 1.354 | -65,30 | |||
| 2026-02-12 | 13F | Jane Street Group, Llc | 171.892 | 3.223 | ||||||
| 2026-02-11 | 13F | Rise Advisors, LLC | 0 | -100,00 | 0 | -100,00 | ||||
| 2026-02-13 | 13F | Walleye Capital LLC | 7.198 | 287,41 | 135 | 262,16 | ||||
| 2026-02-13 | 13F | Walleye Capital LLC | Call | 21.000 | -50,93 | 394 | -54,41 | |||
| 2026-02-13 | 13F | Y-Intercept (Hong Kong) Ltd | 0 | -100,00 | 0 | |||||
| 2026-02-10 | 13F | Intech Investment Management Llc | 0 | -100,00 | 0 | |||||
| 2026-02-06 | 13F | Leonteq Securities AG | 6.119 | 232,92 | 115 | 208,11 | ||||
| 2026-02-13 | 13F | Walleye Capital LLC | Put | 22.400 | -58,13 | 420 | -61,04 | |||
| 2026-02-13 | 13F | Lord, Abbett & Co. Llc | 337.631 | -0,05 | 6 | 0,00 | ||||
| 2026-02-13 | 13F | Golden State Wealth Management, LLC | 8.000 | 48,15 | 150 | 38,89 | ||||
| 2026-02-17 | 13F | Fmr Llc | 5.761 | 47,42 | 108 | 38,46 | ||||
| 2026-02-06 | 13F | Pnc Financial Services Group, Inc. | 171 | 2,40 | 3 | 0,00 | ||||
| 2026-03-04 | 13F | SHP Wealth Management | 99 | 2 | ||||||
| 2026-02-13 | 13F | Quarry LP | 1.387 | 26 | ||||||
| 2026-02-17 | 13F | Sender Co & Partners, Inc. | 0 | -100,00 | 0 | |||||
| 2026-02-17 | 13F | Bridgeway Capital Management Inc | 0 | -100,00 | 0 | -100,00 | ||||
| 2026-02-10 | 13F | Eurizon Capital SGR S.p.A. | 5.074 | 95 | ||||||
| 2026-02-11 | 13F | Group One Trading, L.p. | 11.009 | -51,30 | 206 | -54,73 | ||||
| 2026-02-17 | 13F | Alliancebernstein L.p. | 20.894 | -40,09 | 392 | -44,30 | ||||
| 2026-02-12 | 13F | Laffer Investments | 10.643 | 200 | ||||||
| 2026-02-17 | 13F | XTX Topco Ltd | 28.105 | 527 | ||||||
| 2026-02-09 | 13F | Kingsview Wealth Management, LLC | 39.189 | 735 | ||||||
| 2026-04-15 | 13F | Tema Etfs Llc | 1.308 | 33 | ||||||
| 2026-02-09 | 13F | Jefferies Financial Group Inc. | 0 | -100,00 | 0 | |||||
| 2026-02-06 | 13F | EverSource Wealth Advisors, LLC | 65 | 0,00 | 1 | 0,00 | ||||
| 2026-02-02 | 13F | Wolverine Asset Management Llc | Put | 180.100 | 125,12 | 3.377 | 109,43 | |||
| 2026-04-07 | 13F | Farther Finance Advisors, LLC | 6.427 | -2,87 | 178 | 42,74 | ||||
| 2025-11-13 | 13F | Formula Growth Ltd | 0 | -100,00 | 0 | -100,00 | ||||
| 2026-01-07 | 13F | Harbor Investment Advisory, Llc | 1.125 | 12,50 | 21 | 5,00 | ||||
| 2026-02-13 | 13F | BNP Paribas Asset Management Holding S.A. | 497 | 0 | ||||||
| 2026-02-12 | 13F | Swiss National Bank | 55.300 | 0,00 | 1.037 | -7,00 | ||||
| 2026-02-12 | 13F | Dimensional Fund Advisors Lp | 215.148 | -12,88 | 4.036 | -18,89 | ||||
| 2026-02-13 | 13F | AWM Investment Company, Inc. | 1.725.610 | -12,81 | 32.355 | -18,87 | ||||
| 2026-02-05 | 13F | Allworth Financial LP | 1.886 | 0,16 | 35 | -5,41 | ||||
| 2026-02-12 | 13F | Wasatch Advisors Inc | 407.701 | -0,75 | 7.644 | -7,65 | ||||
| 2026-02-12 | 13F | Federation des caisses Desjardins du Quebec | 278 | -78,25 | 5 | -80,00 | ||||
| 2026-02-12 | 13F | Brown Brothers Harriman & Co | 16.011 | 0,00 | 300 | -6,83 | ||||
| 2026-02-17 | 13F | Tower Research Capital LLC (TRC) | 3.599 | 287,82 | 67 | 272,22 | ||||
| 2025-11-25 | 13F | Briaud Financial Planning, Inc | 0 | -100,00 | 0 | |||||
| 2026-02-12 | 13F | Steward Partners Investment Advisory, Llc | 101 | 1,00 | 2 | -50,00 | ||||
| 2026-02-13 | 13F | OMERS ADMINISTRATION Corp | 0 | -100,00 | 0 | |||||
| 2026-02-11 | 13F | Simplex Trading, Llc | 10.671 | -11,46 | 200 | |||||
| 2026-02-10 | 13F | Close Asset Management Ltd | 425 | 0 | ||||||
| 2026-02-12 | 13F | Hollencrest Capital Management | 93 | 32,86 | 2 | 0,00 | ||||
| 2026-02-13 | 13F | Wells Fargo & Company/mn | 35.066 | 77,28 | 657 | 65,08 | ||||
| 2025-11-14 | 13F | HGC Investment Management Inc. | 0 | -100,00 | 0 | -100,00 | ||||
| 2026-02-06 | 13F | Prescott Group Capital Management, L.l.c. | 50.982 | 0,00 | 956 | -7,01 | ||||
| 2026-02-17 | 13F | D. E. Shaw & Co., Inc. | Call | 92.800 | 0,00 | 1.740 | -6,90 | |||
| 2026-02-17 | 13F | D. E. Shaw & Co., Inc. | Put | 52.800 | -17,63 | 990 | -23,32 | |||
| 2026-02-06 | 13F | HighTower Advisors, LLC | 0 | -100,00 | 0 | |||||
| 2026-02-17 | 13F | D. E. Shaw & Co., Inc. | 30.294 | 568 | ||||||
| 2026-01-23 | 13F | Capital Investment Counsel, Inc | 12.000 | 0,00 | 225 | -6,64 | ||||
| 2026-01-14 | 13F | ORG Partners LLC | 40 | -27,27 | 1 | -100,00 | ||||
| 2026-02-05 | 13F | Amalgamated Bank | 977 | 12,82 | 0 | |||||
| 2026-02-13 | 13F | Parkside Financial Bank & Trust | 1.039 | 88,22 | 19 | 72,73 | ||||
| 2026-02-17 | 13F | Legacy Wealth Advisors, LLC | 31.827 | 597 | ||||||
| 2026-02-17 | 13F | Russell Investments Group, Ltd. | 2.806 | 7,10 | 53 | 0,00 | ||||
| 2025-11-13 | 13F | 1492 Capital Management LLC | 0 | -100,00 | 0 | |||||
| 2026-04-02 | 13F | Aspect Partners, LLC | 60 | 2 | ||||||
| 2026-01-21 | 13F | Indiana Trust & Investment Management CO | 115 | 0,00 | 2 | 0,00 | ||||
| 2026-02-06 | 13F | GPS Wealth Strategies Group, LLC | 2.230 | -67,29 | 42 | -70,07 | ||||
| 2026-02-17 | 13F | MIRAE ASSET GLOBAL ETFS HOLDINGS Ltd. | 296.727 | 15,35 | 5.564 | 7,33 | ||||
| 2026-02-03 | 13F | Cassaday & Co Wealth Management LLC | 13.181 | 247 | ||||||
| 2026-02-13 | 13F | Caitong International Asset Management Co., Ltd | 192 | -93,15 | 4 | -94,64 | ||||
| 2026-02-11 | 13F | United Financial Planning Group LLC | 15 | 0 | ||||||
| 2025-11-04 | 13F | Pineridge Advisors LLC | 324 | 7 | ||||||
| 2026-02-17 | 13F | Driehaus Capital Management Llc | 0 | -100,00 | 0 | |||||
| 2026-04-13 | 13F | IFP Advisors, Inc | 1.588 | -29,52 | 40 | -7,14 | ||||
| 2026-02-17 | 13F | SageView Advisory Group, LLC | 2.482 | 47 | ||||||
| 2026-02-12 | 13F | Nuveen, LLC | 81.727 | 12,77 | 1.532 | 4,93 | ||||
| 2026-04-06 | 13F | GAMMA Investing LLC | 903 | 29,56 | 23 | 69,23 | ||||
| 2026-02-17 | 13F | Strive Financial Group ,LLC | 1.413 | 26 | ||||||
| 2026-02-10 | 13F | Bank of New York Mellon Corp | 2.072.543 | 392,84 | 38.860 | 358,63 | ||||
| 2026-02-10 | 13F | Bnp Paribas Arbitrage, Sa | 6.186 | -74,55 | 116 | -76,48 | ||||
| 2026-02-13 | 13F | Morgan Stanley | 281.375 | -11,60 | 5.276 | -17,75 | ||||
| 2026-02-13 | 13F | SRS Capital Advisors, Inc. | 5.985 | 15,23 | 112 | 7,69 | ||||
| 2026-02-13 | 13F | Charles Schwab Investment Management Inc | 263.399 | 5,94 | 4.939 | -1,42 | ||||
| 2026-02-17 | 13F | Balyasny Asset Management Llc | 12.306 | 231 | ||||||
| 2026-02-17 | 13F | Portolan Capital Management, LLC | 0 | -100,00 | 0 | |||||
| 2026-02-17 | 13F | Numerai GP LLC | 13.570 | -43,85 | 254 | -47,74 | ||||
| 2026-02-17 | 13F | Advisory Services Network, LLC | 0 | -100,00 | 0 | |||||
| 2026-02-13 | 13F | Verition Fund Management LLC | 78.149 | -13,83 | 1.465 | -19,81 | ||||
| 2025-11-21 | 13F | Nebula Research & Development LLC | 0 | -100,00 | 0 | -100,00 | ||||
| 2026-02-11 | 13F | Jpmorgan Chase & Co | 123.293 | -67,35 | 2.312 | -69,62 | ||||
| 2026-02-17 | 13F | Jump Financial, LLC | 123.046 | -70,79 | 2.307 | -72,82 | ||||
| 2026-02-17 | 13F | Royal Bank Of Canada | 5.356 | 70,30 | 100 | 58,73 | ||||
| 2026-03-12 | 13F/A | Peak6 Llc | Call | 88.600 | 47,42 | 1.661 | 37,16 | |||
| 2026-02-12 | 13F | CIBC Private Wealth Group, LLC | 3 | 0,00 | 0 | |||||
| 2026-02-13 | 13F | Sterling Capital Management LLC | 206 | 174,67 | 4 | 200,00 | ||||
| 2025-11-13 | 13F | EntryPoint Capital, LLC | 0 | -100,00 | 0 | |||||
| 2026-02-13 | 13F | Van Eck Associates Corp | 528.750 | 83,00 | 10 | 80,00 | ||||
| 2026-02-04 | 13F | Perkins Capital Management Inc | 28.750 | -75,79 | 539 | -77,47 | ||||
| 2026-02-11 | 13F | LPL Financial LLC | 42.462 | 36,18 | 796 | 26,75 | ||||
| 2026-02-17 | 13F | Altshuler Shaham Ltd | 10 | 0 | ||||||
| 2026-02-12 | 13F | New York State Common Retirement Fund | 8.765 | 0,00 | 164 | -6,82 | ||||
| 2026-02-18 | 13F | GWM Advisors LLC | 0 | -100,00 | 0 | |||||
| 2025-10-23 | 13F | SG Americas Securities, LLC | 0 | -100,00 | 0 | |||||
| 2026-02-17 | 13F | Aqr Capital Management Llc | 30.388 | 21,59 | 570 | 13,12 | ||||
| 2026-01-27 | 13F | Zurcher Kantonalbank (Zurich Cantonalbank) | 17.818 | 73,99 | 334 | 62,14 | ||||
| 2026-02-09 | 13F | Quest Partners LLC | 14.389 | 30,32 | 270 | 21,17 | ||||
| 2026-02-11 | 13F | Gwn Securities Inc. | 18.534 | 348 | ||||||
| 2025-11-14 | 13F | Great Valley Advisor Group, Inc. | 0 | -100,00 | 0 | |||||
| 2026-02-03 | 13F | Mitsubishi UFJ Kokusai Asset Management Co., Ltd. | 380.903 | 7.930 | ||||||
| 2026-02-09 | 13F | Geode Capital Management, Llc | 718.490 | 3,26 | 13.474 | -3,91 | ||||
| 2025-11-14 | 13F | Cubist Systematic Strategies, LLC | Put | 53.300 | 1.074 | |||||
| 2026-02-14 | 13F | Rockefeller Capital Management L.P. | 221 | 4 | ||||||
| 2026-01-29 | 13F | Concord Wealth Partners | 28 | 1 | ||||||
| 2026-02-17 | 13F | Tudor Investment Corp Et Al | 109.744 | 56,19 | 2.058 | 45,37 | ||||
| 2026-02-17 | 13F | Trexquant Investment LP | 76.494 | 77,08 | 1.434 | 64,83 | ||||
| 2025-11-14 | 13F | Cubist Systematic Strategies, LLC | Call | 61.500 | 1.239 | |||||
| 2026-01-29 | 13F | Concurrent Investment Advisors, LLC | 0 | -100,00 | 0 | |||||
| 2026-04-15 | 13F | Exchange Traded Concepts, Llc | 8.550 | 215 | ||||||
| 2026-02-12 | 13F | BlackRock, Inc. | 2.330.294 | -0,33 | 43.693 | -7,25 | ||||
| 2026-04-07 | 13F/A | Round Rock Advisors, LLC | 36.314 | 681 | ||||||
| 2026-02-17 | 13F | Captrust Financial Advisors | 13.512 | -1,20 | 253 | -8,00 | ||||
| 2026-01-14 | 13F | Game Plan Financial Advisors, LLC | 8 | 0,00 | 0 | |||||
| 2026-02-13 | 13F | Walleye Trading LLC | 7.508 | 219,49 | 141 | 197,87 | ||||
| 2026-02-02 | 13F | Principal Financial Group Inc | 96.338 | 48,22 | 1.806 | 37,97 | ||||
| 2025-10-21 | 13F | Signaturefd, Llc | 0 | -100,00 | 0 | -100,00 | ||||
| 2026-02-02 | 13F | Cornerstone Planning Group LLC | 50 | 0,00 | 1 | |||||
| 2026-02-12 | 13F | Renaissance Technologies Llc | 0 | -100,00 | 0 | -100,00 | ||||
| 2026-04-15 | 13F | Bayforest Capital Ltd | 86 | 2 | ||||||
| 2026-02-13 | 13F | Walleye Trading LLC | Put | 14.300 | -39,66 | 268 | -43,82 | |||
| 2026-02-13 | 13F | Walleye Trading LLC | Call | 11.300 | -56,20 | 212 | -59,34 | |||
| 2026-01-29 | 13F | IMC-Chicago, LLC | 28.066 | -18,63 | 526 | -24,32 | ||||
| 2026-01-29 | 13F | Comerica Bank | 0 | -100,00 | 0 | |||||
| 2026-02-10 | 13F | Quantbot Technologies LP | 35.303 | 53,39 | 662 | 42,76 | ||||
| 2026-02-13 | 13F | Ubs Asset Management Americas Inc | 39.177 | 78,89 | 735 | 66,44 | ||||
| 2026-02-12 | 13F | Great Lakes Advisors, Llc | 0 | -100,00 | 0 | |||||
| 2026-01-21 | 13F | Sound Income Strategies, LLC | 200 | 6 | ||||||
| 2026-02-13 | 13F | Centaurus Financial, Inc. | Call | 10.000 | 0,00 | 0 | ||||
| 2026-02-13 | 13F | Centaurus Financial, Inc. | 31.400 | -6,85 | 1 | |||||
| 2026-04-15 | 13F | FNY Investment Advisers, LLC | 5.175 | 0 | ||||||
| 2026-02-13 | 13F | National Bank Of Canada /fi/ | 3.612 | 68 | ||||||
| 2026-02-10 | 13F | Goldman Sachs Group Inc | 155.687 | 16,19 | 2.919 | 8,15 | ||||
| 2026-04-06 | 13F | Versant Capital Management, Inc | 7 | 0 | ||||||
| 2026-02-11 | 13F | Deutsche Bank Ag\ | 213.045 | 795,30 | 3.995 | 733,82 | ||||
| 2026-02-17 | 13F | Per Stirling Capital Management, LLC. | 11.754 | 220 | ||||||
| 2026-02-10 | 13F | Skaana Management L.P. | Put | 4.000 | -38,46 | 75 | -42,31 | |||
| 2026-01-16 | 13F | Ronald Blue Trust, Inc. | 24 | 0 | ||||||
| 2026-02-17 | 13F | DZ BANK AG Deutsche Zentral Genossenschafts Bank, Frankfurt am Main | 10.000 | 188 | ||||||
| 2026-02-17 | 13F | Price T Rowe Associates Inc /md/ | 18.747 | 12,53 | 0 | |||||
| 2026-02-12 | 13F | MetLife Investment Management, LLC | 18.508 | 0,00 | 347 | -6,72 | ||||
| 2026-02-09 | 13F | Legal & General Group Plc | 27.481 | -0,84 | 515 | -7,71 | ||||
| 2026-02-13 | 13F | State Street Corp | 996.019 | 63,33 | 18.675 | 51,99 | ||||
| 2026-02-10 | 13F | Thompson Siegel & Walmsley Llc | 85.634 | -17,04 | 2 | -50,00 | ||||
| 2025-11-12 | 13F | Fox Run Management, L.l.c. | 0 | -100,00 | 0 | |||||
| 2026-04-08 | 13F | West Financial Advisors, LLC | 100 | 3 | ||||||
| 2026-02-17 | 13F | California State Teachers Retirement System | 26.480 | 0,22 | 496 | -6,77 | ||||
| 2026-01-15 | 13F | Nisa Investment Advisors, Llc | 1.675 | 0,00 | 31 | -6,06 | ||||
| 2026-02-17 | 13F | Millennium Management Llc | 956.711 | -10,97 | 17.938 | -17,15 | ||||
| 2026-02-06 | 13F | Legato Capital Management LLC | 43.184 | 9,69 | 810 | 2,02 | ||||
| 2026-02-17 | 13F | Jones Financial Companies Lllp | 5.955 | 133,71 | 112 | 122,00 | ||||
| 2026-02-11 | 13F | Nemes Rush Group LLC | 397 | 7 | ||||||
| 2026-02-17 | 13F | Defiance ETFs, LLC | 16.674 | 322 | ||||||
| 2026-02-13 | 13F | Citigroup Inc | 865 | -98,30 | 16 | -98,44 | ||||
| 2026-02-06 | 13F | Gsa Capital Partners Llp | 18.180 | -24,08 | 0 | |||||
| 2026-02-13 | 13F | Essex Investment Management Co Llc | 133.696 | -2,33 | 2.507 | -9,14 | ||||
| 2026-02-13 | 13F | Barclays Plc | 48.399 | 8,38 | 907 | 0,89 | ||||
| 2026-02-13 | 13F | Manufacturers Life Insurance Company, The | 0 | -100,00 | 0 | |||||
| 2026-01-29 | 13F | UBS Group AG | 171.397 | 57,49 | 3.214 | 46,58 | ||||
| 2026-02-17 | 13F | Optiver Holding B.V. | 125 | -38,73 | 2 | -50,00 | ||||
| 2026-02-13 | 13F | Divisadero Street Capital Management, LP | 0 | -100,00 | 0 | |||||
| 2025-11-14 | 13F | Larson Financial Group LLC | Put | 0 | -100,00 | 0 | -100,00 | |||
| 2026-02-09 | 13F | Hartland & Co., LLC | 55 | 1 | ||||||
| 2026-02-10 | 13F | JTC Employer Solutions Trusteee Ltd | 750 | 0,00 | 0 | |||||
| 2026-02-17 | 13F | Northern Trust Corp | 250.988 | 0,11 | 4.706 | -6,83 | ||||
| 2026-02-17 | 13F | Crawford Fund Management, LLC | Put | 161.000 | 18,38 | 3.019 | 10,15 | |||
| 2026-01-29 | 13F | Vanguard Group Inc | 1.837.002 | 8,21 | 34.444 | 0,69 | ||||
| 2026-02-13 | 13F | Bridgewater Associates, LP | 0 | -100,00 | 0 | |||||
| 2026-02-17 | 13F | Advisor Group Holdings, Inc. | 15.210 | -1,52 | 285 | -4,04 | ||||
| 2026-02-13 | 13F | Sei Investments Co | 29.109 | -18,65 | 546 | -24,41 | ||||
| 2026-02-12 | 13F | StoneX Group Inc. | 0 | -100,00 | 0 | |||||
| 2026-02-17 | 13F | Polar Asset Management Partners Inc. | 11.718 | 0,00 | 0 | |||||
| 2026-01-26 | 13F | Patriot Financial Group Insurance Agency, LLC | 90.648 | -8,71 | 1.700 | -15,05 | ||||
| 2026-02-17 | 13F | Raymond James Financial Inc | 25.609 | 56,37 | 480 | 45,90 | ||||
| 2026-02-12 | 13F | Hrt Financial Lp | 180.311 | 55,46 | 3 | 50,00 | ||||
| 2026-02-19 | 13F | Invesco Ltd. | 253.681 | -5,03 | 4.757 | -11,63 | ||||
| 2025-11-10 | 13F | Axq Capital, Lp | 0 | -100,00 | 0 | |||||
| 2026-01-29 | 13F | UMA Financial Services, Inc. | 118 | 0,00 | 2 | 0,00 | ||||
| 2026-02-02 | 13F | Oppenheimer & Co Inc | 174.763 | -6,52 | 3.277 | -13,01 | ||||
| 2026-02-17 | 13F | Point72 Asset Management, L.P. | Put | 46.600 | 874 | |||||
| 2026-02-13 | 13F | American Century Companies Inc | 43.982 | 13,34 | 825 | 5,51 | ||||
| 2026-02-13 | 13F | GM Advisory Group, Inc. | 67.254 | 1.261 | ||||||
| 2026-02-17 | 13F | Point72 Asset Management, L.P. | Call | 94.200 | 1.766 | |||||
| 2026-04-13 | 13F | LexAurum Advisors, LLC | 8.560 | -15,12 | 215 | 5,91 | ||||
| 2026-02-13 | 13F | Pathstone Holdings, LLC | Call | 1.000 | 0 | |||||
| 2026-02-13 | 13F | Pathstone Holdings, LLC | 43.750 | -0,14 | 820 | -7,03 | ||||
| 2026-02-17 | 13F | Schonfeld Strategic Advisors LLC | 12.673 | 238 | ||||||
| 2025-12-18 | 13F | Danske Bank A/s | 0 | 0 | ||||||
| 2026-01-26 | 13F | Cwm, Llc | 544 | -51,82 | 0 | |||||
| 2026-02-17 | 13F | PharVision Advisers, LLC | 20.567 | 386 | ||||||
| 2026-01-22 | 13F | Financial Consulate, Inc | 500 | 9 | ||||||
| 2026-02-13 | 13F | MAI Capital Management | 339 | 0,00 | 6 | 0,00 | ||||
| 2026-02-18 | 13F | Beacon Pointe Advisors, LLC | 120.860 | -10,38 | 2.266 | -16,60 | ||||
| 2026-02-03 | 13F | SBI Securities Co., Ltd. | 7.151 | -4,56 | 134 | -10,67 | ||||
| 2026-02-17 | 13F | Cetera Investment Advisers | 12.008 | 225 | ||||||
| 2026-02-17 | 13F | Susquehanna International Group, Llp | Put | 190.800 | 289,39 | 3.578 | 262,41 | |||
| 2026-02-17 | 13F | Susquehanna International Group, Llp | Call | 421.700 | 111,48 | 7.907 | 96,81 | |||
| 2026-02-06 | 13F | Larson Financial Group LLC | 197 | -68,83 | 4 | -75,00 | ||||
| 2026-02-10 | 13F | Cercano Management LLC | 1.243.976 | 0,00 | 23.325 | -6,95 | ||||
| 2026-02-17 | 13F | Susquehanna International Group, Llp | 42.173 | -85,33 | 791 | -86,36 | ||||
| 2025-11-12 | 13F | CIBC Bancorp USA Inc. | 10.816 | 218 | ||||||
| 2026-02-12 | 13F | EAM Investors, LLC | 0 | -100,00 | 0 | |||||
| 2026-02-06 | 13F | Global Retirement Partners, LLC | 1.509 | 28 | ||||||
| 2026-02-13 | 13F | Police & Firemen's Retirement System of New Jersey | 8.222 | 0,00 | 154 | -6,67 | ||||
| 2026-02-10 | 13F | Daiwa Securities Group Inc. | 874.389 | 16 | ||||||
| 2026-02-17 | 13F | Two Sigma Investments, Lp | 44.825 | -61,99 | 840 | -64,65 | ||||
| 2025-11-14 | 13F | Divisadero Street Capital Management, LP | Call | 0 | -100,00 | 0 | -100,00 | |||
| 2026-02-13 | 13F | Kestra Advisory Services, LLC | 2.528 | 47 | ||||||
| 2026-02-20 | 13F | Sunbelt Securities, Inc. | 810 | 0,00 | 15 | -6,25 | ||||
| 2026-02-11 | 13F | Ameritas Investment Partners, Inc. | 2.626 | 49 | ||||||
| 2026-01-28 | 13F | Klp Kapitalforvaltning As | 6.000 | 0,00 | 112 | -6,67 | ||||
| 2026-02-06 | 13F | Griffin Asset Management, Inc. | 54.250 | 11,04 | 1.017 | 3,35 | ||||
| 2026-01-13 | 13F | Stonehage Fleming Financial Services Holdings Ltd | 20.669 | 388 | ||||||
| 2026-01-26 | 13F | La Banque Postale Asset Management SA | 497.187 | 37,28 | 9.322 | 27,75 | ||||
| 2025-11-14 | 13F | Virtu Financial LLC | 0 | -100,00 | 0 | |||||
| 2026-01-28 | 13F | WPG Advisers, LLC | 0 | -100,00 | 0 | |||||
| 2026-02-17 | 13F | State Of Wisconsin Investment Board | 12.382 | 232 |