Grundlæggende statistik
| Institutionelle ejere | 98 total, 98 long only, 0 short only, 0 long/short - change of -2,97% MRQ |
| Gennemsnitlig porteføljeallokering | 0.0974 % - change of -72,35% MRQ |
| Institutionelle aktier (lange) | 26.860.987 (ex 13D/G) - change of 0,67MM shares 2,57% MRQ |
| Institutionel værdi (lang) | $ 156.007 USD ($1000) |
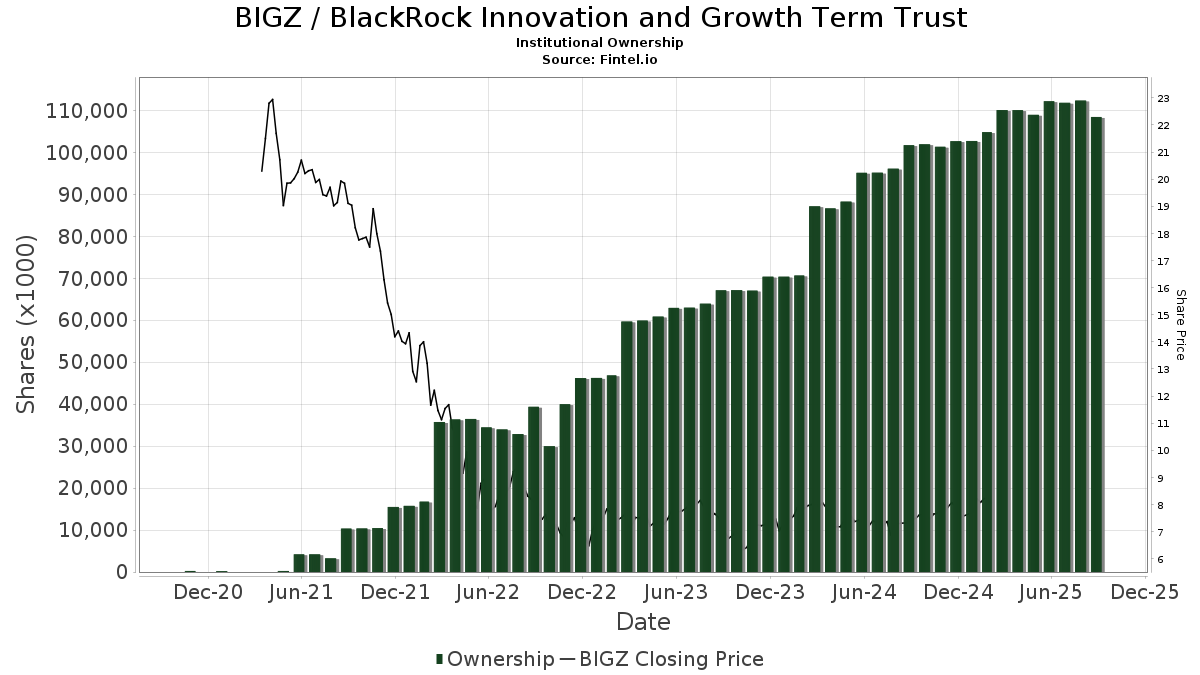
Institutionelt ejerskab og aktionærer
BlackRock Innovation and Growth Term Trust (US:BIGZ) har 98 institutionelle ejere og aktionærer, der har indsendt 13D/G- eller 13F-formularer til Securities Exchange Commission (SEC). Disse institutioner har i alt 26,860,987 aktier. Største aktionærer omfatter Morgan Stanley, Lazard Asset Management Llc, Penserra Capital Management LLC, Invesco Ltd., Raymond James Financial Inc, Quantedge Capital Pte Ltd, Wolverine Asset Management Llc, Readystate Asset Management Lp, Absolute Investment Advisers Llc, and UBS Group AG .
BlackRock Innovation and Growth Term Trust (NYSE:BIGZ) institutionel ejerskabsstruktur viser aktuelle positioner i virksomheden efter institutioner og fonde, samt seneste ændringer i positionsstørrelse. Større aktionærer kan omfatte individuelle investorer, investeringsforeninger, hedgefonde eller institutioner. Skema 13D angiver, at investoren besidder (eller besidder) mere end 5 % af virksomheden og har til hensigt (eller har til hensigt at) aktivt at forfølge en ændring i forretningsstrategi. Skema 13G indikerer en passiv investering på over 5%.
Fondens stemningsscore
Fund Sentiment Score (fka Ownership Accumulation Score) finder de aktier, der bliver mest købt af fonde. Det er resultatet af en sofistikeret, multi-faktor kvantitativ model, der identificerer virksomheder med de højeste niveauer af institutionel akkumulering. Scoringsmodellen bruger en kombination af den samlede stigning i oplyste ejere, ændringerne i porteføljeallokeringer i disse ejere og andre målinger. Tallet går fra 0 til 100, hvor højere tal indikerer et højere niveau af akkumulering for sine jævnaldrende, og 50 er gennemsnittet.
Opdateringsfrekvens: Dagligt
Se Ownership Explorer, som giver en liste over højest rangerende virksomheder.
AI+ Ask Fintel’s AI assistant about BlackRock Innovation and Growth Term Trust.
Select a question to share a public post with an AI-crafted answer.
Thinking of good questions…
Institutionel Put/Call-forhold
Ud over at indberette standardaktie- og gældsudstedelser skal institutter med mere end 100 mill. aktiver under forvaltning også oplyse deres put- og call-optionsbeholdninger. Da salgsoptioner generelt indikerer negativ stemning, og købsoptioner indikerer positiv stemning, kan vi få en fornemmelse af den overordnede institutionelle stemning ved at plotte forholdet mellem put og kald. Diagrammet til højre viser det historiske put/call-forhold for dette instrument.
Brug af Put/Call Ratio som en indikator for investorernes stemning overvinder en af de vigtigste mangler ved at bruge totalt institutionelt ejerskab, som er, at en betydelig mængde af aktiver under forvaltning investeres passivt for at spore indekser. Passivt forvaltede fonde køber typisk ikke optioner, så indikatoren for put/call-forholdet følger mere nøje følelsen af aktivt forvaltede fonde.
13F og NPORT arkivering
Detaljer om 13F-arkivering er gratis. Detaljer om NP-ansøgninger kræver et premium-medlemskab. Grønne rækker angiver nye positioner. Røde rækker angiver lukkede positioner. Klik på linket ikon for at se den fulde transaktionshistorik.
Opgrader
for at låse premium-data op og eksportere til Excel ![]() .
.
| Fil dato | Kilde | Investor | Type | Gennemsnitlig pris (Øst) |
Aktier | Δ Aktier (%) |
Rapporteret Værdi ($1000) |
Δ Værdi (%) |
Port Alloc (%) |
|
|---|---|---|---|---|---|---|---|---|---|---|
| 2026-02-06 | 13F | Ignite Planners, LLC | 11.123 | -16,89 | 74 | -16,85 | ||||
| 2026-02-17 | 13F | Ameriprise Financial Inc | 454.061 | -1,59 | 2.992 | -3,11 | ||||
| 2026-01-28 | 13F | WPG Advisers, LLC | 4.546 | 122,84 | 30 | 123,08 | ||||
| 2026-02-06 | 13F | Cullen/frost Bankers, Inc. | 1.250 | 8 | ||||||
| 2026-02-13 | 13F/A | Virtus ETF Advisers LLC | 0 | -100,00 | 0 | |||||
| 2026-02-17 | 13F | Fountainhead AM, LLC | 0 | -100,00 | 0 | |||||
| 2026-02-17 | 13F | Citadel Advisors Llc | 24.172 | 159 | ||||||
| 2026-01-14 | 13F | TrueMark Investments, LLC | 28.196 | 186 | ||||||
| 2025-11-06 | 13F | CIBC World Markets Inc. | 0 | -100,00 | 0 | -100,00 | ||||
| 2026-02-02 | 13F | Wolverine Asset Management Llc | 773.052 | 46,40 | 5.094 | 44,02 | ||||
| 2025-11-13 | 13F | Css Llc/il | 0 | -100,00 | 0 | -100,00 | ||||
| 2025-11-21 | 13F/A | Alpine Global Management, LLC | 0 | -100,00 | 0 | -100,00 | ||||
| 2026-02-17 | 13F | Northern Trust Corp | 0 | -100,00 | 0 | |||||
| 2025-11-14 | 13F | Rivernorth Capital Management, Llc | 0 | -100,00 | 0 | -100,00 | ||||
| 2026-02-12 | 13F | Advisors Asset Management, Inc. | 514.941 | 20,39 | 3.393 | 18,43 | ||||
| 2026-02-12 | 13F | BlackRock, Inc. | 5.000 | 0,00 | 33 | -3,03 | ||||
| 2025-11-17 | 13F/A | Almitas Capital LLC | 0 | -100,00 | 0 | -100,00 | ||||
| 2026-01-26 | 13F | Merit Financial Group, LLC | 23.549 | 97,79 | 155 | 96,20 | ||||
| 2026-01-23 | 13F | Rsm Us Wealth Management Llc | 38.072 | 254 | ||||||
| 2026-01-29 | 13F | Concurrent Investment Advisors, LLC | 18.181 | -68,33 | 120 | -69,01 | ||||
| 2026-02-12 | 13F | Jane Street Group, Llc | 330.514 | -12,58 | 2.178 | -14,02 | ||||
| 2026-02-09 | 13F | Blue Bell Private Wealth Management, Llc | 240.173 | 86,13 | 1.583 | 83,10 | ||||
| 2026-02-18 | 13F | GWM Advisors LLC | 239.552 | 54,88 | 1.579 | 52,32 | ||||
| 2026-01-28 | 13F | HB Wealth Management, LLC | 0 | -100,00 | 0 | |||||
| 2026-02-17 | 13F | Private Advisor Group, LLC | 193.411 | 37,98 | 1.275 | 35,68 | ||||
| 2026-02-17 | 13F | National Asset Management, Inc. | 0 | -100,00 | 0 | |||||
| 2025-10-22 | 13F | Commonwealth Equity Services, Llc | 0 | -100,00 | 0 | |||||
| 2025-11-12 | 13F | Us Bancorp \de\ | 0 | -100,00 | 0 | -100,00 | ||||
| 2026-01-15 | 13F | Highline Wealth Partners Llc | 500 | 0,00 | 3 | 0,00 | ||||
| 2025-11-14 | 13F | Karpus Management, Inc. | 0 | -100,00 | 0 | -100,00 | ||||
| 2025-11-14 | 13F | Capstone Investment Advisors, Llc | 0 | -100,00 | 0 | -100,00 | ||||
| 2025-10-14 | 13F | Precedent Wealth Partners, Llc | 0 | -100,00 | 0 | -100,00 | ||||
| 2026-02-17 | 13F | Advisor Group Holdings, Inc. | 52.662 | -6,34 | 347 | -9,40 | ||||
| 2026-02-09 | 13F | Accredited Investor Services, Llc | 19.699 | 130 | ||||||
| 2026-01-21 | 13F | 4wealth Advisors, Inc. | 11.021 | 0,00 | 73 | -1,37 | ||||
| 2026-01-05 | 13F | Noble Wealth Management PBC | 0 | -100,00 | 0 | |||||
| 2026-01-14 | 13F | Eastern Bank | 1.867 | 0,00 | 12 | 0,00 | ||||
| 2025-11-06 | 13F | Assetmark, Inc | 0 | -100,00 | 0 | -100,00 | ||||
| 2026-01-08 | 13F | Armstrong Advisory Group, Inc | 0 | -100,00 | 0 | |||||
| 2026-01-26 | 13F | Shaker Financial Services, LLC | 194.268 | 34,91 | 1.280 | 32,78 | ||||
| 2025-10-22 | 13F | Geneos Wealth Management Inc. | 0 | -100,00 | 0 | -100,00 | ||||
| 2026-02-13 | 13F | Quarry LP | 170.066 | 1.121 | ||||||
| 2026-02-13 | 13F | Mariner, LLC | 35.162 | 86,56 | 232 | 83,33 | ||||
| 2026-02-11 | 13F | Janney Montgomery Scott LLC | 81.194 | 4,64 | 1 | |||||
| 2026-02-17 | 13F | Royal Bank Of Canada | 384.147 | -17,26 | 2.531 | -18,62 | ||||
| 2026-01-28 | 13F | City State Bank | 12.913 | 0,00 | 85 | -1,16 | ||||
| 2025-11-14 | 13F | Tower Research Capital LLC (TRC) | 0 | -100,00 | 0 | -100,00 | ||||
| 2026-02-11 | 13F | Closed-End Fund Advisors, Inc. | 15.624 | 103 | ||||||
| 2025-11-13 | 13F | K2 Principal Fund, L.p. | 0 | -100,00 | 0 | -100,00 | ||||
| 2026-02-17 | 13F | Bank Of America Corp /de/ | 417.254 | -29,28 | 2.750 | -30,46 | ||||
| 2026-02-17 | 13F | Readystate Asset Management Lp | 686.666 | 102,76 | 4.525 | 99,43 | ||||
| 2026-01-15 | 13F | SILVER OAK SECURITIES, Inc | 13.548 | 90 | ||||||
| 2026-02-17 | 13F | Lazard Asset Management Llc | 3.378.783 | 22.266 | ||||||
| 2025-11-14 | 13F | Hbk Investments L P | 0 | -100,00 | 0 | -100,00 | ||||
| 2026-02-03 | 13F | NewEdge Wealth, LLC | 10.767 | 0,00 | 71 | -5,41 | ||||
| 2026-02-17 | 13F | Quantedge Capital Pte Ltd | 887.079 | 471,10 | 5.846 | 462,02 | ||||
| 2026-02-17 | 13F | Creative Planning | 0 | -100,00 | 0 | -100,00 | ||||
| 2025-11-14 | 13F | Bulldog Investors, LLP | 0 | -100,00 | 0 | -100,00 | ||||
| 2026-02-10 | 13F/A | Northwestern Mutual Wealth Management Co | 1.235 | 13,82 | 8 | 14,29 | ||||
| 2025-11-04 | 13F | Tsfg, Llc | 0 | -100,00 | 0 | |||||
| 2026-02-12 | 13F | Hrt Financial Lp | 0 | -100,00 | 0 | |||||
| 2026-02-13 | 13F | Pinnacle Wealth Planning Services, Inc. | 10.913 | 72 | ||||||
| 2025-11-12 | 13F | Principal Securities, Inc. | 0 | -100,00 | 0 | -100,00 | ||||
| 2025-11-14 | 13F | 1607 Capital Partners, LLC | 0 | -100,00 | 0 | -100,00 | ||||
| 2025-11-06 | 13F | Ameritas Advisory Services, LLC | 0 | -100,00 | 0 | -100,00 | ||||
| 2025-11-14 | 13F | Elequin Capital Lp | 0 | -100,00 | 0 | -100,00 | ||||
| 2026-01-21 | 13F | Newbridge Financial Services Group, Inc. | 0 | -100,00 | 0 | |||||
| 2026-01-26 | 13F | PFG Investments, LLC | 17.315 | 1,73 | 114 | 0,00 | ||||
| 2026-01-28 | 13F | Absolute Investment Advisers Llc | 633.924 | 4.302 | ||||||
| 2026-02-17 | 13F | Virtus Investment Advisers, Inc. | 108.899 | -19,04 | 718 | -20,42 | ||||
| 2026-02-03 | 13F | RFG Advisory, LLC | 28.331 | 3,66 | 187 | 1,64 | ||||
| 2026-01-14 | 13F | Ballew Advisors, Inc | 0 | -100,00 | 0 | |||||
| 2026-02-06 | 13F | Global Retirement Partners, LLC | 26.661 | 176 | ||||||
| 2026-02-12 | 13F | Kovack Advisors, Inc. | 18.809 | 125 | ||||||
| 2026-01-29 | 13F | UBS Group AG | 596.389 | -14,12 | 3.930 | -15,52 | ||||
| 2026-02-17 | 13F | Evolve Private Wealth, Llc | 21.518 | 142 | ||||||
| 2026-02-12 | 13F | DRW Securities, LLC | 0 | -100,00 | 0 | |||||
| 2026-02-23 | 13F | Virtu Financial LLC | 39.399 | 0 | ||||||
| 2026-02-17 | 13F | Susquehanna Advisors Group, Inc. | 10.600 | 0,00 | 70 | -2,82 | ||||
| 2026-02-11 | 13F | J.w. Cole Advisors, Inc. | 11.067 | 2,35 | 73 | 0,00 | ||||
| 2025-11-14 | 13F | Sessa Capital IM, L.P. | 0 | -100,00 | 0 | -100,00 | ||||
| 2026-01-14 | 13F | Redhawk Wealth Advisors, Inc. | 0 | -100,00 | 0 | |||||
| 2026-02-17 | 13F | Quantinno Capital Management LP | 174.020 | 6,10 | 1.147 | 4,37 | ||||
| 2026-02-17 | 13F | Advisory Services Network, LLC | 0 | -100,00 | 0 | |||||
| 2025-11-14 | 13F | Harris Associates L P | 0 | -100,00 | 0 | |||||
| 2026-02-12 | 13F | Steward Partners Investment Advisory, Llc | 23.627 | -50,66 | 156 | -51,56 | ||||
| 2025-11-13 | 13F | Yakira Capital Management, Inc. | 0 | -100,00 | 0 | -100,00 | ||||
| 2025-10-29 | 13F | CF Capital LLC | 0 | -100,00 | 0 | |||||
| 2026-02-13 | 13F | Wells Fargo & Company/mn | 40.850 | 29,75 | 269 | 28,10 | ||||
| 2025-10-20 | 13F | Allspring Global Investments Holdings, LLC | 0 | -100,00 | 0 | -100,00 | ||||
| 2025-11-13 | 13F | Dymon Asia Capital (singapore) Pte. Ltd. | 0 | -100,00 | 0 | -100,00 | ||||
| 2026-02-06 | 13F | HighTower Advisors, LLC | 71.896 | 0,20 | 474 | -1,46 | ||||
| 2026-01-28 | 13F | Barrett & Company, Inc. | 11.343 | 0,00 | 75 | -1,33 | ||||
| 2026-02-10 | 13F | Lido Advisors, LLC | 20.109 | 64,96 | 134 | 64,20 | ||||
| 2025-11-14 | 13F | D. E. Shaw & Co., Inc. | 0 | -100,00 | 0 | |||||
| 2025-11-14 | 13F | Saba Capital Management, L.P. | 0 | -100,00 | 0 | -100,00 | ||||
| 2026-01-12 | 13F | Seacrest Wealth Management, Llc | 65.460 | 0,59 | 446 | -1,33 | ||||
| 2026-02-17 | 13F | Raymond James Financial Inc | 916.449 | -31,77 | 6.039 | -32,89 | ||||
| 2026-01-30 | 13F | Chapin Davis, Inc. | 69.499 | -25,35 | 458 | -26,65 | ||||
| 2026-02-02 | 13F | Oppenheimer & Co Inc | 222.520 | -3,27 | 1.466 | -4,87 | ||||
| 2026-02-09 | 13F | Hartland & Co., LLC | 0 | -100,00 | 0 | |||||
| 2026-02-10 | 13F | Goldman Sachs Group Inc | 0 | -100,00 | 0 | |||||
| 2025-10-07 | 13F | Thurston, Springer, Miller, Herd & Titak, Inc. | 0 | -100,00 | 0 | -100,00 | ||||
| 2026-02-17 | 13F | Wiley Bros.-aintree Capital, Llc | 12.366 | -15,36 | 81 | -16,49 | ||||
| 2026-02-02 | 13F | Mutual Advisors, LLC | 33.425 | -8,24 | 220 | -8,71 | ||||
| 2026-02-12 | 13F | Marex Group plc | 0 | -100,00 | 0 | |||||
| 2026-02-17 | 13F | Millennium Management Llc | 0 | -100,00 | 0 | |||||
| 2025-11-13 | 13F | Prevail Innovative Wealth Advisors, Llc | 0 | -100,00 | 0 | -100,00 | ||||
| 2026-02-12 | 13F | SWAN Capital LLC | 340 | 0,00 | 2 | 0,00 | ||||
| 2026-01-22 | 13F/A | Cresset Asset Management, LLC | 0 | -100,00 | 0 | |||||
| 2026-01-29 | 13F | Sanctuary Advisors, LLC | 92.067 | 33,13 | 607 | 30,89 | ||||
| 2026-01-26 | 13F | Cwm, Llc | 9.781 | 1,91 | 0 | |||||
| 2026-02-13 | 13F | MAI Capital Management | 684 | 0,00 | 5 | 0,00 | ||||
| 2026-01-29 | 13F | Comerica Bank | 7.876 | 11,54 | 52 | 8,51 | ||||
| 2026-02-05 | 13F | Plancorp, LLC | 10.000 | 0,00 | 66 | -2,99 | ||||
| 2026-01-05 | 13F | Chesapeake Asset Management Llc | 0 | -100,00 | 0 | -100,00 | ||||
| 2025-11-04 | 13F | Pineridge Advisors LLC | 1.350 | 0,00 | 9 | 0,00 | ||||
| 2026-02-13 | 13F | Morgan Stanley | 7.293.873 | 35,97 | 48.067 | 33,74 | ||||
| 2026-02-17 | 13F | Balyasny Asset Management Llc | 0 | -100,00 | 0 | |||||
| 2026-02-17 | 13F | SageView Advisory Group, LLC | 2.040 | 13 | ||||||
| 2026-02-12 | 13F | Insigneo Advisory Services, Llc | 0 | -100,00 | 0 | -100,00 | ||||
| 2026-02-12 | 13F | Penserra Capital Management LLC | 3.017.237 | 10,20 | 20 | 5,56 | ||||
| 2026-02-13 | 13F | Thomas J. Herzfeld Advisors, Inc. | 543.195 | 3.580 | ||||||
| 2026-02-10 | 13F | Bank of New York Mellon Corp | 10.778 | 0,00 | 71 | -1,39 | ||||
| 2026-01-06 | 13F | Investors Research Corp | 848 | 0,00 | 6 | 0,00 | ||||
| 2026-01-12 | 13F | Amplius Wealth Advisors, LLC | 11.845 | 78 | ||||||
| 2026-02-19 | 13F | Invesco Ltd. | 1.811.362 | 13,22 | 11.937 | 11,36 | ||||
| 2026-02-17 | 13F | Cetera Investment Advisers | 13.378 | -35,46 | 88 | -36,23 | ||||
| 2026-01-21 | 13F | Sowell Financial Services LLC | 10.211 | 1,75 | 67 | 0,00 | ||||
| 2026-02-03 | 13F | International Assets Investment Management, Llc | 11.034 | 73 | ||||||
| 2026-01-09 | 13F | Tactive Advisors, LLC | 15.021 | -7,04 | 99 | -9,26 | ||||
| 2026-02-04 | 13F | Atlantic Union Bankshares Corp | 2.447 | 0,00 | 16 | 0,00 | ||||
| 2025-11-10 | 13F | Dakota Wealth Management | 0 | -100,00 | 0 | -100,00 | ||||
| 2026-02-17 | 13F | Susquehanna International Group, Llp | 90.441 | 119,18 | 596 | 115,94 | ||||
| 2026-01-05 | 13F | Park Avenue Securities Llc | 17.958 | 0 | ||||||
| 2026-02-13 | 13F | Kestra Advisory Services, LLC | 5.749 | 38 | ||||||
| 2026-02-13 | 13F | Pine Valley Investments Ltd Liability Co | 0 | -100,00 | 0 | |||||
| 2026-01-23 | 13F | Successful Portfolios LLC | 15.475 | 0,65 | 105 | 1,94 | ||||
| 2025-11-26 | 13F/A | Jpmorgan Chase & Co | 0 | -100,00 | 0 | -100,00 | ||||
| 2026-01-29 | 13F | Matisse Capital | 571.000 | 3,63 | 3.763 | 1,92 | ||||
| 2026-02-13 | 13F | Barclays Plc | 0 | -100,00 | 0 | |||||
| 2026-01-21 | 13F | Modera Wealth Management, LLC | 19.083 | -19,08 | 126 | -20,89 | ||||
| 2026-02-14 | 13F | Rockefeller Capital Management L.P. | 328.501 | -4,43 | 2.165 | -6,04 | ||||
| 2025-11-07 | 13F | Pnc Financial Services Group, Inc. | 0 | -100,00 | 0 | -100,00 | ||||
| 2026-02-12 | 13F | Wedbush Securities Inc | 55.731 | -15,99 | 0 | |||||
| 2026-02-13 | 13F | Stifel Financial Corp | 89.439 | -24,07 | 589 | -25,35 | ||||
| 2026-02-13 | 13F | City Of London Investment Management Co Ltd | 21.000 | 138 | ||||||
| 2026-02-03 | 13F | Indivisible Partners | 40.604 | 268 | ||||||
| 2026-02-11 | 13F | LPL Financial LLC | 93.620 | -34,48 | 617 | -35,63 | ||||
| 2026-02-13 | 13F | Change Path, LLC | 16.483 | 9,74 | 109 | 8,00 | ||||
| 2026-02-11 | 13F | Prestige Wealth Management Group LLC | 47 | 0,00 | 0 | |||||
| 2026-02-13 | 13F | Level Four Advisory Services, Llc | 13.987 | 2,58 | 92 | 1,10 | ||||
| 2025-09-29 | NP | VPC - Virtus Private Credit Strategy ETF | 140.903 | 5,42 | 1.031 | 23,03 | ||||
| 2026-01-30 | 13F | Caldwell Trust Co | 1.000 | -50,00 | 7 | -53,85 | ||||
| 2026-03-16 | 13F | Osbon Capital Management Llc | 1.200 | 8 | ||||||
| 2026-01-12 | 13F | David J Yvars Group | 13.762 | 0,95 | 91 | -1,10 | ||||
| 2025-11-13 | 13F | Sit Investment Associates Inc | 0 | -100,00 | 0 | -100,00 |
Other Listings
| US:BTX | 6,60 $ |