Grundlæggende statistik
| Institutionelle ejere | 138 total, 138 long only, 0 short only, 0 long/short - change of 6,98% MRQ |
| Gennemsnitlig porteføljeallokering | 1.3079 % - change of -6,17% MRQ |
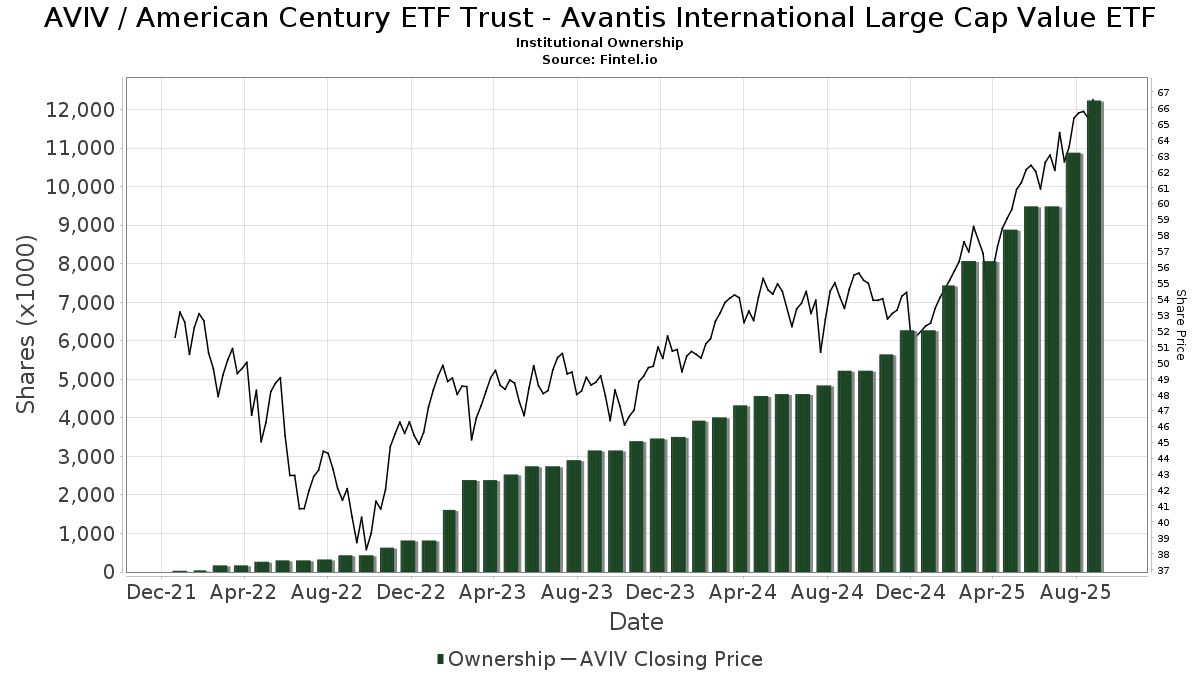
| Institutionelle aktier (lange) | 12.234.217 (ex 13D/G) - change of 2,75MM shares 28,95% MRQ |
| Institutionel værdi (lang) | $ 683.998 USD ($1000) |
Institutionelt ejerskab og aktionærer
American Century ETF Trust - Avantis International Large Cap Value ETF (US:AVIV) har 138 institutionelle ejere og aktionærer, der har indsendt 13D/G- eller 13F-formularer til Securities Exchange Commission (SEC). Disse institutioner har i alt 12,234,217 aktier. Største aktionærer omfatter American Century Companies Inc, PrairieView Partners, LLC, AVNM - Avantis All International Markets Equity ETF, IAG Wealth Partners, LLC, AVGE - Avantis All Equity Markets ETF, AVGV - Avantis All Equity Markets Value ETF, Atwood & Palmer Inc, Buckingham Strategic Partners, B&D White Capital Company, LLC, and Financial Advisory Service, Inc. .
American Century ETF Trust - Avantis International Large Cap Value ETF (ARCA:AVIV) institutionel ejerskabsstruktur viser aktuelle positioner i virksomheden efter institutioner og fonde, samt seneste ændringer i positionsstørrelse. Større aktionærer kan omfatte individuelle investorer, investeringsforeninger, hedgefonde eller institutioner. Skema 13D angiver, at investoren besidder (eller besidder) mere end 5 % af virksomheden og har til hensigt (eller har til hensigt at) aktivt at forfølge en ændring i forretningsstrategi. Skema 13G indikerer en passiv investering på over 5%.
The share price as of September 16, 2025 is 67,24 / share. Previously, on September 17, 2024, the share price was 54,61 / share. This represents an increase of 23,13% over that period.
Fondens stemningsscore
Fund Sentiment Score (fka Ownership Accumulation Score) finder de aktier, der bliver mest købt af fonde. Det er resultatet af en sofistikeret, multi-faktor kvantitativ model, der identificerer virksomheder med de højeste niveauer af institutionel akkumulering. Scoringsmodellen bruger en kombination af den samlede stigning i oplyste ejere, ændringerne i porteføljeallokeringer i disse ejere og andre målinger. Tallet går fra 0 til 100, hvor højere tal indikerer et højere niveau af akkumulering for sine jævnaldrende, og 50 er gennemsnittet.
Opdateringsfrekvens: Dagligt
Se Ownership Explorer, som giver en liste over højest rangerende virksomheder.
Institutionel Put/Call-forhold
Ud over at indberette standardaktie- og gældsudstedelser skal institutter med mere end 100 mill. aktiver under forvaltning også oplyse deres put- og call-optionsbeholdninger. Da salgsoptioner generelt indikerer negativ stemning, og købsoptioner indikerer positiv stemning, kan vi få en fornemmelse af den overordnede institutionelle stemning ved at plotte forholdet mellem put og kald. Diagrammet til højre viser det historiske put/call-forhold for dette instrument.
Brug af Put/Call Ratio som en indikator for investorernes stemning overvinder en af de vigtigste mangler ved at bruge totalt institutionelt ejerskab, som er, at en betydelig mængde af aktiver under forvaltning investeres passivt for at spore indekser. Passivt forvaltede fonde køber typisk ikke optioner, så indikatoren for put/call-forholdet følger mere nøje følelsen af aktivt forvaltede fonde.
13F og NPORT arkivering
Detaljer om 13F-arkivering er gratis. Detaljer om NP-ansøgninger kræver et premium-medlemskab. Grønne rækker angiver nye positioner. Røde rækker angiver lukkede positioner. Klik på linket ikon for at se den fulde transaktionshistorik.
Opgrader
for at låse premium-data op og eksportere til Excel ![]() .
.
| Fil dato | Kilde | Investor | Type | Gennemsnitlig pris (Øst) |
Aktier | Δ Aktier (%) |
Rapporteret Værdi ($1000) |
Δ Værdi (%) |
Port Alloc (%) |
|
|---|---|---|---|---|---|---|---|---|---|---|
| 2025-08-14 | 13F | Citadel Advisors Llc | 3.372 | -92,92 | 210 | -92,25 | ||||
| 2025-07-10 | 13F | Financial Management Network Inc | 95.950 | 13,88 | 6.008 | 40,64 | ||||
| 2025-07-28 | NP | AVGE - Avantis All Equity Markets ETF | 492.586 | 8,76 | 30.393 | 19,97 | ||||
| 2025-07-07 | 13F | Fox Hill Wealth Management | 7.069 | -1,05 | 440 | 8,66 | ||||
| 2025-08-14 | 13F | Beaird Harris Wealth Management, LLC | 123.963 | -1,10 | 7.715 | 8,59 | ||||
| 2025-07-10 | 13F | Websterrogers Financial Advisors, Llc | 207.757 | 1,75 | 12.930 | 11,73 | ||||
| 2025-08-13 | 13F | Greenwich Wealth Management LLC | 12.970 | 0,00 | 1 | |||||
| 2025-08-13 | 13F | Satovsky Asset Management Llc | 8.057 | 501 | ||||||
| 2025-08-13 | 13F | Cresset Asset Management, LLC | 0 | -100,00 | 0 | |||||
| 2025-08-12 | 13F | Pathstone Holdings, LLC | 15.947 | 1,83 | 992 | 11,84 | ||||
| 2025-07-21 | 13F | Life Planning Partners, Inc | 3.920 | 0,00 | 244 | 9,46 | ||||
| 2025-08-14 | 13F | Comerica Bank | 1.463 | 0,00 | 91 | 10,98 | ||||
| 2025-07-17 | 13F | Stone Point Wealth LLC | 9.518 | -9,94 | 592 | -1,00 | ||||
| 2025-07-14 | 13F | Harbor Group, Inc. | 23.877 | 147,79 | 1.486 | 171,98 | ||||
| 2025-08-11 | 13F | Ritter Daniher Financial Advisory LLC / DE | 23.597 | -10,91 | 1.469 | -2,20 | ||||
| 2025-07-28 | NP | AVNV - Avantis All International Markets Value ETF | 271.183 | 661,77 | 16.732 | 740,33 | ||||
| 2025-04-29 | 13F | Callan Capital, LLC | 26.949 | -1,70 | 1.527 | 7,38 | ||||
| 2025-08-13 | 13F | Jones Financial Companies Lllp | 141.107 | 122,77 | 8.761 | 142,08 | ||||
| 2025-08-15 | 13F | Keel Point, LLC | 6.669 | 0,59 | 415 | 10,67 | ||||
| 2025-08-01 | 13F | Zhang Financial LLC | 5.654 | 352 | ||||||
| 2025-07-24 | 13F | Etesian Wealth Advisors, Inc. | 6.268 | 0,00 | 390 | 9,86 | ||||
| 2025-08-04 | 13F | Haven Private, LLC | 57.275 | 18,16 | 3.565 | 29,74 | ||||
| 2025-08-04 | 13F | McMill Wealth Management | 37.249 | -7,21 | 2.318 | 1,85 | ||||
| 2025-08-04 | 13F | Linscomb & Williams, Inc. | 160.875 | 13,47 | 10.012 | 24,60 | ||||
| 2025-07-18 | 13F | TruNorth Capital Management, LLC | 1.202 | 0,00 | 75 | 8,82 | ||||
| 2025-07-28 | 13F | Harbour Investments, Inc. | 4.081 | 7,54 | 254 | 17,67 | ||||
| 2025-07-29 | 13F | Private Trust Co Na | 4.613 | 0,00 | 287 | 9,96 | ||||
| 2025-08-14 | 13F | Aqr Capital Management Llc | 29.127 | 0,00 | 1.813 | 9,82 | ||||
| 2025-08-14 | 13F | Susquehanna International Group, Llp | 8.734 | 544 | ||||||
| 2025-07-25 | 13F | Ruedi Wealth Management, Inc. | 0 | -100,00 | 0 | |||||
| 2025-08-14 | 13F | Navigoe, LLC | 60.780 | 7,41 | 4 | 0,00 | ||||
| 2025-08-08 | 13F | Tortoise Investment Management, LLC | 91.349 | 3,66 | 5.685 | 13,84 | ||||
| 2025-07-22 | 13F | Global Strategic Investment Solutions, LLC | 229.102 | -3,43 | 14.258 | 6,04 | ||||
| 2025-07-22 | 13F | SOL Capital Management CO | 9.120 | -1,62 | 1 | |||||
| 2025-07-15 | 13F | Financial Partners Group, Inc | 3.736 | 233 | ||||||
| 2025-07-14 | 13F | Northland Capital Management LLC | 98.318 | -7,45 | 6.119 | 1,61 | ||||
| 2025-07-16 | 13F | Plancorp, LLC | 48.325 | 1,98 | 3.008 | 11,99 | ||||
| 2025-08-13 | 13F | Flow Traders U.s. Llc | 0 | -100,00 | 0 | |||||
| 2025-08-12 | 13F | Pfc Capital Group, Inc. | 18.750 | 114,68 | 1 | |||||
| 2025-07-15 | 13F | Evanson Asset Management, LLC | 15.336 | 1,25 | 954 | 11,19 | ||||
| 2025-07-17 | 13F | Sterneck Capital Management, LLC | 3.674 | 229 | ||||||
| 2025-07-16 | 13F | TCI Wealth Advisors, Inc. | 4.028 | -1,13 | 251 | 8,70 | ||||
| 2025-05-13 | 13F | BlackDiamond Wealth Management Inc. | 0 | -100,00 | 0 | |||||
| 2025-07-17 | 13F | Porter White Investment Advisors, Inc. | 4.631 | 0,00 | 288 | 9,92 | ||||
| 2025-07-16 | 13F | Paragon Capital Management Ltd | 3.254 | 203 | ||||||
| 2025-08-05 | 13F | Cherry Tree Wealth Management, LLC | 1.130 | -5,36 | 70 | 4,48 | ||||
| 2025-08-08 | 13F | Pnc Financial Services Group, Inc. | 53 | 3 | ||||||
| 2025-08-13 | 13F | EverSource Wealth Advisors, LLC | 640 | 40 | ||||||
| 2025-07-30 | 13F | Canvas Wealth Advisors, LLC | 11.522 | 76,04 | 727 | 94,12 | ||||
| 2025-08-13 | 13F | Northwestern Mutual Wealth Management Co | 65.348 | -2,47 | 4.067 | 7,08 | ||||
| 2025-08-14 | 13F | UBS Group AG | 374 | 0,00 | 23 | 9,52 | ||||
| 2025-07-25 | 13F | PrairieView Partners, LLC | 1.064.106 | -1,75 | 66 | 8,20 | ||||
| 2025-07-10 | 13F | Wealth Enhancement Advisory Services, Llc | 13.633 | 95,85 | 854 | 116,50 | ||||
| 2025-07-31 | 13F | Buckingham Strategic Partners | 433.163 | 148,24 | 26.958 | 172,57 | ||||
| 2025-08-08 | 13F | Larson Financial Group LLC | 514 | 0,00 | 32 | 6,90 | ||||
| 2025-08-07 | 13F | Fonville Wealth Management LLC | 96.668 | 8,74 | 6.016 | 17,50 | ||||
| 2025-07-10 | 13F | Anderson Hoagland & Co | 54.351 | 11,38 | 3.383 | 37,87 | ||||
| 2025-07-10 | 13F | Fortress Wealth Management, Inc. | 5.069 | 35,53 | 316 | 49,29 | ||||
| 2025-07-17 | 13F | Symmetry Partners, LLC | 101.255 | 23,72 | 6.302 | 35,86 | ||||
| 2025-07-18 | 13F | Foundry Financial Group, Inc. | 234.500 | 28,33 | 14.594 | 40,91 | ||||
| 2025-07-03 | 13F | Collective Family Office Llc | 74.641 | 1,65 | 4.645 | 11,63 | ||||
| 2025-07-30 | 13F | TFB Advisors LLC | 5.920 | 0,00 | 368 | 9,85 | ||||
| 2025-07-28 | NP | AVMA - Avantis Moderate Allocation ETF | 18.330 | -7,15 | 1.131 | 2,36 | ||||
| 2025-07-28 | 13F | Dixon Fnancial Services, Inc. | 21.740 | 0,00 | 1.353 | 9,74 | ||||
| 2025-08-14 | 13F | Jane Street Group, Llc | 267.344 | 609,25 | 16.638 | 678,93 | ||||
| 2025-08-15 | 13F | Morgan Stanley | 3.369 | 248,40 | 210 | 287,04 | ||||
| 2025-08-13 | 13F | B&D White Capital Company, LLC | 283.748 | 105,70 | 17.659 | 125,88 | ||||
| 2025-07-28 | NP | AVGV - Avantis All Equity Markets Value ETF | 478.524 | 10,47 | 29.525 | 21,86 | ||||
| 2025-07-10 | 13F | Pacific Asset Management, LLC | 19.901 | 1,29 | 1.239 | 11,23 | ||||
| 2025-07-11 | 13F/A | Umb Bank N A/mo | 20.969 | 0,64 | 1.305 | 10,59 | ||||
| 2025-08-11 | 13F | Principal Securities, Inc. | 1.054 | -13,68 | 66 | 3,17 | ||||
| 2025-04-21 | 13F | Envestnet Portfolio Solutions, Inc. | 0 | -100,00 | 0 | |||||
| 2025-04-18 | 13F | Creative Capital Management Investments LLC | 0 | -100,00 | 0 | |||||
| 2025-07-03 | 13F | Lam Group, Inc. | 20.100 | 7,89 | 1.251 | 18,48 | ||||
| 2025-08-12 | 13F | LPL Financial LLC | 127.501 | 108,05 | 7.935 | 128,48 | ||||
| 2025-07-30 | 13F | Clune & Associates, Ltd. | 63.104 | 0,62 | 3.927 | 10,50 | ||||
| 2025-08-14 | 13F | Cardiff Park Advisors, Llc | 10.908 | 1,61 | 679 | 11,51 | ||||
| 2025-07-11 | 13F | Farther Finance Advisors, LLC | 227 | 0,00 | 14 | 16,67 | ||||
| 2025-07-29 | 13F | Chicago Partners Investment Group LLC | 95.044 | -0,46 | 6.125 | 8,64 | ||||
| 2025-07-24 | 13F | IFP Advisors, Inc | 100 | 0,00 | 6 | 20,00 | ||||
| 2025-08-12 | 13F | Burk Holdings LLC | 8.964 | 558 | ||||||
| 2025-08-08 | 13F | Creative Planning | 33.899 | 0,05 | 2.110 | 9,84 | ||||
| 2025-08-07 | 13F | Nwam Llc | 93.928 | -5,48 | 5.846 | 3,78 | ||||
| 2025-08-07 | 13F | CENTRAL TRUST Co | 1.890 | 118 | ||||||
| 2025-08-14 | 13F | Colony Group, LLC | 99.209 | 0,82 | 6.174 | 10,70 | ||||
| 2025-08-01 | 13F | Red Lighthouse Investment Management, Llc | 30 | 2 | ||||||
| 2025-07-29 | 13F | Werba Rubin Papier Wealth Management | 43.527 | -3,80 | 2.709 | 5,62 | ||||
| 2025-08-13 | 13F | Mayfair Advisory Group, LLC | 7.974 | 13,41 | 513 | 28,89 | ||||
| 2025-07-16 | 13F | Moisand Fitzgerald Tamayo, LLC | 10.208 | -10,70 | 635 | -1,85 | ||||
| 2025-08-12 | 13F | Proequities, Inc. | 0 | 0 | ||||||
| 2025-07-31 | 13F | Cambridge Investment Research Advisors, Inc. | 4.425 | 18,79 | 0 | |||||
| 2025-08-14 | 13F | Betterment LLC | 4.179 | 0 | ||||||
| 2025-08-05 | 13F | Astra Wealth Partners LLC | 14.900 | 0,00 | 927 | 9,83 | ||||
| 2025-07-11 | 13F | Prosperity Planning, Inc. | 51.656 | 12,08 | 3.215 | 23,05 | ||||
| 2025-08-12 | 13F | Jacobi Capital Management LLC | 23.121 | 11,36 | 1.439 | 22,28 | ||||
| 2025-05-15 | 13F | Gts Securities Llc | 0 | -100,00 | 0 | |||||
| 2025-08-08 | 13F | Austin Wealth Management, LLC | 189.173 | 35,47 | 11.774 | 45,48 | ||||
| 2025-08-06 | 13F | Entrewealth, Llc | 41.866 | 27,48 | 2.606 | 39,98 | ||||
| 2025-09-04 | 13F/A | Advisor Group Holdings, Inc. | 5.220 | 10,78 | 325 | 21,72 | ||||
| 2025-08-14 | 13F | Mml Investors Services, Llc | 6.703 | -4,79 | 0 | |||||
| 2025-07-25 | 13F | LRI Investments, LLC | 20.908 | 0,00 | 1.301 | 9,79 | ||||
| 2025-07-18 | 13F | PBMares Wealth Management LLC | 0 | -100,00 | 0 | |||||
| 2025-07-17 | 13F | Catalytic Wealth RIA, LLC | 13.184 | 45,28 | 821 | 59,53 | ||||
| 2025-07-31 | 13F | Brighton Jones Llc | 4.967 | 0,00 | 309 | 9,96 | ||||
| 2025-08-04 | 13F | Hantz Financial Services, Inc. | 469 | 0,00 | 0 | |||||
| 2025-07-16 | 13F | Meredith Wealth Planning | 18.151 | -11,56 | 1.130 | -2,92 | ||||
| 2025-08-14 | 13F | Raymond James Financial Inc | 13.669 | 851 | ||||||
| 2025-08-08 | 13F | Schwarz Dygos Wheeler Investment Advisors Llc | 6.984 | 9,38 | 435 | 20,22 | ||||
| 2025-07-09 | 13F | Emprise Bank | 4.765 | -6,24 | 297 | 2,78 | ||||
| 2025-08-12 | 13F | AlphaCore Capital LLC | 24.358 | 1.516 | ||||||
| 2025-07-31 | 13F | Oppenheimer & Co Inc | 8.176 | 22,36 | 509 | 34,39 | ||||
| 2025-07-17 | 13F | Oceanside Advisors LLC | 15.245 | 0,47 | 949 | 10,36 | ||||
| 2025-07-24 | 13F | Ronald Blue Trust, Inc. | 937 | 0,00 | 58 | 9,43 | ||||
| 2025-08-13 | 13F | IAG Wealth Partners, LLC | 539.447 | -0,62 | 33.572 | 9,12 | ||||
| 2025-08-14 | 13F | Royal Bank Of Canada | 741 | 46 | ||||||
| 2025-08-14 | 13F | Wells Fargo & Company/mn | 551 | 104,07 | 34 | 126,67 | ||||
| 2025-08-12 | 13F | Global Retirement Partners, LLC | 103 | 836,36 | 6 | |||||
| 2025-08-06 | 13F | Commonwealth Equity Services, Llc | 33.324 | 14,06 | 2 | 100,00 | ||||
| 2025-08-08 | 13F | Altiora Financial Group, LLC | 6.800 | 0,00 | 423 | 9,87 | ||||
| 2025-07-24 | 13F | WMG Financial Advisors, LLC | 4.600 | 0,00 | 286 | 10,00 | ||||
| 2025-05-16 | 13F/A | Kestra Investment Management, LLC | 0 | -100,00 | 0 | |||||
| 2025-08-12 | 13F | Prosperitas Financial LLC | 4.644 | 2,74 | 289 | 12,89 | ||||
| 2025-08-01 | 13F | Envestnet Asset Management Inc | 99.246 | 29,94 | 6.177 | 42,67 | ||||
| 2025-07-21 | 13F | Keb Asset Management, Llc | 9.736 | 606 | ||||||
| 2025-07-15 | 13F | Total Wealth Planning, Llc | 56.735 | -2,37 | 3.531 | 7,20 | ||||
| 2025-07-21 | 13F | Verus Financial Partners, Inc. | 13.825 | 1,81 | 871 | 15,06 | ||||
| 2025-08-12 | 13F | Nemes Rush Group LLC | 4.078 | 21,15 | 254 | 33,16 | ||||
| 2025-08-14 | 13F | Financial Advisory Service, Inc. | 280.322 | 2,58 | 17.446 | 12,64 | ||||
| 2025-07-10 | 13F | Cypress Point Wealth Management, LLC | 26.605 | -0,24 | 1.656 | 9,53 | ||||
| 2025-07-25 | 13F | Cwm, Llc | 11.734 | -1,80 | 1 | |||||
| 2025-08-15 | 13F | CI Private Wealth, LLC | 58.724 | 1.517,74 | 3.655 | 1.682,44 | ||||
| 2025-07-23 | 13F | Allegiance Financial Group Advisory Services LLC | 250.568 | 7,86 | 15.594 | 18,44 | ||||
| 2025-08-14 | 13F | Warren Averett Asset Management, LLC | 4.835 | 301 | ||||||
| 2025-08-07 | 13F | Tillman Hartley LLC | 24.584 | -0,52 | 1.530 | 9,21 | ||||
| 2025-08-21 | 13F | Aveo Capital Partners, LLC | 0 | -100,00 | 0 | |||||
| 2025-07-31 | 13F | Insight Wealth Partners, LLC | 11.713 | 8,42 | 729 | 18,95 | ||||
| 2025-08-06 | 13F | ORBA Wealth Advisors, L.L.C. | 34.071 | -19,90 | 2.120 | -12,03 | ||||
| 2025-08-07 | 13F | Addison Advisors LLC | 1.835 | -2,65 | 114 | 7,55 | ||||
| 2025-08-12 | 13F | Jpmorgan Chase & Co | 0 | -100,00 | 0 | |||||
| 2025-04-28 | 13F | Redmont Wealth Advisors Llc | 1.848 | -96,34 | 105 | -96,04 | ||||
| 2025-07-08 | 13F | Atwood & Palmer Inc | 468.898 | 2,78 | 29.182 | 12,86 | ||||
| 2025-07-30 | 13F | Forum Financial Management, LP | 4.789 | 0,00 | 298 | 9,96 | ||||
| 2025-08-12 | 13F | American Century Companies Inc | 2.126.943 | 54,81 | 132.370 | 69,98 | ||||
| 2025-07-23 | 13F | Wealth Management Nebraska | 80.463 | -0,06 | 4.996 | 9,47 | ||||
| 2025-07-10 | 13F | Wedmont Private Capital | 40.669 | 47,48 | 2.563 | 70,41 | ||||
| 2025-07-15 | 13F | Vestment Financial LLC | 45.390 | 4,69 | 2.838 | 15,23 | ||||
| 2025-08-05 | 13F | Golden Bell Financial Planning LLC | 114.272 | -6,88 | 7.112 | 2,24 | ||||
| 2025-05-06 | 13F | Venturi Wealth Management, LLC | 0 | -100,00 | 0 | |||||
| 2025-07-28 | NP | AVNM - Avantis All International Markets Equity ETF | 1.000.479 | 170,61 | 61.730 | 198,53 | ||||
| 2025-07-30 | 13F | Bayshore Asset Management, Llc | 119.335 | 2,33 | 7.427 | 12,36 | ||||
| 2025-08-07 | 13F | Atala Financial Inc | 3.340 | 0,00 | 208 | 9,52 |