Grundlæggende statistik
| Porteføljeværdi | $ 215.985 |
| Nuværende stillinger | 82 |
Seneste beholdninger, ydeevne, AUM (fra 13F, 13D)
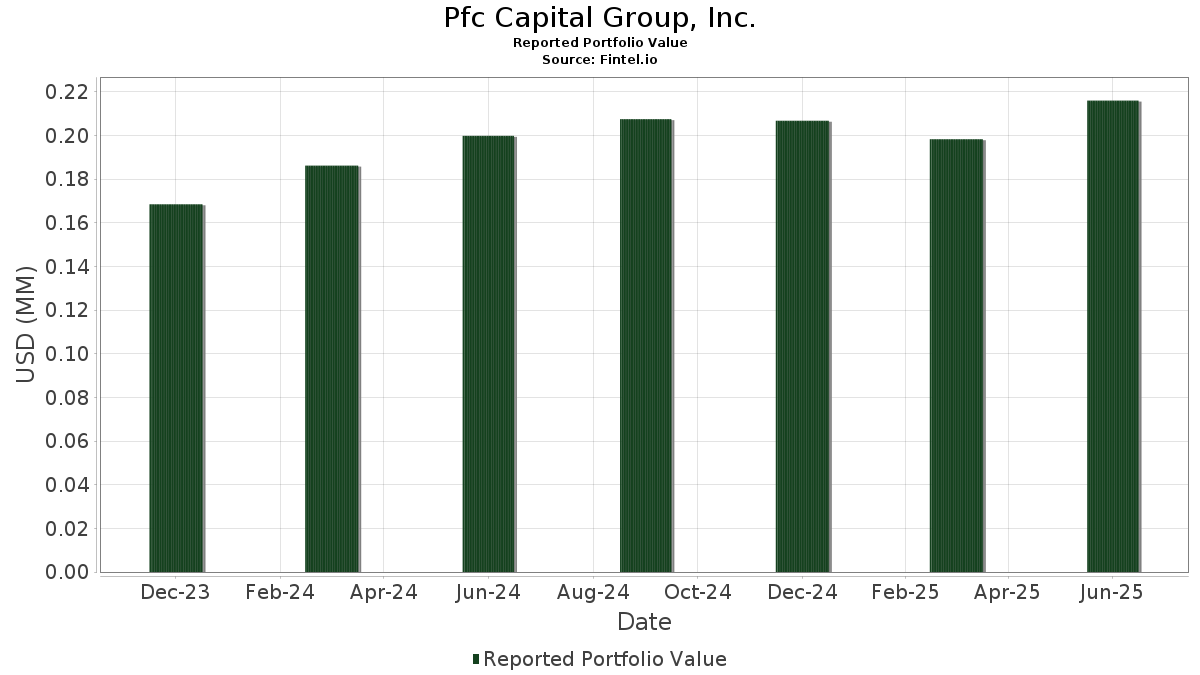
Pfc Capital Group, Inc. har afsløret 82 samlede besiddelser i deres seneste SEC-arkivering. Den seneste porteføljeværdi er beregnet til at være $ 215.985 USD. Faktiske aktiver under forvaltning (AUM) er denne værdi plus kontanter (som ikke er oplyst). Pfc Capital Group, Inc.s største beholdninger er Microsoft Corporation (US:MSFT) , Apple Inc. (US:AAPL) , NVIDIA Corporation (US:NVDA) , SPDR S&P 500 ETF (US:SPY) , and QUALCOMM Incorporated (US:QCOM) . Pfc Capital Group, Inc.s nye stillinger omfatter Vanguard STAR Funds - Vanguard Total International Stock ETF (US:VXUS) , .
Top øger dette kvartal
Vi bruger ændringen i porteføljeallokeringen, fordi dette er den mest meningsfulde metrik. Ændringer kan skyldes handler eller ændringer i aktiekurser.
| Sikkerhed | Aktier (MM) |
Værdi (MM$) |
Portefølje % | ΔPortefølje % |
|---|---|---|---|---|
| 0,10 | 0,02 | 7,3561 | 1,7273 | |
| 0,05 | 0,02 | 11,1198 | 1,3959 | |
| 0,01 | 0,00 | 2,0909 | 1,1004 | |
| 0,04 | 0,00 | 1,1987 | 0,6525 | |
| 0,04 | 0,00 | 1,1126 | 0,6153 | |
| 0,04 | 0,00 | 1,0894 | 0,5957 | |
| 0,05 | 0,00 | 1,0825 | 0,5852 | |
| 0,03 | 0,00 | 1,0640 | 0,5637 | |
| 0,03 | 0,00 | 1,0552 | 0,5584 | |
| 0,05 | 0,00 | 0,6153 | 0,3208 |
Top falder i dette kvartal
Vi bruger ændringen i porteføljeallokeringen, fordi dette er den mest meningsfulde metrik. Ændringer kan skyldes handler eller ændringer i aktiekurser.
| Sikkerhed | Aktier (MM) |
Værdi (MM$) |
Portefølje % | ΔPortefølje % |
|---|---|---|---|---|
| 0,09 | 0,02 | 8,8071 | -2,0445 | |
| 0,04 | 0,00 | 1,9983 | -0,6378 | |
| 0,07 | 0,01 | 5,3948 | -0,6056 | |
| 0,01 | 0,00 | 2,0265 | -0,5758 | |
| 0,02 | 0,00 | 1,2015 | -0,5415 | |
| 0,02 | 0,00 | 1,8020 | -0,4226 | |
| 0,02 | 0,01 | 2,9257 | -0,4210 | |
| 0,01 | 0,00 | 0,5982 | -0,3106 | |
| 0,01 | 0,00 | 0,7487 | -0,2544 | |
| 0,00 | 0,00 | 0,3056 | -0,2416 |
13F og Fondsarkivering
Denne formular blev indsendt den 2025-08-12 for rapporteringsperioden 2025-06-30. Klik på linkikonet for at se den fulde transaktionshistorik.
Opgrader for at låse op for premium-data og eksportere til Excel ![]() .
.
| Sikkerhed | Type | Gennemsnitlig aktiekurs | Aktier (MM) |
Δ Aktier (%) |
Δ Aktier (%) |
Værdi ($MM) |
Portefølje (%) |
ΔPortefølje (%) |
|
|---|---|---|---|---|---|---|---|---|---|
| MSFT / Microsoft Corporation | 0,05 | -5,99 | 0,02 | 26,32 | 11,1198 | 1,3959 | |||
| AAPL / Apple Inc. | 0,09 | -4,28 | 0,02 | -9,52 | 8,8071 | -2,0445 | |||
| NVDA / NVIDIA Corporation | 0,10 | -2,35 | 0,02 | 36,36 | 7,3561 | 1,7273 | |||
| SPY / SPDR S&P 500 ETF | 0,02 | -1,85 | 0,02 | 15,38 | 6,9662 | -0,0333 | |||
| QCOM / QUALCOMM Incorporated | 0,07 | -5,54 | 0,01 | 0,00 | 5,3948 | -0,6056 | |||
| AMZN / Amazon.com, Inc. | 0,04 | -8,64 | 0,01 | 0,00 | 4,5554 | -0,1545 | |||
| HD / The Home Depot, Inc. | 0,02 | -4,82 | 0,01 | 0,00 | 2,9257 | -0,4210 | |||
| GOOGL / Alphabet Inc. | 0,03 | -5,14 | 0,01 | 20,00 | 2,8150 | -0,0218 | |||
| COST / Costco Wholesale Corporation | 0,01 | -1,74 | 0,01 | 0,00 | 2,6465 | -0,1566 | |||
| QQQ / Invesco QQQ Trust, Series 1 | 0,01 | -3,37 | 0,01 | 25,00 | 2,3594 | 0,0985 | |||
| VOO / Vanguard Index Funds - Vanguard S&P 500 ETF | 0,01 | 108,06 | 0,00 | 300,00 | 2,0909 | 1,1004 | |||
| LLY / Eli Lilly and Company | 0,01 | -10,12 | 0,00 | -20,00 | 2,0265 | -0,5758 | |||
| CHD / Church & Dwight Co., Inc. | 0,04 | -5,41 | 0,00 | -20,00 | 1,9983 | -0,6378 | |||
| GJR / Strats Trust For Procter & Gambel Security - Preferred Security | 0,02 | -5,61 | 0,00 | -25,00 | 1,8020 | -0,4226 | |||
| META / Meta Platforms, Inc. | 0,00 | -2,92 | 0,00 | 50,00 | 1,6797 | 0,2081 | |||
| ADP / Automatic Data Processing, Inc. | 0,01 | -3,06 | 0,00 | 0,00 | 1,5913 | -0,1799 | |||
| WMT / Walmart Inc. | 0,03 | -2,94 | 0,00 | 50,00 | 1,4575 | -0,0111 | |||
| PEP / PepsiCo, Inc. | 0,02 | -14,73 | 0,00 | -33,33 | 1,2015 | -0,5415 | |||
| BND / Vanguard Bond Index Funds - Vanguard Total Bond Market ETF | 0,04 | 138,49 | 0,00 | 100,00 | 1,1987 | 0,6525 | |||
| AVES / American Century ETF Trust - Avantis Emerging Markets Value ETF | 0,04 | 114,58 | 0,00 | 1,1126 | 0,6153 | ||||
| VEA / Vanguard Tax-Managed Funds - Vanguard FTSE Developed Markets ETF | 0,04 | 114,29 | 0,00 | 1,0894 | 0,5957 | ||||
| VWO / Vanguard International Equity Index Funds - Vanguard FTSE Emerging Markets ETF | 0,05 | 116,78 | 0,00 | 1,0825 | 0,5852 | ||||
| JPM / JPMorgan Chase & Co. | 0,01 | -5,24 | 0,00 | 0,00 | 1,0677 | 0,0293 | |||
| AVLV / American Century ETF Trust - Avantis U.S. Large Cap Value ETF | 0,03 | 121,42 | 0,00 | 1,0640 | 0,5637 | ||||
| PANW / Palo Alto Networks, Inc. | 0,01 | -7,23 | 0,00 | 0,00 | 1,0616 | 0,0222 | |||
| AVUV / American Century ETF Trust - Avantis U.S. Small Cap Value ETF | 0,03 | 121,37 | 0,00 | 1,0552 | 0,5584 | ||||
| GOOGL / Alphabet Inc. | 0,01 | -7,89 | 0,00 | 0,00 | 1,0255 | -0,0426 | |||
| KO / The Coca-Cola Company | 0,03 | -5,45 | 0,00 | 0,00 | 1,0140 | -0,1687 | |||
| V / Visa Inc. | 0,01 | -4,94 | 0,00 | -50,00 | 0,9209 | -0,1205 | |||
| CRM / Salesforce, Inc. | 0,01 | -8,42 | 0,00 | -50,00 | 0,8973 | -0,1532 | |||
| AMD / Advanced Micro Devices, Inc. | 0,01 | -16,18 | 0,00 | 0,00 | 0,8255 | 0,0489 | |||
| ITW / Illinois Tool Works Inc. | 0,01 | -1,39 | 0,00 | 0,00 | 0,8130 | -0,0877 | |||
| CSCO / Cisco Systems, Inc. | 0,02 | -2,70 | 0,00 | 0,00 | 0,7681 | 0,0036 | |||
| MCD / McDonald's Corporation | 0,01 | -6,65 | 0,00 | 0,00 | 0,7598 | -0,1879 | |||
| JNJ / Johnson & Johnson | 0,01 | -11,71 | 0,00 | 0,00 | 0,7487 | -0,2544 | |||
| AMGN / Amgen Inc. | 0,00 | -9,40 | 0,00 | 0,00 | 0,6352 | -0,2166 | |||
| SCHP / Schwab Strategic Trust - Schwab U.S. TIPS ETF | 0,05 | 129,25 | 0,00 | 0,6153 | 0,3208 | ||||
| DIS / The Walt Disney Company | 0,01 | -14,31 | 0,00 | 0,00 | 0,6093 | -0,0075 | |||
| UNP / Union Pacific Corporation | 0,01 | -3,57 | 0,00 | 0,00 | 0,5987 | -0,0958 | |||
| SBUX / Starbucks Corporation | 0,01 | -23,21 | 0,00 | 0,00 | 0,5982 | -0,3106 | |||
| CAT / Caterpillar Inc. | 0,00 | -14,69 | 0,00 | 0,00 | 0,5570 | -0,0472 | |||
| AVDV / American Century ETF Trust - Avantis International Small Cap Value ETF | 0,02 | 112,27 | 0,00 | 0,5547 | 0,3045 | ||||
| AVIV / American Century ETF Trust - Avantis International Large Cap Value ETF | 0,02 | 114,68 | 0,00 | 0,5399 | 0,2902 | ||||
| ETN / Eaton Corporation plc | 0,00 | -17,02 | 0,00 | 0,00 | 0,5227 | 0,0002 | |||
| AVGO / Broadcom Inc. | 0,00 | -2,79 | 0,00 | 0,5195 | 0,1659 | ||||
| LIN / Linde plc | 0,00 | -12,34 | 0,00 | 0,00 | 0,5028 | -0,1175 | |||
| EMR / Emerson Electric Co. | 0,01 | -9,51 | 0,00 | 0,4542 | 0,0048 | ||||
| MA / Mastercard Incorporated | 0,00 | 0,00 | 0,00 | 0,4398 | -0,0277 | ||||
| GS / The Goldman Sachs Group, Inc. | 0,00 | 0,86 | 0,00 | 0,4223 | 0,0702 | ||||
| INTU / Intuit Inc. | 0,00 | -11,76 | 0,00 | 0,4102 | 0,0158 | ||||
| UPS / United Parcel Service, Inc. | 0,01 | -11,67 | 0,00 | 0,3713 | -0,1280 | ||||
| AXP / American Express Company | 0,00 | -6,44 | 0,00 | 0,3537 | 0,0062 | ||||
| RTX / RTX Corporation | 0,01 | -13,23 | 0,00 | 0,3486 | -0,0483 | ||||
| BRK.B / Berkshire Hathaway Inc. | 0,00 | -0,60 | 0,00 | 0,3380 | -0,0680 | ||||
| BRK.A / Berkshire Hathaway Inc. | 0,00 | 0,00 | 0,00 | 0,3371 | -0,0654 | ||||
| BNDX / Vanguard Charlotte Funds - Vanguard Total International Bond ETF | 0,01 | 137,36 | 0,00 | 0,3301 | 0,1808 | ||||
| VTI / Vanguard Index Funds - Vanguard Total Stock Market ETF | 0,00 | 21,55 | 0,00 | 0,3236 | 0,0614 | ||||
| EFX / Equifax Inc. | 0,00 | 0,00 | 0,00 | 0,3181 | -0,0072 | ||||
| CVX / Chevron Corporation | 0,00 | -28,93 | 0,00 | -100,00 | 0,3056 | -0,2416 | |||
| BAC / Bank of America Corporation | 0,01 | -25,22 | 0,00 | 0,3028 | -0,0865 | ||||
| ORCL / Oracle Corporation | 0,00 | -8,38 | 0,00 | 0,2963 | 0,0714 | ||||
| BLK / BlackRock, Inc. | 0,00 | -10,64 | 0,00 | 0,2894 | -0,0289 | ||||
| XOM / Exxon Mobil Corporation | 0,01 | -20,27 | 0,00 | 0,2676 | -0,1353 | ||||
| TSLA / Tesla, Inc. | 0,00 | 0,00 | 0,00 | 0,2616 | 0,0291 | ||||
| NUE / Nucor Corporation | 0,00 | -27,61 | 0,00 | 0,2195 | -0,0877 | ||||
| NSC / Norfolk Southern Corporation | 0,00 | -7,90 | 0,00 | 0,2139 | -0,0201 | ||||
| LMT / Lockheed Martin Corporation | 0,00 | -10,79 | 0,00 | 0,2125 | -0,0376 | ||||
| WFC / Wells Fargo & Company | 0,01 | -2,63 | 0,00 | 0,2102 | -0,0006 | ||||
| GEHC / GE HealthCare Technologies Inc. | 0,01 | -36,21 | 0,00 | 0,1764 | -0,1519 | ||||
| HON / Honeywell International Inc. | 0,00 | -44,45 | 0,00 | 0,1625 | -0,1275 | ||||
| PLTR / Palantir Technologies Inc. | 0,00 | -5,59 | 0,00 | 0,1597 | 0,0458 | ||||
| SO / The Southern Company | 0,00 | 0,00 | 0,00 | 0,1338 | -0,0119 | ||||
| VYM / Vanguard Whitehall Funds - Vanguard High Dividend Yield ETF | 0,00 | -0,63 | 0,00 | 0,1255 | -0,0077 | ||||
| SYY / Sysco Corporation | 0,00 | -15,38 | 0,00 | 0,1153 | -0,0320 | ||||
| TMUS / T-Mobile US, Inc. | 0,00 | 0,00 | 0,00 | 0,1102 | -0,0240 | ||||
| DHR / Danaher Corporation | 0,00 | -59,30 | 0,00 | 0,1088 | -0,1943 | ||||
| VXUS / Vanguard STAR Funds - Vanguard Total International Stock ETF | 0,00 | 0,00 | 0,1046 | 0,1046 | |||||
| BA / The Boeing Company | 0,00 | 0,00 | 0,1032 | 0,1032 | |||||
| TJX / The TJX Companies, Inc. | 0,00 | -12,50 | 0,00 | 0,1000 | -0,0225 | ||||
| AVRE / American Century ETF Trust - Avantis Real Estate ETF | 0,00 | 0,00 | 0,00 | 0,0102 | -0,0004 | ||||
| VTV / Vanguard Index Funds - Vanguard Value ETF | 0,00 | 0,00 | 0,00 | 0,0088 | -0,0008 | ||||
| VUG / Vanguard Index Funds - Vanguard Growth ETF | 0,00 | 0,00 | 0,00 | 0,0032 | 0,0002 | ||||
| BMY / Bristol-Myers Squibb Company | 0,00 | -100,00 | 0,00 | 0,0000 | |||||
| MRK / Merck & Co., Inc. | 0,00 | -100,00 | 0,00 | 0,0000 | |||||
| ABBV / AbbVie Inc. | 0,00 | -100,00 | 0,00 | 0,0000 | |||||
| DD / DuPont de Nemours, Inc. | 0,00 | -100,00 | 0,00 | 0,0000 | |||||
| TMO / Thermo Fisher Scientific Inc. | 0,00 | -100,00 | 0,00 | 0,0000 | |||||
| SCHX / Schwab Strategic Trust - Schwab U.S. Large-Cap ETF | 0,00 | -100,00 | 0,00 | 0,0000 |