Grundlæggende statistik
| Institutionelle aktier (lange) | 118.425.559 - 82,78% (ex 13D/G) - change of -36,58MM shares -23,60% MRQ |
| Institutionel værdi (lang) | $ 3.951.962 USD ($1000) |
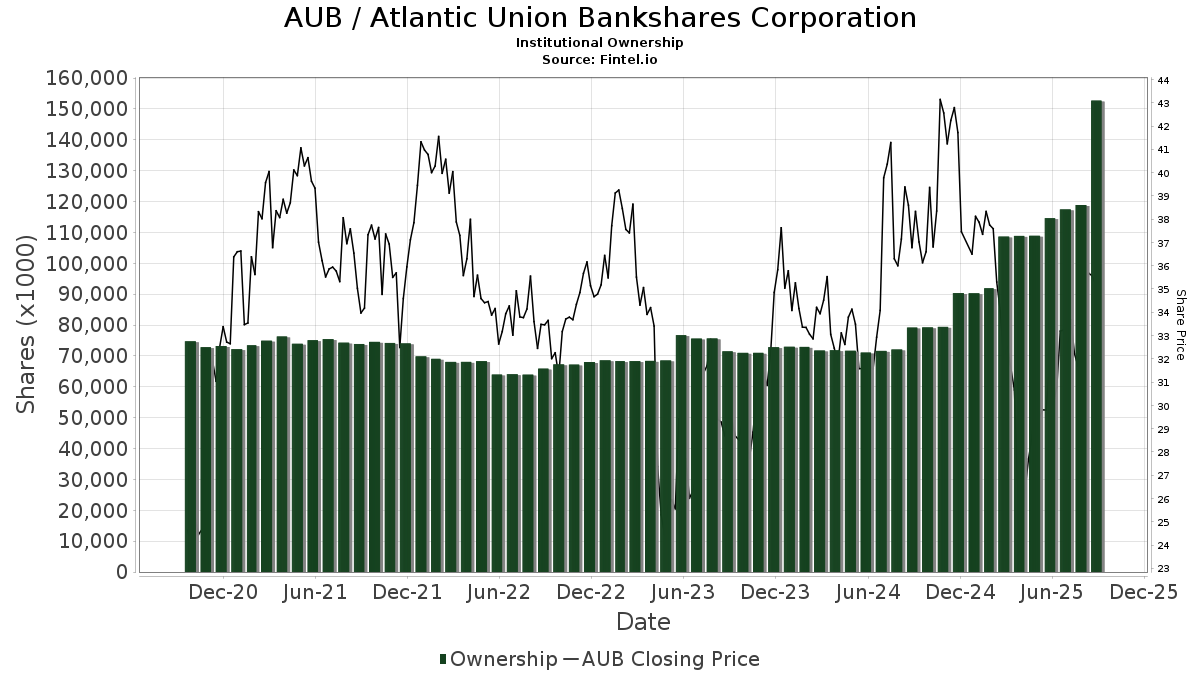
Institutionelt ejerskab og aktionærer
Atlantic Union Bankshares Corporation (US:AUB) har 409 institutionelle ejere og aktionærer, der har indsendt 13D/G- eller 13F-formularer til Securities Exchange Commission (SEC). Disse institutioner har i alt 118,425,559 aktier. Største aktionærer omfatter BlackRock, Inc., Vanguard Group Inc, Dimensional Fund Advisors Lp, State Street Corp, North Reef Capital Management LP, Geode Capital Management, Llc, Franklin Resources Inc, Earnest Partners Llc, American Century Companies Inc, and Westwood Holdings Group Inc .
Atlantic Union Bankshares Corporation (NYSE:AUB) institutionel ejerskabsstruktur viser aktuelle positioner i virksomheden efter institutioner og fonde, samt seneste ændringer i positionsstørrelse. Større aktionærer kan omfatte individuelle investorer, investeringsforeninger, hedgefonde eller institutioner. Skema 13D angiver, at investoren besidder (eller besidder) mere end 5 % af virksomheden og har til hensigt (eller har til hensigt at) aktivt at forfølge en ændring i forretningsstrategi. Skema 13G indikerer en passiv investering på over 5%.
The share price as of April 9, 2026 is 38,78 / share. Previously, on April 10, 2025, the share price was 23,89 / share. This represents an increase of 62,33% over that period.
Fondens stemningsscore
Fund Sentiment Score (fka Ownership Accumulation Score) finder de aktier, der bliver mest købt af fonde. Det er resultatet af en sofistikeret, multi-faktor kvantitativ model, der identificerer virksomheder med de højeste niveauer af institutionel akkumulering. Scoringsmodellen bruger en kombination af den samlede stigning i oplyste ejere, ændringerne i porteføljeallokeringer i disse ejere og andre målinger. Tallet går fra 0 til 100, hvor højere tal indikerer et højere niveau af akkumulering for sine jævnaldrende, og 50 er gennemsnittet.
Opdateringsfrekvens: Dagligt
Se Ownership Explorer, som giver en liste over højest rangerende virksomheder.
AI+ Ask Fintel’s AI assistant about Atlantic Union Bankshares Corporation.
Select a question to share a public post with an AI-crafted answer.
Thinking of good questions…
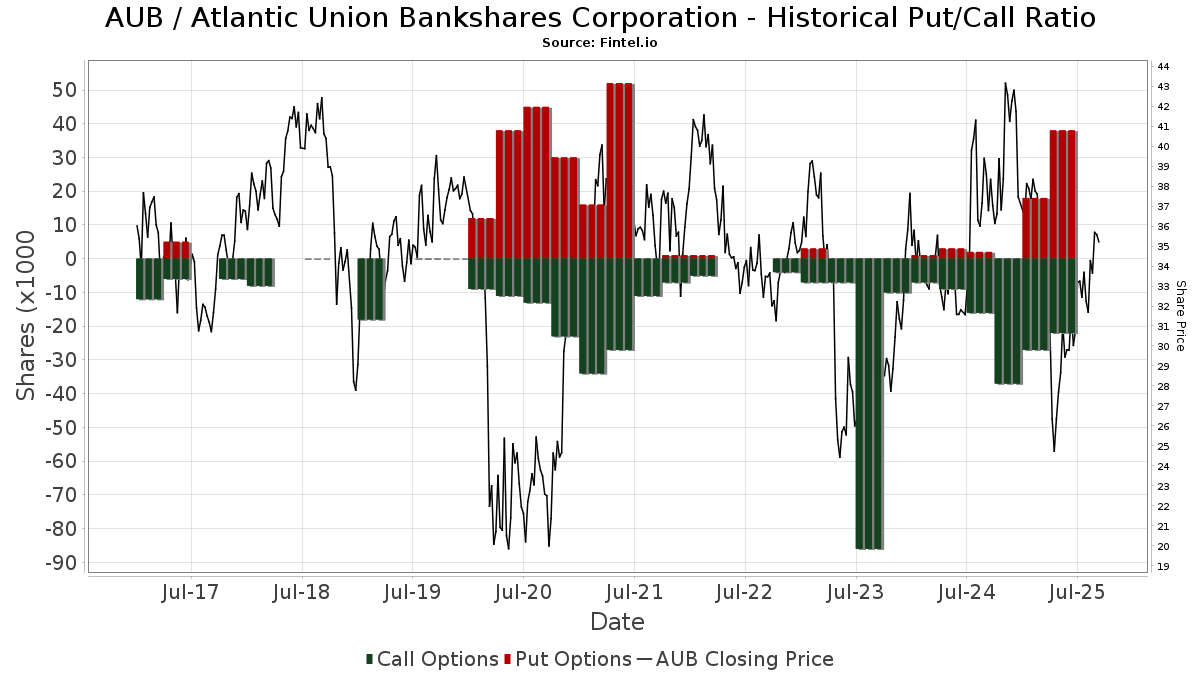
Institutionel Put/Call-forhold
Ud over at indberette standardaktie- og gældsudstedelser skal institutter med mere end 100 mill. aktiver under forvaltning også oplyse deres put- og call-optionsbeholdninger. Da salgsoptioner generelt indikerer negativ stemning, og købsoptioner indikerer positiv stemning, kan vi få en fornemmelse af den overordnede institutionelle stemning ved at plotte forholdet mellem put og kald. Diagrammet til højre viser det historiske put/call-forhold for dette instrument.
Brug af Put/Call Ratio som en indikator for investorernes stemning overvinder en af de vigtigste mangler ved at bruge totalt institutionelt ejerskab, som er, at en betydelig mængde af aktiver under forvaltning investeres passivt for at spore indekser. Passivt forvaltede fonde køber typisk ikke optioner, så indikatoren for put/call-forholdet følger mere nøje følelsen af aktivt forvaltede fonde.
13D/G-arkivering
Vi præsenterer 13D/G ansøgninger separat fra 13F ansøgninger på grund af den forskellige behandling af SEC. 13D/G-ansøgninger kan indgives af grupper af investorer (med én ledende), hvorimod 13F-ansøgninger ikke kan. Dette resulterer i situationer, hvor en investor kan indsende en 13D/G, der rapporterer én værdi for de samlede aktier (der repræsenterer alle de aktier, der ejes af investorgruppen), men derefter indsender en 13F, der rapporterer en anden værdi for de samlede aktier (der udelukkende repræsenterer deres egne) ejendomsret). Det betyder, at aktieejerskab af 13D/G-arkiver og 13F-arkiveringer ofte ikke er direkte sammenlignelige, så vi præsenterer dem separat.
Bemærk: Fra den 16. maj 2021 viser vi ikke længere ejere, der ikke har indsendt en 13D/G inden for det seneste år. Tidligere viste vi den fulde historie af 13D/G-arkiver. Generelt skal enheder, der er forpligtet til at indgive 13D/G-ansøgninger, indgive mindst årligt, før de indsender en afsluttende ansøgning. Dog forlader fonde nogle gange positioner uden at indsende en afsluttende ansøgning (dvs. de afvikler), så visning af den fulde historie resulterede nogle gange i forvirring om det nuværende ejerskab. For at undgå forvirring viser vi nu kun 'aktuelle' ejere - det vil sige - ejere, der har anmeldt inden for det seneste år.
Upgrade to unlock premium data.
| Fil dato | Form | Investor | Forrige Aktier |
Seneste Aktier |
Δ Aktier (Procent) |
Ejendomsret (Procent) |
Δ Ejerskab (Procent) |
|
|---|---|---|---|---|---|---|---|---|
| 2025-10-30 | VANGUARD GROUP INC | 9,290,826 | 16,161,484 | 73.95 | 11.34 | -8.47 | ||
| 2025-08-11 | STATE STREET CORP | 5,942,809 | 7,400,456 | 24.53 | 5.20 | -21.21 | ||
| 2025-07-15 | DIMENSIONAL FUND ADVISORS LP | 4,917,690 | 7,839,696 | 59.42 | 5.50 | -16.67 | ||
| 2025-05-05 | BlackRock, Inc. | 13,021,910 | 18,960,082 | 45.60 | 14.40 | 44.72 |
13F og NPORT arkivering
Detaljer om 13F-arkivering er gratis. Detaljer om NP-ansøgninger kræver et premium-medlemskab. Grønne rækker angiver nye positioner. Røde rækker angiver lukkede positioner. Klik på linket ikon for at se den fulde transaktionshistorik.
Opgrader
for at låse premium-data op og eksportere til Excel ![]() .
.
| Fil dato | Kilde | Investor | Type | Gennemsnitlig pris (Øst) |
Aktier | Δ Aktier (%) |
Rapporteret Værdi ($1000) |
Δ Værdi (%) |
Port Alloc (%) |
|
|---|---|---|---|---|---|---|---|---|---|---|
| 2026-01-20 | 13F | Sovran Advisors, LLC | 31.386 | 1.204 | ||||||
| 2026-01-22 | 13F | Financial Consulate, Inc | 1.354 | -71,07 | 48 | -71,52 | ||||
| 2026-02-12 | 13F | DRW Securities, LLC | 16.643 | 587 | ||||||
| 2026-02-17 | 13F | Nomura Holdings Inc | 0 | -100,00 | 0 | |||||
| 2026-02-17 | 13F | Jones Financial Companies Lllp | 37.945 | 9,96 | 1.339 | 7,90 | ||||
| 2025-11-14 | 13F | Ieq Capital, Llc | 0 | -100,00 | 0 | |||||
| 2026-01-27 | 13F | Deroy & Devereaux Private Investment Counsel Inc | 118.725 | -2,22 | 4 | 0,00 | ||||
| 2026-01-26 | 13F | Hendershot Investments Inc. | 7.444 | 0,00 | 263 | 0,00 | ||||
| 2026-01-22 | 13F | Red Tortoise LLC | 243 | 0,00 | 9 | 0,00 | ||||
| 2026-02-13 | 13F | State Street Corp | 7.138.553 | -2,67 | 251.991 | -2,64 | ||||
| 2026-02-05 | 13F | Teton Advisors, LLC | 30.500 | -5,28 | 1.077 | -5,28 | ||||
| 2026-02-18 | 13F | Beacon Pointe Advisors, LLC | 21.161 | 13,65 | 747 | 13,55 | ||||
| 2026-02-13 | 13F | Financial Network Wealth Advisors LLC | 56 | 0,00 | 2 | 0,00 | ||||
| 2026-02-17 | 13F | Schonfeld Strategic Advisors LLC | 7.268 | 257 | ||||||
| 2026-04-02 | 13F | Ares Financial Consulting, LLC | 228 | 8 | ||||||
| 2026-01-28 | 13F | Klp Kapitalforvaltning As | 30.450 | 2,35 | 1.075 | 2,38 | ||||
| 2026-02-13 | 13F | Marshall Wace, Llp | 151.870 | 5.361 | ||||||
| 2026-02-13 | 13F | Pathstone Holdings, LLC | 13.817 | -13,32 | 488 | -13,35 | ||||
| 2026-02-17 | 13F | State Of Wisconsin Investment Board | 15.590 | -31,33 | 550 | -31,34 | ||||
| 2026-04-06 | 13F | GAMMA Investing LLC | 6.657 | 6,00 | 238 | 7,24 | ||||
| 2026-02-17 | 13F | Cresset Asset Management, LLC | 6.400 | -5,56 | 226 | -5,86 | ||||
| 2026-02-10 | 13F | Root Financial Partners, LLC | 292 | 39,05 | 10 | 42,86 | ||||
| 2026-01-28 | 13F | Loring Wolcott & Coolidge Fiduciary Advisors Llp/ma | 6.473 | 0,00 | 255 | 19,25 | ||||
| 2026-02-11 | 13F | Ameritas Investment Partners, Inc. | 11.581 | 409 | ||||||
| 2026-02-12 | 13F | Hrt Financial Lp | 36.498 | 1 | ||||||
| 2026-02-13 | 13F | American Century Companies Inc | 2.241.848 | -6,33 | 79.137 | -6,30 | ||||
| 2026-02-13 | 13F | Squarepoint Ops LLC | 60.927 | -68,74 | 2.151 | -68,74 | ||||
| 2026-02-13 | 13F | Martin & Co Inc /tn/ | 86.415 | 3,57 | 3.050 | 3,60 | ||||
| 2026-02-17 | 13F | Royal Bank Of Canada | 200.997 | -15,23 | 7.095 | -15,20 | ||||
| 2026-02-13 | 13F | Glen Eagle Advisors, LLC | 39 | 0,00 | 1 | 0,00 | ||||
| 2026-01-16 | 13F | Ronald Blue Trust, Inc. | 49.783 | -10,24 | 1.757 | -10,22 | ||||
| 2026-02-05 | 13F | Atria Investments Llc | 10.413 | -4,08 | 368 | -4,18 | ||||
| 2026-02-13 | 13F | Schroder Investment Management Group | 884.625 | 20,96 | 31.440 | 20,75 | ||||
| 2025-11-14 | 13F | Walleye Capital LLC | 0 | -100,00 | 0 | |||||
| 2026-02-17 | 13F | Aquatic Capital Management LLC | 2.426 | -90,24 | 86 | -90,30 | ||||
| 2025-11-14 | 13F | Two Sigma Advisers, Lp | 0 | -100,00 | 0 | |||||
| 2026-01-13 | 13F | Mather Group, Llc. | 0 | -100,00 | 0 | |||||
| 2026-02-10 | 13F | Goldman Sachs Group Inc | 1.780.780 | 16,29 | 62.862 | 16,32 | ||||
| 2026-02-13 | 13F | Public Sector Pension Investment Board | 0 | -100,00 | 0 | |||||
| 2025-11-14 | 13F | Dark Forest Capital Management Lp | 54.668 | 0,00 | 1.710 | 0,00 | ||||
| 2026-01-28 | 13F | HB Wealth Management, LLC | 14.388 | 1,00 | 508 | 1,00 | ||||
| 2026-02-11 | 13F | Group One Trading, L.p. | Put | 600 | -94,06 | 21 | -94,10 | |||
| 2026-02-11 | 13F | Group One Trading, L.p. | Call | 100 | -97,06 | 4 | -97,48 | |||
| 2026-01-29 | 13F | Teachers Retirement System Of The State Of Kentucky | 35.266 | -11,01 | 1 | 0,00 | ||||
| 2026-02-10 | 13F | Envestnet Asset Management Inc | 567.778 | -13,95 | 20.043 | -13,92 | ||||
| 2026-02-02 | 13F | Oppenheimer Asset Management Inc. | 71.600 | -6,12 | 2.527 | -6,09 | ||||
| 2026-02-12 | 13F | Principal Securities, Inc. | 0 | -100,00 | 0 | -100,00 | ||||
| 2026-02-17 | 13F | Northern Trust Corp | 1.385.350 | -5,96 | 48.903 | -5,93 | ||||
| 2026-01-09 | 13F | Congress Asset Management Co /ma | 1.964.949 | 4,68 | 69.363 | 4,71 | ||||
| 2026-02-17 | 13F | Cetera Investment Advisers | 42.374 | 15,54 | 1.496 | 15,53 | ||||
| 2026-02-13 | 13F | Prudential Financial Inc | 133.427 | -6,94 | 4.742 | -6,29 | ||||
| 2026-02-19 | 13F | Invesco Ltd. | 1.107.336 | 0,94 | 39.089 | 0,97 | ||||
| 2026-04-07 | 13F | CoreCap Advisors, LLC | 2.316 | -32,95 | 83 | -32,23 | ||||
| 2026-01-28 | 13F | CAPROCK Group, Inc. | 6.313 | 223 | ||||||
| 2026-02-05 | 13F | Pinnacle Associates Ltd | 256.325 | -2,33 | 9.048 | -2,30 | ||||
| 2026-02-11 | 13F | Buckingham Strategic Partners | 7.147 | 252 | ||||||
| 2026-01-16 | 13F | Louisiana State Employees Retirement System | 65.300 | -0,31 | 2.305 | -0,26 | ||||
| 2026-02-19 | 13F | Claris Financial LLC | 5.962 | -6,84 | 210 | -6,67 | ||||
| 2026-02-06 | 13F | EverSource Wealth Advisors, LLC | 1.226 | -15,68 | 43 | -15,69 | ||||
| 2026-02-06 | 13F | Intrust Bank Na | 11.843 | 17,95 | 418 | 18,08 | ||||
| 2026-02-17 | 13F | Janus Henderson Group Plc | 65.490 | 10,18 | 2.311 | 10,16 | ||||
| 2026-02-10 | 13F | Argent Trust Co | 6.528 | 230 | ||||||
| 2026-02-10 | 13F | Commonwealth Of Pennsylvania Public School Empls Retrmt Sys | 35.283 | -2,78 | 1.245 | -2,73 | ||||
| 2026-01-15 | 13F | Uncommon Cents Investing LLC | 14.240 | 0,00 | 503 | 0,00 | ||||
| 2026-02-17 | 13F | ISAM Funds (UK) Ltd | 0 | -100,00 | 0 | |||||
| 2026-02-12 | 13F | Xponance, Inc. | 11.305 | 0,91 | 399 | 1,01 | ||||
| 2026-01-28 | 13F | Geneos Wealth Management Inc. | 12.548 | -0,92 | 443 | -0,90 | ||||
| 2025-11-14 | 13F | Freestone Grove Partners LP | 0 | -100,00 | 0 | |||||
| 2026-01-27 | 13F | First Horizon Corp | 240 | 0,00 | 8 | 0,00 | ||||
| 2026-02-17 | 13F | Elizabeth Park Capital Advisors, Ltd. | 85.575 | 0,00 | 3.021 | 0,03 | ||||
| 2026-01-16 | 13F | Hopwood Financial Services, Inc. | 11.231 | -7,24 | 396 | -7,26 | ||||
| 2026-01-14 | 13F | Jfs Wealth Advisors, Llc | 67 | 67,50 | 2 | 100,00 | ||||
| 2026-02-13 | 13F | Mariner, LLC | 36.041 | -18,89 | 1.272 | -18,94 | ||||
| 2026-02-12 | 13F | Pitcairn Co | 0 | -100,00 | 0 | |||||
| 2025-11-12 | 13F | Quantbot Technologies LP | 0 | -100,00 | 0 | |||||
| 2026-02-10 | 13F | Impact Partnership Wealth, LLC | 0 | -100,00 | 0 | |||||
| 2026-02-13 | 13F | Fiduciary Trust Co | 18.245 | -2,84 | 644 | -2,72 | ||||
| 2026-01-30 | 13F | State of New Jersey Common Pension Fund D | 68.624 | 7,50 | 2.422 | 7,55 | ||||
| 2026-02-12 | 13F | Brown Brothers Harriman & Co | 77 | 3 | ||||||
| 2026-02-17 | 13F | Millennium Management Llc | 85.131 | -39,02 | 3.005 | -39,00 | ||||
| 2026-02-13 | 13F | Morgan Stanley | 1.555.413 | 15,13 | 54.906 | 15,16 | ||||
| 2026-02-17 | 13F | California State Teachers Retirement System | 135.597 | 1,47 | 4.787 | 1,51 | ||||
| 2026-02-17 | 13F | Murchinson Ltd. | 106.874 | 0,00 | 3.773 | 0,03 | ||||
| 2026-02-17 | 13F | Advisory Services Network, LLC | 8.838 | 0,00 | 312 | 0,00 | ||||
| 2025-11-13 | 13F | Glenmede Investment Management, LP | 6.394 | 226 | ||||||
| 2026-02-11 | 13F | Los Angeles Capital Management Llc | 590 | 19 | ||||||
| 2026-02-13 | 13F | Integrated Wealth Concepts LLC | 8.238 | 7,87 | 291 | 7,81 | ||||
| 2026-01-29 | 13F | Verdence Capital Advisors LLC | 8.490 | 0,19 | 300 | 4,55 | ||||
| 2026-02-09 | 13F | William Blair Investment Management, Llc | 1.111.244 | 8,79 | 39.227 | 8,82 | ||||
| 2026-02-17 | 13F | Alliancebernstein L.p. | 335.536 | -20,09 | 11.844 | -20,07 | ||||
| 2026-02-17 | 13F | Two Sigma Investments, Lp | 114.784 | -47,02 | 4.052 | -47,02 | ||||
| 2026-02-06 | 13F | FourThought Financial Partners, LLC | 0 | -100,00 | 0 | |||||
| 2026-01-23 | 13F | Avion Wealth | 0 | -100,00 | 0 | |||||
| 2026-04-08 | 13F | Parkside Investments, LLC | 0 | -100,00 | 0 | |||||
| 2026-02-13 | 13F | Gts Securities Llc | 0 | -100,00 | 0 | |||||
| 2026-02-17 | 13F | Mirabella Financial Services Llp | 0 | -100,00 | 0 | |||||
| 2026-01-15 | 13F | Nisa Investment Advisors, Llc | 10.573 | 1,17 | 373 | 1,36 | ||||
| 2026-02-03 | 13F | Wesbanco Bank Inc | 62.700 | 0,00 | 2.213 | 0,05 | ||||
| 2026-01-16 | 13F | Legacy Capital Wealth Partners, LLC | 5.879 | -5,56 | 208 | -5,48 | ||||
| 2026-02-02 | 13F | Dudley Capital Management, Llc | 29.321 | 0,00 | 1.035 | 0,10 | ||||
| 2026-02-02 | 13F | Danske Bank A/s | 3.400 | 0,00 | 120 | 0,84 | ||||
| 2026-02-17 | 13F | Bridgeway Capital Management Inc | 43.400 | -8,82 | 1.532 | -8,76 | ||||
| 2026-04-08 | 13F | Gilman Hill Asset Management, LLC | 14.708 | 0,00 | 526 | 1,16 | ||||
| 2026-02-13 | 13F | Kestra Advisory Services, LLC | 0 | -100,00 | 0 | |||||
| 2026-02-05 | 13F | AlphaCore Capital LLC | 54.972 | 1.941 | ||||||
| 2026-01-29 | 13F | UBS Group AG | 475.259 | 10,94 | 16.777 | 10,97 | ||||
| 2025-10-30 | 13F | Twin Peaks Wealth Advisors, LLC | 0 | -100,00 | 0 | |||||
| 2026-02-12 | 13F | Swiss National Bank | 280.928 | 1,74 | 9.917 | 1,77 | ||||
| 2026-02-06 | 13F | Bare Financial Services, Inc | 280 | 15,23 | 10 | 12,50 | ||||
| 2026-02-11 | 13F | Rise Advisors, LLC | 0 | -100,00 | 0 | -100,00 | ||||
| 2026-01-29 | 13F | Nbc Securities, Inc. | 737 | 0,00 | 26 | 0,00 | ||||
| 2026-02-05 | 13F | Thrivent Financial For Lutherans | 1.412.351 | 0,98 | 50 | 0,00 | ||||
| 2026-02-06 | 13F | Stieven Capital Advisors, L.P. | 742.657 | 8,52 | 26.216 | 8,55 | ||||
| 2026-02-17 | 13F | Wiley Bros.-aintree Capital, Llc | 11.014 | 84,71 | 389 | 84,76 | ||||
| 2026-01-28 | 13F | Peregrine Capital Management Llc | 165.983 | -4,78 | 5.859 | -4,75 | ||||
| 2026-01-29 | 13F | Vanguard Group Inc | 16.022.656 | -0,86 | 565.600 | -0,83 | ||||
| 2026-02-17 | 13F | Boothbay Fund Management, Llc | 40.078 | 0,00 | 1.415 | 0,00 | ||||
| 2026-01-26 | 13F | Cwm, Llc | 16.157 | 0,86 | 1 | |||||
| 2026-02-17 | 13F | T. Rowe Price Investment Management, Inc. | 1.031.842 | 36 | ||||||
| 2026-02-17 | 13F | Ategra Capital Management, LLC | 46.600 | -37,03 | 1.645 | -37,04 | ||||
| 2026-02-17 | 13F | Aristotle Capital Boston, LLC | 628.018 | 22.169 | ||||||
| 2026-04-08 | 13F | DiNuzzo Private Wealth, Inc. | 16 | 14,29 | 1 | |||||
| 2026-01-22 | 13F | Massachusetts Financial Services Co /ma/ | 0 | -100,00 | 0 | |||||
| 2026-02-06 | 13F | Pnc Financial Services Group, Inc. | 96.352 | -4,54 | 3.401 | -4,52 | ||||
| 2026-02-17 | 13F | Brevan Howard Capital Management LP | 0 | -100,00 | 0 | |||||
| 2025-11-14 | 13F | Texas Permanent School Fund | 0 | -100,00 | 0 | |||||
| 2026-02-11 | 13F | Curio Wealth, Llc | 900 | 0,00 | 33 | 3,23 | ||||
| 2026-02-17 | 13F | Westwood Holdings Group Inc | 2.029.191 | -3,68 | 71.630 | -3,65 | ||||
| 2026-01-29 | 13F | Concord Wealth Partners | 2.728 | 0,00 | 96 | 0,00 | ||||
| 2026-02-17 | 13F | Mercer Global Advisors Inc /adv | 11.850 | 33,36 | 418 | 33,55 | ||||
| 2026-02-17 | 13F | Fmr Llc | 44.710 | -3,01 | 1.578 | -2,95 | ||||
| 2026-02-11 | 13F | Pettyjohn, Wood & White, Inc | 6.750 | 0,00 | 238 | 0,00 | ||||
| 2026-04-07 | 13F | Central Pacific Bank - Trust Division | 5.397 | 27,68 | 193 | 28,86 | ||||
| 2026-01-07 | 13F | Harbor Investment Advisory, Llc | 152 | 0,00 | 5 | 0,00 | ||||
| 2026-02-17 | 13F | Vista Investment Management | 11.646 | 5,34 | 411 | 5,38 | ||||
| 2026-02-17 | 13F | Advisor Group Holdings, Inc. | 260.120 | -3,08 | 9.182 | -3,12 | ||||
| 2026-02-13 | 13F | Rafferty Asset Management, LLC | 149.370 | -29,70 | 5.273 | -29,68 | ||||
| 2025-10-28 | 13F | BRYN MAWR TRUST Co | 254 | -92,07 | 9 | -92,00 | ||||
| 2026-02-13 | 13F | JustInvest LLC | 15.849 | -7,60 | 559 | -7,60 | ||||
| 2026-02-11 | 13F | Hughes Financial Services, LLC | 38 | 0,00 | 1 | 0,00 | ||||
| 2026-02-13 | 13F | Nfj Investment Group, Llc | 0 | -100,00 | 0 | |||||
| 2026-04-07 | 13F | Alpha Omega Wealth Management LLC | 6.314 | 0,00 | 226 | 1,35 | ||||
| 2026-02-12 | 13F | Voya Investment Management Llc | 25.286 | 0,00 | 893 | 0,00 | ||||
| 2025-11-13 | 13F | De Lisle Partners LLP | 0 | -100,00 | 0 | |||||
| 2026-02-04 | 13F | First National Advisers, LLC | 14.726 | -4,60 | 520 | -4,60 | ||||
| 2026-01-29 | 13F | Dunhill Financial, LLC | 3 | 0 | ||||||
| 2026-02-13 | 13F | Caitong International Asset Management Co., Ltd | 0 | -100,00 | 0 | |||||
| 2026-02-17 | 13F | Silvercrest Asset Management Group Llc | 46.369 | -1,32 | 1.637 | -1,33 | ||||
| 2026-02-17 | 13F | Kemnay Advisory Services Inc. | 385 | 14 | ||||||
| 2026-01-22 | 13F | Campbell Deegan Wealth Management, LLC | 19.248 | 0,00 | 679 | 0,00 | ||||
| 2026-02-06 | 13F | Global Retirement Partners, LLC | 7.985 | 87,05 | 282 | 87,33 | ||||
| 2026-02-17 | 13F | Scarborough Advisors, LLC | 2.829 | 0,93 | 100 | 1,02 | ||||
| 2026-02-12 | 13F | New York State Common Retirement Fund | 59.575 | -0,18 | 2.103 | -0,19 | ||||
| 2026-01-30 | 13F | Us Bancorp \de\ | 24.940 | -10,42 | 880 | -10,39 | ||||
| 2026-02-13 | 13F | Colony Group, LLC | 37.786 | 3,69 | 1.334 | 3,25 | ||||
| 2026-02-11 | 13F | Commonwealth Retirement Investments LLC | 1.101 | 39 | ||||||
| 2025-11-13 | 13F | Clear Street Markets Llc | 0 | -100,00 | 0 | -100,00 | ||||
| 2026-02-13 | 13F | Chevy Chase Trust Holdings, Inc. | 89.983 | 0,00 | 3.176 | 0,03 | ||||
| 2026-02-17 | 13F | Capstone Investment Advisors, Llc | 12.726 | 449 | ||||||
| 2026-02-02 | 13F | Principal Financial Group Inc | 679.254 | -1,29 | 23.978 | -1,26 | ||||
| 2026-02-17 | 13F | Russell Investments Group, Ltd. | 14.308 | -5,40 | 505 | -5,25 | ||||
| 2026-04-07 | 13F | Farther Finance Advisors, LLC | 1.578 | -23,55 | 57 | -22,22 | ||||
| 2025-11-14 | 13F | Jain Global LLC | 0 | -100,00 | 0 | |||||
| 2026-02-10 | 13F | Re Advisers Corp | 139.492 | 0,00 | 4.924 | 0,04 | ||||
| 2025-11-04 | 13F | Winnow Wealth Llc | 0 | -100,00 | 0 | -100,00 | ||||
| 2026-02-17 | 13F | SageView Advisory Group, LLC | 8.664 | -1,03 | 306 | -0,97 | ||||
| 2026-02-10 | 13F | Nomura Asset Management Co Ltd | 1.533 | 0,00 | 54 | 0,00 | ||||
| 2026-02-05 | 13F | Allworth Financial LP | 5.056 | 2,27 | 178 | 2,30 | ||||
| 2026-02-13 | 13F | Heritage Wealth Advisors | 21.089 | 0,00 | 744 | 0,00 | ||||
| 2026-02-13 | 13F | Sterling Capital Management LLC | 8.271 | -16,34 | 292 | -16,38 | ||||
| 2026-02-14 | 13F | Rockefeller Capital Management L.P. | 24.008 | -1,17 | 848 | -1,17 | ||||
| 2026-02-17 | 13F | Bank Of America Corp /de/ | 578.044 | -14,46 | 20.405 | -14,44 | ||||
| 2025-11-07 | 13F | Readystate Asset Management Lp | 0 | -100,00 | 0 | |||||
| 2026-02-10 | 13F | Natixis Advisors, L.p. | 97.577 | -2,85 | 3 | 0,00 | ||||
| 2026-02-09 | 13F | Hantz Financial Services, Inc. | 55.378 | -8,09 | 2 | -50,00 | ||||
| 2026-01-21 | 13F | Portside Wealth Group, LLC | 12.163 | 13,86 | 429 | 14,10 | ||||
| 2026-02-13 | 13F | Northwest Bancshares, Inc. | 28.533 | 0,00 | 1.007 | 0,10 | ||||
| 2026-01-28 | 13F | Arizona State Retirement System | 39.781 | -5,64 | 1.404 | -5,58 | ||||
| 2026-01-23 | 13F | Optima Capital Llc | 3 | 0 | ||||||
| 2025-11-06 | 13F | Cornerstone Investment Partners, LLC | 0 | -100,00 | 0 | -100,00 | ||||
| 2026-02-03 | 13F | Farmers & Merchants Investments Inc | 70 | 0,00 | 2 | 0,00 | ||||
| 2026-02-13 | 13F | Natixis | 100.000 | 3.530 | ||||||
| 2026-01-30 | 13F | Harbor Advisors LLC | 18.644 | 0,00 | 658 | 0,15 | ||||
| 2026-01-26 | 13F | Private Trust Co Na | 719 | 26,14 | 25 | 25,00 | ||||
| 2026-02-10 | 13F | Rothschild Investment Llc | 209 | 12,97 | 7 | 16,67 | ||||
| 2026-02-12 | 13F | Steward Partners Investment Advisory, Llc | 2.632 | -14,74 | 93 | -14,81 | ||||
| 2026-01-23 | 13F | Rsm Us Wealth Management Llc | 9.267 | 11,89 | 329 | 12,67 | ||||
| 2026-01-21 | 13F | Sound Income Strategies, LLC | 601 | 23 | ||||||
| 2026-01-27 | 13F | Smith, Salley & Associates | 62.161 | -1,26 | 2.194 | -1,22 | ||||
| 2026-02-11 | 13F | Gilpin Wealth Management, Llc | 12 | 0 | ||||||
| 2026-02-17 | 13F | Aqr Capital Management Llc | 275.681 | 3,59 | 9.732 | 3,62 | ||||
| 2026-02-17 | 13F | Holocene Advisors, LP | 73.243 | -7,47 | 2.585 | -7,45 | ||||
| 2026-02-12 | 13F | Jane Street Group, Llc | 0 | -100,00 | 0 | |||||
| 2026-02-13 | 13F | Verition Fund Management LLC | 145.506 | -0,38 | 5.136 | -0,35 | ||||
| 2026-02-17 | 13F | London Co Of Virginia | 0 | -100,00 | 0 | |||||
| 2026-02-05 | 13F | Cambridge Investment Research Advisors, Inc. | 15.496 | -1,51 | 1 | |||||
| 2026-02-11 | 13F | LPL Financial LLC | 139.124 | 23,07 | 4.911 | 23,11 | ||||
| 2026-01-13 | 13F | Fort Washington Investment Advisors Inc /oh/ | 606.259 | -15,92 | 21.401 | -15,89 | ||||
| 2026-01-28 | 13F | Salomon & Ludwin, LLC | 22.182 | 26,79 | 802 | 28,37 | ||||
| 2026-02-12 | 13F | Wealthspire Advisors, LLC | 5.866 | 11,37 | 207 | 11,89 | ||||
| 2026-01-30 | 13F | Keybank National Association/oh | 0 | -100,00 | 0 | |||||
| 2026-02-18 | 13F | Mendon Capital Advisors Corp | 100.000 | 100,00 | 3.530 | 100,11 | ||||
| 2026-02-17 | 13F | Susquehanna International Group, Llp | 40.392 | -50,37 | 1.426 | -50,38 | ||||
| 2026-02-13 | 13F | Maltese Capital Management Llc | 0 | -100,00 | 0 | |||||
| 2025-10-31 | 13F | Y-Intercept (Hong Kong) Ltd | 0 | -100,00 | 0 | |||||
| 2026-02-12 | 13F | Earnest Partners Llc | 2.522.575 | -2,32 | 89.047 | -2,29 | ||||
| 2025-10-30 | 13F | Investment Management Corp /va/ /adv | 0 | -100,00 | 0 | |||||
| 2026-02-03 | 13F | Mitsubishi UFJ Kokusai Asset Management Co., Ltd. | 328 | 0,00 | 12 | 0,00 | ||||
| 2026-02-02 | 13F | Strs Ohio | 11.000 | -6,78 | 388 | -6,73 | ||||
| 2025-11-12 | 13F | Segall Bryant & Hamill, Llc | 0 | -100,00 | 0 | |||||
| 2026-02-13 | 13F | Wells Fargo & Company/mn | 450.514 | 20,82 | 15.903 | 20,85 | ||||
| 2026-02-06 | 13F | Larson Financial Group LLC | 67 | 0,00 | 2 | 0,00 | ||||
| 2026-01-16 | 13F | Banque Pictet & Cie Sa | 10.849 | -19,03 | 383 | -19,07 | ||||
| 2026-02-03 | 13F | Sequoia Financial Advisors, LLC | 5.826 | 206 | ||||||
| 2026-02-13 | 13F | Umb Bank N A/mo | 1.658 | -0,12 | 59 | 0,00 | ||||
| 2026-02-11 | 13F | Jpmorgan Chase & Co | 241.539 | -0,40 | 8.526 | -0,37 | ||||
| 2026-02-11 | 13F | Cerity Partners LLC | 96.875 | -12,93 | 3.420 | -12,20 | ||||
| 2026-02-05 | 13F | HFM Investment Advisors, LLC | 8 | 33,33 | 0 | |||||
| 2026-02-13 | 13F | First Trust Advisors Lp | 271.768 | 16,01 | 9.593 | 16,04 | ||||
| 2026-02-17 | 13F | Wellington Management Group Llp | 611.277 | -22,14 | 21.578 | -22,12 | ||||
| 2026-02-12 | 13F | Cibc World Markets Corp | 9.438 | -46,31 | 333 | -39,34 | ||||
| 2026-02-06 | 13F | Taylor Financial Group, Inc. | 15.206 | 0,00 | 537 | 0,00 | ||||
| 2026-01-21 | 13F | Yousif Capital Management, Llc | 38.911 | -12,92 | 1.454 | -7,80 | ||||
| 2026-04-08 | 13F | Dover Advisors, Llc | 0 | -100,00 | 0 | |||||
| 2026-01-26 | 13F | Quadrant Private Wealth Management, LLC | 7.266 | 0,00 | 256 | 0,00 | ||||
| 2026-02-17 | 13F | Equitable Holdings, Inc. | 9.178 | 0,00 | 324 | 0,00 | ||||
| 2026-02-17 | 13F | First Manhattan Co | 0 | -100,00 | 0 | |||||
| 2026-02-09 | 13F | Hartland & Co., LLC | 6.715 | 0,00 | 237 | 0,42 | ||||
| 2026-02-05 | 13F | Amalgamated Bank | 41.425 | 1,70 | 1 | 0,00 | ||||
| 2025-11-25 | 13F | Court Place Advisors, LLC | 8.798 | 0,00 | 310 | 12,73 | ||||
| 2026-01-16 | 13F | Crewe Advisors LLC | 359 | 11,49 | 13 | 9,09 | ||||
| 2026-01-30 | 13F | Jennison Associates Llc | 238.208 | -62,34 | 8.409 | -62,33 | ||||
| 2025-10-22 | 13F | Vaughan Nelson Investment Management, L.p. | 0 | -100,00 | 0 | |||||
| 2026-02-12 | 13F | Ankerstar Wealth, LLC | 25 | 1 | ||||||
| 2026-02-11 | 13F | Janney Montgomery Scott LLC | 44.730 | -5,76 | 2 | 0,00 | ||||
| 2026-02-17 | 13F | Beacon Investment Advisors Llc | 34.442 | 0,73 | 1.216 | 0,75 | ||||
| 2026-01-28 | 13F | Teacher Retirement System Of Texas | 0 | -100,00 | 0 | |||||
| 2026-02-17 | 13F | Summit Global Investments | 11.970 | -1,09 | 0 | |||||
| 2026-02-17 | 13F | Steadfast Capital Management Lp | 0 | -100,00 | 0 | |||||
| 2026-02-06 | 13F | Covestor Ltd | 1.180 | -10,88 | 0 | |||||
| 2025-11-14 | 13F | StoneX Group Inc. | 0 | -100,00 | 0 | -100,00 | ||||
| 2026-02-17 | 13F | Citadel Advisors Llc | Put | 32.000 | 37,93 | 1.130 | 38,02 | |||
| 2026-02-11 | 13F | Cedar Mountain Advisors, LLC | 4 | 0,00 | 0 | |||||
| 2026-02-17 | 13F | Citadel Advisors Llc | 56.573 | -94,26 | 1.997 | -94,26 | ||||
| 2026-02-13 | 13F | Manufacturers Life Insurance Company, The | 0 | -100,00 | 0 | |||||
| 2026-02-12 | 13F | Bank Of Montreal /can/ | 10.255 | -2,33 | 362 | -2,16 | ||||
| 2026-02-17 | 13F | Citadel Advisors Llc | Call | 21.800 | 235,38 | 770 | 235,81 | |||
| 2026-02-17 | 13F | Weiss Asset Management LP | 167.282 | 5.905 | ||||||
| 2026-01-26 | 13F | KBC Group NV | 3.998 | 0,00 | 0 | |||||
| 2026-02-13 | 13F | SRS Capital Advisors, Inc. | 720 | -80,18 | 25 | -80,47 | ||||
| 2026-02-04 | 13F | D'Orazio & Associates, Inc. | 12.986 | -16,75 | 458 | -16,73 | ||||
| 2026-01-30 | 13F/A | M&t Bank Corp | 16.859 | 5,96 | 595 | 6,06 | ||||
| 2026-02-10 | 13F | CIBC Asset Management Inc | 13.399 | 3,62 | 473 | 3,51 | ||||
| 2026-02-12 | 13F | Ensign Peak Advisors, Inc | 8.731 | -66,97 | 308 | -66,95 | ||||
| 2026-02-17 | 13F | Creative Planning | 89.918 | -1,92 | 3.174 | -1,89 | ||||
| 2026-02-12 | 13F | BlackRock, Inc. | 20.548.779 | -1,30 | 725.372 | -1,27 | ||||
| 2026-03-03 | 13F/A | Integrated Investment Consultants, LLC | 7.597 | 0,03 | 268 | 0,00 | ||||
| 2026-01-27 | 13F | Evergreen Capital Management Llc | 8.396 | 0,00 | 296 | 0,00 | ||||
| 2026-02-11 | 13F | Simplex Trading, Llc | Put | 100 | 0,00 | 4 | ||||
| 2026-02-11 | 13F | Vise Technologies, Inc. | 6.139 | 217 | ||||||
| 2026-02-11 | 13F | Simplex Trading, Llc | Call | 600 | 0,00 | 21 | ||||
| 2025-11-14 | 13F | Quarry LP | 0 | -100,00 | 0 | |||||
| 2026-02-09 | 13F | Fisher Asset Management, LLC | 360.291 | 0,01 | 12.718 | 0,04 | ||||
| 2026-01-14 | 13F | Hennion & Walsh Asset Management, Inc. | 5.899 | -46,25 | 208 | -46,25 | ||||
| 2026-02-11 | 13F | Deutsche Bank Ag\ | 114.953 | 4,13 | 4.058 | 4,16 | ||||
| 2026-02-13 | 13F | Inspire Advisors, LLC | 91.489 | -2,41 | 3.230 | -2,39 | ||||
| 2026-02-17 | 13F | Susquehanna International Group, Llp | Put | 0 | -100,00 | 0 | ||||
| 2026-02-13 | 13F | Barclays Plc | 274.675 | 46,98 | 9.696 | 37,75 | ||||
| 2026-02-09 | 13F | Legal & General Group Plc | 356.267 | -6,33 | 12.576 | -6,30 | ||||
| 2025-11-14 | 13F | Mount Yale Investment Advisors, LLC | 0 | -100,00 | 0 | -100,00 | ||||
| 2026-01-22 | 13F | Mh & Associates Securities Management Corp /adv | 135 | 5 | ||||||
| 2026-02-10 | 13F | 1492 Capital Management LLC | 64.725 | 3,00 | 2.285 | 3,02 | ||||
| 2026-02-13 | 13F | Public Employees Retirement Association Of Colorado | 11.478 | 0,00 | 0 | |||||
| 2026-02-11 | 13F | Brandywine Global Investment Management, LLC | 155.910 | -3,47 | 5.504 | -3,44 | ||||
| 2026-02-06 | 13F | HighTower Advisors, LLC | 38.368 | -9,27 | 1.354 | -9,25 | ||||
| 2026-02-17 | 13F | Man Group plc | 88.554 | 283,50 | 3.126 | 283,91 | ||||
| 2026-01-09 | 13F | Diversified Trust Co | 7.895 | 0,00 | 279 | 0,00 | ||||
| 2026-02-13 | 13F | PCM Encore, LLC | 6.284 | 222 | ||||||
| 2026-02-09 | 13F | Huntington National Bank | 1.275 | -0,23 | 45 | 0,00 | ||||
| 2026-02-10 | 13F | Founders Financial Securities Llc | 9.180 | -23,60 | 324 | -23,58 | ||||
| 2026-02-13 | 13F | Citigroup Inc | 148.092 | -14,37 | 5.228 | -14,35 | ||||
| 2026-02-09 | 13F | Kingsview Wealth Management, LLC | 12.902 | -0,62 | 455 | -0,66 | ||||
| 2026-02-11 | 13F | Parallel Advisors, LLC | 758 | 0,00 | 27 | 0,00 | ||||
| 2026-02-17 | 13F | Amundi | 21.533 | -14,83 | 760 | -16,76 | ||||
| 2026-02-09 | 13F | Harbour Investments, Inc. | 9 | 0 | ||||||
| 2026-02-18 | 13F | State of Tennessee, Treasury Department | 29.240 | -51,32 | 1.136 | -46,44 | ||||
| 2026-02-13 | 13F | Wbi Investments, Inc. | 0 | -100,00 | 0 | |||||
| 2026-02-13 | 13F | Sei Investments Co | 352.266 | 111,22 | 12.435 | 111,28 | ||||
| 2026-02-05 | 13F | Dana Investment Advisors, Inc. | 48.546 | -13,38 | 1.714 | -13,35 | ||||
| 2026-02-13 | 13F | Police & Firemen's Retirement System of New Jersey | 38.922 | -4,06 | 1.374 | -4,05 | ||||
| 2025-10-28 | 13F | Wolverine Asset Management Llc | 0 | -100,00 | 0 | |||||
| 2026-02-17 | 13F | Raymond James Financial Inc | 262.798 | -7,11 | 9.277 | -7,08 | ||||
| 2026-01-27 | 13F | Hennessy Advisors Inc | 25.000 | -28,57 | 882 | -28,58 | ||||
| 2026-02-09 | 13F | Fidelis Capital Partners, LLC | 22.984 | 0,12 | 811 | 0,12 | ||||
| 2026-02-04 | 13F | Oregon Public Employees Retirement Fund | 32.556 | 1,56 | 1.149 | 1,59 | ||||
| 2026-02-13 | 13F | Kilter Group LLC | 17 | -60,47 | 1 | -100,00 | ||||
| 2026-04-08 | 13F | Oliver Luxxe Assets LLC | 64.342 | -0,11 | 2.300 | 1,14 | ||||
| 2026-04-08 | 13F | Wealth Enhancement Advisory Services, Llc | 30.076 | -45,61 | 1.085 | -46,81 | ||||
| 2026-01-28 | 13F | Universal- Beteiligungs- und Servicegesellschaft mbH | 111.503 | -5,98 | 3.937 | -5,95 | ||||
| 2026-01-14 | 13F | Spire Wealth Management | 2.524 | 0,00 | 89 | 0,00 | ||||
| 2026-02-09 | 13F | Royce & Associates Lp | 94.091 | 0,00 | 3.321 | 0,03 | ||||
| 2026-01-23 | 13F | Private Wealth Management Group, LLC | 190 | 0,00 | 7 | 0,00 | ||||
| 2026-01-20 | 13F | Harbor Capital Advisors, Inc. | 438 | -1,57 | 0 | |||||
| 2025-11-13 | 13F | Norges Bank | 0 | -100,00 | 0 | |||||
| 2026-02-12 | 13F | Quadrant Capital Group Llc | 6.354 | 106,30 | 224 | 107,41 | ||||
| 2026-02-12 | 13F | Cloud Capital Management, LLC | 0 | -100,00 | 0 | |||||
| 2026-01-21 | 13F | Ledyard National Bank | 13.478 | 0,00 | 476 | 0,00 | ||||
| 2026-02-17 | 13F | Lazard Asset Management Llc | 136.716 | 22,14 | 4.826 | 22,18 | ||||
| 2026-02-11 | 13F | Barrow Hanley Mewhinney & Strauss Llc | 766 | 0,00 | 27 | 0,00 | ||||
| 2026-02-13 | 13F | MAI Capital Management | 46.099 | 25,41 | 1.627 | 25,44 | ||||
| 2025-11-13 | 13F | Jefferies Financial Group Inc. | Call | 0 | -100,00 | 0 | -100,00 | |||
| 2025-10-30 | 13F | Emerald Mutual Fund Advisers Trust | 0 | -100,00 | 0 | -100,00 | ||||
| 2026-02-12 | 13F | Brinker Capital Investments, LLC | 48.095 | -9,79 | 1.698 | -9,78 | ||||
| 2026-01-09 | 13F | SG Americas Securities, LLC | 1.532.473 | 6.808,01 | 54 | |||||
| 2026-02-04 | 13F | Lafayette Investments, Inc. | 9.145 | 28,89 | 323 | 28,80 | ||||
| 2026-01-23 | 13F | State of Alaska, Department of Revenue | 78.420 | 1,39 | 3 | 0,00 | ||||
| 2026-01-23 | 13F | Gibbs Wealth Management | 14.783 | -5,11 | 553 | 0,73 | ||||
| 2026-02-13 | 13F | Bontempo Ohly Capital Mgmt Llc | 37.519 | 0,00 | 1.324 | 0,00 | ||||
| 2026-01-27 | 13F | Benson Investment Management Company, Inc. | 109.055 | 1,29 | 3.850 | 1,32 | ||||
| 2026-01-28 | 13F | Nadler Financial Group, Inc. | 12.325 | 0,00 | 435 | 0,23 | ||||
| 2026-02-12 | 13F | Connecticut Wealth Management, LLC | 0 | -100,00 | 0 | |||||
| 2026-04-07 | 13F | Park Avenue Securities Llc | 12.441 | -4,39 | 0 | |||||
| 2026-02-13 | 13F | Great West Life Assurance Co /can/ | 132.500 | -9,65 | 5 | -20,00 | ||||
| 2026-01-29 | 13F | Comerica Bank | 43.524 | -14,47 | 1.536 | -14,43 | ||||
| 2026-02-02 | 13F | Pinnacle Wealth Management Advisory Group, LLC | 14.013 | 131,73 | 495 | 131,92 | ||||
| 2026-01-27 | 13F | Tred Avon Family Wealth, Llc | 14.719 | 0,00 | 520 | 0,00 | ||||
| 2026-02-09 | 13F | Cary Street Partners Financial Llc | 48.534 | -19,10 | 1.713 | -19,08 | ||||
| 2026-02-17 | 13F | RMB Capital Management, LLC | 106.595 | 88,45 | 3.763 | 88,48 | ||||
| 2026-02-11 | 13F | GW&K Investment Management, LLC | 1.609.015 | 57 | ||||||
| 2026-02-12 | 13F | Skopos Labs, Inc. | 10.025 | 12,44 | 362 | 15,29 | ||||
| 2026-02-04 | 13F | Swiss Life Asset Management Ltd | 6.425 | 0,00 | 227 | 0,00 | ||||
| 2026-01-15 | 13F | Fortitude Family Office, LLC | 166 | 0,00 | 6 | 0,00 | ||||
| 2025-11-21 | 13F/A | CIBC Bancorp USA Inc. | 15.208 | 537 | ||||||
| 2026-02-10 | 13F | Verity & Verity, LLC | 518.011 | 2,69 | 18.286 | 2,72 | ||||
| 2026-01-23 | 13F | Assetmark, Inc | 394 | 11,30 | 14 | 8,33 | ||||
| 2026-01-12 | 13F | Salem Investment Counselors Inc | 0 | -100,00 | 0 | |||||
| 2026-03-06 | 13F | Hsbc Holdings Plc | 106.335 | 1.292,00 | 3.752 | 1.294,42 | ||||
| 2026-04-08 | 13F | Heritage Family Offices, LLP | 0 | -100,00 | 0 | |||||
| 2026-02-10 | 13F/A | Northwestern Mutual Wealth Management Co | 4.285 | 0,78 | 151 | 0,67 | ||||
| 2026-02-13 | 13F | Rhumbline Advisers | 397.126 | -5,62 | 14.019 | -5,60 | ||||
| 2026-02-10 | 13F | Td Asset Management Inc | 26.922 | 950 | ||||||
| 2026-02-10 | 13F | BW Gestao de Investimentos Ltda. | 210.000 | 7.413 | ||||||
| 2026-02-10 | 13F | Intech Investment Management Llc | 49.769 | 0,00 | 1.757 | 0,00 | ||||
| 2026-02-17 | 13F | Public Employees Retirement System Of Ohio | 78.534 | 0,10 | 2.772 | 0,14 | ||||
| 2026-02-03 | 13F | Connable Office Inc | 12.975 | 0,00 | 458 | 0,22 | ||||
| 2026-02-13 | 13F | Victory Capital Management Inc | 277.837 | -2,19 | 9.808 | -2,16 | ||||
| 2026-01-26 | 13F | Grace & White Inc /ny | 52.325 | -0,00 | 1.847 | 0,05 | ||||
| 2026-02-13 | 13F | Resources Investment Advisors, LLC. | 10.217 | -6,21 | 361 | -6,25 | ||||
| 2026-02-09 | 13F | Coldstream Capital Management Inc | 7.081 | 21,81 | 250 | 21,46 | ||||
| 2026-02-17 | 13F | Ameriprise Financial Inc | 1.698.347 | -1,80 | 59.952 | -1,77 | ||||
| 2026-01-23 | 13F | Zwj Investment Counsel Inc | 6.549 | -9,00 | 231 | -8,70 | ||||
| 2026-02-13 | 13F | Brown Advisory Inc | 96.472 | -7,29 | 3.405 | -7,27 | ||||
| 2026-04-08 | 13F | Graves-Light Private Wealth Management, Inc. | 14.048 | 0,00 | 502 | 1,41 | ||||
| 2026-02-12 | 13F | State Board Of Administration Of Florida Retirement System | 36.599 | 0,00 | 1.292 | 0,00 | ||||
| 2026-02-06 | 13F | Envestnet Portfolio Solutions, Inc. | 10.353 | 7,61 | 365 | 7,67 | ||||
| 2026-02-12 | 13F | Renaissance Technologies Llc | 18.302 | 646 | ||||||
| 2026-02-17 | 13F | Forest Hill Capital, LLC | 58.556 | 0,00 | 2.067 | 0,05 | ||||
| 2026-02-17 | 13F | Farringdon Capital, Ltd. | 0 | -100,00 | 0 | |||||
| 2025-11-14 | 13F | Scientech Research LLC | 0 | -100,00 | 0 | -100,00 | ||||
| 2026-01-22 | 13F | Accordant Advisory Group Inc | 35.178 | -2,94 | 1.242 | -2,97 | ||||
| 2026-02-05 | 13F | Gamco Investors, Inc. Et Al | 187.174 | -4,26 | 6.607 | -4,23 | ||||
| 2026-02-02 | 13F | Bay Harbor Wealth Management, LLC | 10 | 150,00 | 0 | |||||
| 2026-02-04 | 13F | Versor Investments LP | 0 | -100,00 | 0 | |||||
| 2026-02-11 | 13F | O'shaughnessy Asset Management, Llc | 0 | -100,00 | 0 | |||||
| 2026-02-06 | 13F | Associated Banc-corp | 7.146 | 0,00 | 252 | 0,00 | ||||
| 2026-02-09 | 13F | Cary Street Partner Investment Advisory Llc | 156 | -8,77 | 6 | -16,67 | ||||
| 2026-02-12 | 13F | FineMark National Bank & Trust | 62.927 | 0,00 | 2.221 | 0,05 | ||||
| 2026-02-17 | 13F | Quantinno Capital Management LP | 111.692 | 170,89 | 3.943 | 170,93 | ||||
| 2026-02-03 | 13F | SBI Securities Co., Ltd. | 5 | -99,98 | 0 | -100,00 | ||||
| 2026-02-04 | 13F | Atlantic Union Bankshares Corp | 827.393 | -1,06 | 29.207 | -1,03 | ||||
| 2025-11-06 | 13F | Abich Financial Wealth Management LLC | 1.422 | 50 | ||||||
| 2026-02-05 | 13F | Bessemer Group Inc | 832 | 16,36 | 0 | |||||
| 2026-02-18 | 13F | Vident Advisory, LLC | 15.928 | -1,39 | 562 | -1,40 | ||||
| 2026-02-17 | 13F | Signature Equity Partners, LLC | 17 | 1 | ||||||
| 2026-01-12 | 13F | Rialto Wealth Management, LLC | 50 | 8,70 | 2 | 0,00 | ||||
| 2026-02-06 | 13F | ProShare Advisors LLC | 199.919 | -0,44 | 7.057 | -0,41 | ||||
| 2026-02-11 | 13F | Wills Financial Group LLC | 64.640 | 2.282 | ||||||
| 2026-01-15 | 13F | Allspring Global Investments Holdings, LLC | 306.360 | -15,31 | 10.882 | -14,52 | ||||
| 2026-02-13 | 13F | Parkside Financial Bank & Trust | 485 | 74,46 | 17 | 88,89 | ||||
| 2026-01-12 | 13F | CVA Family Office, LLC | 15 | 1 | ||||||
| 2026-02-17 | 13F | Abel Hall, LLC | 6.949 | 245 | ||||||
| 2026-01-22 | 13F | Westbourne Investments, Inc. | 13.500 | 0,00 | 477 | 8,43 | ||||
| 2026-02-13 | 13F | Basswood Capital Management, L.l.c. | 190.680 | 0,00 | 6.731 | 0,03 | ||||
| 2026-02-10 | 13F | Savant Capital, LLC | 6.043 | -4,43 | 213 | -4,48 | ||||
| 2026-01-08 | 13F | True Wealth Design, LLC | 89 | -1,11 | 3 | 0,00 | ||||
| 2026-02-12 | 13F | Advisors Asset Management, Inc. | 505 | 18 | ||||||
| 2026-01-12 | 13F | DAVENPORT & Co LLC | 760.660 | -7,96 | 26.974 | -8,04 | ||||
| 2026-02-06 | 13F | Princeton Capital Management Llc | 8.000 | 0,00 | 282 | 0,00 | ||||
| 2026-02-06 | 13F | IFP Advisors, Inc | 740 | 362,50 | 26 | 420,00 | ||||
| 2026-02-12 | 13F | Dimensional Fund Advisors Lp | 7.532.643 | -3,01 | 265.904 | -2,99 | ||||
| 2026-02-13 | 13F | Kennedy Capital Management, Inc. | 435.054 | 39,55 | 15.357 | 39,60 | ||||
| 2026-02-04 | 13F | HighPoint Advisor Group LLC | 7.602 | -3,42 | 268 | -3,25 | ||||
| 2026-01-26 | 13F/A | Phocas Financial Corp. | 105.897 | -0,25 | 3.738 | -0,21 | ||||
| 2026-02-13 | 13F | Smartleaf Asset Management LLC | 3.307 | 70,20 | 118 | 69,57 | ||||
| 2026-02-17 | 13F | Tower Research Capital LLC (TRC) | 5.231 | -42,68 | 185 | -42,86 | ||||
| 2026-02-17 | 13F | MIRAE ASSET GLOBAL ETFS HOLDINGS Ltd. | 66.211 | -0,11 | 2.337 | -0,09 | ||||
| 2026-02-17 | 13F | DV Trading LLC | 200 | 7 | ||||||
| 2026-02-11 | 13F | Nemes Rush Group LLC | 6 | 0 | ||||||
| 2026-02-17 | 13F | Snowden Capital Advisors LLC | 10.907 | -0,17 | 385 | 0,00 | ||||
| 2026-01-20 | 13F | Toth Financial Advisory Corp | 8.210 | 31,47 | 290 | 31,36 | ||||
| 2026-01-21 | 13F | SJS Investment Consulting Inc. | 9 | 0,00 | 0 | |||||
| 2026-02-09 | 13F | Quest Partners LLC | 30.170 | 0,24 | 1.065 | 0,28 | ||||
| 2026-02-12 | 13F | Nuveen, LLC | 1.325.032 | 12,16 | 46.774 | 12,19 | ||||
| 2026-02-17 | 13F | Balyasny Asset Management Llc | 606.377 | 1.956,49 | 21.405 | 1.958,17 | ||||
| 2026-02-12 | 13F | Johnson Financial Group, Inc. | 0 | -100,00 | 0 | |||||
| 2026-01-26 | 13F | Old Point Trust & Financial Services N A | 217 | 0,00 | 8 | 0,00 | ||||
| 2025-11-14 | 13F | XTX Topco Ltd | 0 | -100,00 | 0 | |||||
| 2026-02-10 | 13F | Moors & Cabot, Inc. | 8.807 | -6,00 | 311 | -6,06 | ||||
| 2026-01-30 | 13F | Torren Management, LLC | 603 | 21 | ||||||
| 2025-11-05 | 13F | SPC Financial, Inc. | 56.870 | 0,00 | 2.007 | 12,82 | ||||
| 2026-02-09 | 13F | Atlantic Trust, LLC | 0 | -100,00 | 0 | |||||
| 2026-02-02 | 13F | Partners in Financial Planning | 6.238 | 0,21 | 220 | 0,46 | ||||
| 2026-02-12 | 13F | CIBC Private Wealth Group, LLC | 1.164 | -11,75 | 41 | -10,87 | ||||
| 2026-02-13 | 13F | Toroso Investments, LLC | 0 | -100,00 | 0 | |||||
| 2026-02-17 | 13F | Captrust Financial Advisors | 55.831 | 32,74 | 1.971 | 32,75 | ||||
| 2026-01-20 | 13F | Stratos Wealth Partners, LTD. | 5.786 | -3,10 | 204 | -2,86 | ||||
| 2026-04-07 | 13F | Signaturefd, Llc | 3.129 | -2,22 | 112 | -0,89 | ||||
| 2026-02-06 | 13F | Profund Advisors Llc | 20.793 | 123,41 | 734 | 123,48 | ||||
| 2026-02-18 | 13F | Mackenzie Financial Corp | 8.937 | -2,19 | 317 | -1,86 | ||||
| 2026-02-05 | 13F | Gabelli Funds Llc | 120.959 | 0,00 | 4.270 | 0,02 | ||||
| 2026-01-28 | 13F | Ruffer LLP | 84.181 | 2.976 | ||||||
| 2026-01-14 | 13F | ORG Wealth Partners, LLC | 3.309 | 0,00 | 117 | 0,00 | ||||
| 2025-11-13 | 13F | Dynamic Technology Lab Private Ltd | 0 | -100,00 | 0 | |||||
| 2026-01-26 | 13F | Main Street Group, LTD | 0 | -100,00 | 0 | |||||
| 2026-02-04 | 13F | Cascades Capital Asset Management, LLC | 3.528 | -38,27 | 125 | -38,31 | ||||
| 2026-02-09 | 13F | Systematic Financial Management Lp | 1.544.002 | -0,54 | 54.503 | -0,51 | ||||
| 2026-01-30 | 13F | Urban Wealth Management, LLC | 0 | -100,00 | 0 | -100,00 | ||||
| 2026-02-06 | 13F | Handelsbanken Fonder AB | 34.716 | 2,36 | 1 | 0,00 | ||||
| 2026-02-10 | 13F | Bank of New York Mellon Corp | 1.378.739 | 1,86 | 48.670 | 1,89 | ||||
| 2026-02-17 | 13F | Maryland State Retirement & Pension System | 20.835 | 1,69 | 735 | 1,66 | ||||
| 2025-11-14 | 13F | Ostrum Asset Management | 0 | -100,00 | 0 | |||||
| 2026-01-22 | 13F | Evermay Wealth Management Llc | 23.233 | 70,82 | 820 | 71,19 | ||||
| 2026-01-27 | 13F | Tributary Capital Management, LLC | 657.791 | -6,98 | 23.220 | -6,95 | ||||
| 2025-10-24 | 13F | Hemington Wealth Management | 111 | 146,67 | 0 | |||||
| 2026-01-27 | 13F | Regions Financial Corp | 6.166 | 4,95 | 218 | 4,83 | ||||
| 2026-02-17 | 13F | North Reef Capital Management LP | 4.572.090 | 23,12 | 161.395 | 23,15 | ||||
| 2026-02-13 | 13F | Kennondale Capital Management LLC | 53.329 | 0,00 | 1.883 | 0,05 | ||||
| 2025-11-14 | 13F | Fourthstone LLC | 0 | -100,00 | 0 | |||||
| 2026-01-22 | 13F | Apollon Wealth Management, LLC | 10.433 | 2,43 | 368 | 2,51 | ||||
| 2026-02-13 | 13F | First National Bank Of Omaha | 78.498 | -1,19 | 2.771 | -1,18 | ||||
| 2026-02-10 | 13F | State of Wyoming | 0 | -100,00 | 0 | |||||
| 2026-02-17 | 13F | Price T Rowe Associates Inc /md/ | 125.692 | 4,02 | 4 | 0,00 | ||||
| 2026-02-19 | 13F | CI Private Wealth, LLC | 0 | -100,00 | 0 | |||||
| 2026-02-17 | 13F | Glenmede Trust Co Na | 7.507 | 265 | ||||||
| 2026-02-12 | 13F | MetLife Investment Management, LLC | 623.041 | -0,64 | 21.993 | -0,61 | ||||
| 2026-02-13 | 13F | Mml Investors Services, Llc | 25.194 | 0,60 | 889 | 0,68 | ||||
| 2026-02-09 | 13F | Keating Financial Advisory Services, Inc. | 52 | 2 | ||||||
| 2026-01-07 | 13F | Massmutual Trust Co Fsb/adv | 194 | 0,00 | 7 | 0,00 | ||||
| 2026-02-11 | 13F | SOUTH STATE Corp | 4.335 | 0,00 | 153 | 0,66 | ||||
| 2026-02-13 | 13F | Stifel Financial Corp | 134.655 | -27,83 | 4.753 | -27,81 | ||||
| 2026-02-17 | 13F | CWM Advisors, LLC | 3.255 | 115 | ||||||
| 2026-02-12 | 13F | Commonwealth Equity Services, Llc | 43.832 | -19,14 | 1.547 | 154.600,00 | ||||
| 2026-01-27 | 13F | Zurcher Kantonalbank (Zurich Cantonalbank) | 47.581 | 36,47 | 1.680 | 36,50 | ||||
| 2026-02-17 | 13F | Optiver Holding B.V. | 213 | -63,46 | 8 | -65,00 | ||||
| 2026-02-02 | 13F | Truist Financial Corp | 99.857 | -44,91 | 3.525 | -44,90 | ||||
| 2026-02-09 | 13F | Annis Gardner Whiting Capital Advisors, LLC | 74 | -3,90 | 3 | 0,00 | ||||
| 2026-02-17 | 13F | Azora Capital LP | 0 | -100,00 | 0 | |||||
| 2026-01-21 | 13F | First United Bank Trust/ | 270 | 0,00 | 10 | 0,00 | ||||
| 2026-01-13 | 13F | Trust Point Inc. | 16.312 | -2,05 | 576 | -2,04 | ||||
| 2026-02-13 | 13F | Ubs Asset Management Americas Inc | 318.097 | 0,97 | 11.229 | 1,00 | ||||
| 2026-02-09 | 13F | Texas Capital Bank Wealth Management Services Inc | 6.192 | 219 | ||||||
| 2026-02-11 | 13F | Illinois Municipal Retirement Fund | 72.678 | -3,89 | 2.566 | -3,86 | ||||
| 2026-02-10 | 13F | Bnp Paribas Arbitrage, Sa | 32.762 | -6,23 | 1.156 | -6,17 | ||||
| 2026-02-09 | 13F | Jefferies Financial Group Inc. | 189.970 | 6.706 | ||||||
| 2026-02-02 | 13F | CENTRAL TRUST Co | 20 | 1 | ||||||
| 2026-02-02 | 13F | Salzhauer Michael | 16.578 | 0,00 | 585 | 0,00 | ||||
| 2026-01-29 | 13F | Pictet Asset Management Holding SA | 21.259 | 7,71 | 750 | 7,76 | ||||
| 2026-04-06 | 13F | Versant Capital Management, Inc | 2.873 | 68,21 | 103 | 70,00 | ||||
| 2026-02-10 | 13F | Baker Avenue Asset Management, LP | 19.111 | -17,61 | 675 | -17,60 | ||||
| 2025-11-04 | 13F | Heritage Investors Management Corp | 0 | -100,00 | 0 | |||||
| 2026-02-13 | 13F | Neuberger Berman Group LLC | 16.354 | 14,03 | 577 | 14,03 | ||||
| 2026-01-20 | 13F | Tritonpoint Wealth, Llc | 16.781 | -4,23 | 592 | -4,21 | ||||
| 2026-02-11 | 13F | Franklin Resources Inc | 3.242.829 | -1,39 | 114.472 | -1,36 | ||||
| 2026-01-06 | 13F | Canal Capital Management, LLC | 54.600 | 2,63 | 1.927 | 2,66 | ||||
| 2026-02-09 | 13F | New Age Alpha Advisors, LLC | 19.746 | -3,70 | 697 | -3,60 | ||||
| 2026-02-09 | 13F | Geode Capital Management, Llc | 3.388.727 | -0,06 | 119.640 | -0,04 | ||||
| 2026-01-23 | 13F | Westside Investment Management, Inc. | 780 | 0,00 | 28 | 0,00 | ||||
| 2026-02-02 | 13F | Fifth Third Bancorp | 1.985 | 5,87 | 70 | 6,06 | ||||
| 2026-02-17 | 13F | Guggenheim Capital Llc | 23.582 | -0,99 | 832 | -0,95 | ||||
| 2026-02-02 | 13F | Oppenheimer & Co Inc | 8.390 | -1,47 | 296 | -1,33 | ||||
| 2026-01-29 | 13F | UMA Financial Services, Inc. | 81 | 58,82 | 3 | 100,00 | ||||
| 2026-02-10 | 13F | Mutual Of America Capital Management Llc | 16.289 | 2,04 | 575 | 2,13 | ||||
| 2026-02-18 | 13F | GWM Advisors LLC | 14.521 | 89,77 | 513 | 89,63 | ||||
| 2026-01-30 | 13F | New York State Teachers Retirement System | 31.460 | 0,00 | 1 | 0,00 | ||||
| 2026-02-11 | 13F | Hilton Head Capital Partners, LLC | 545 | 19 | ||||||
| 2026-02-13 | 13F | Charles Schwab Investment Management Inc | 1.786.698 | -1,15 | 63.070 | -1,12 | ||||
| 2026-02-13 | 13F | Pinnacle Wealth Planning Services, Inc. | 3.089 | 109 |
Other Listings
| DE:UIO | 31,00 € |