Grundlæggende statistik
| Institutionelle ejere | 93 total, 90 long only, 0 short only, 3 long/short - change of -1,06% MRQ |
| Gennemsnitlig porteføljeallokering | 0.2095 % - change of 4,11% MRQ |
| Institutionelle aktier (lange) | 2.270.229 (ex 13D/G) - change of -0,14MM shares -5,67% MRQ |
| Institutionel værdi (lang) | $ 201.292 USD ($1000) |
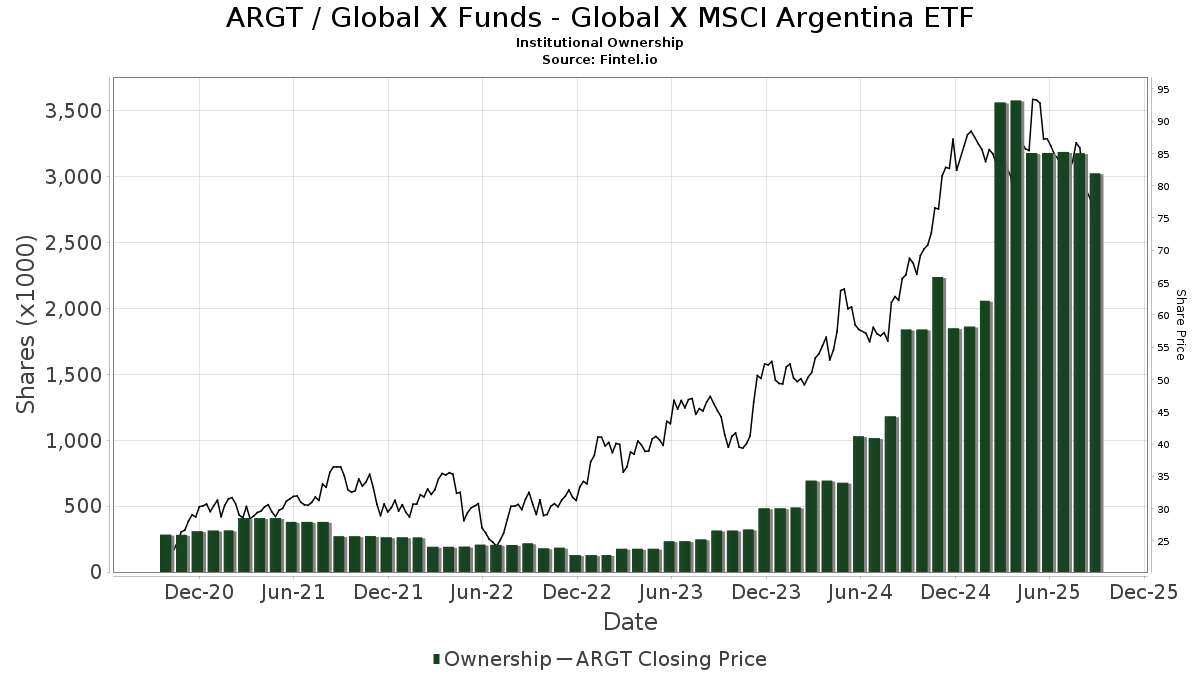
Institutionelt ejerskab og aktionærer
Global X Funds - Global X MSCI Argentina ETF (US:ARGT) har 93 institutionelle ejere og aktionærer, der har indsendt 13D/G- eller 13F-formularer til Securities Exchange Commission (SEC). Disse institutioner har i alt 2,270,229 aktier. Største aktionærer omfatter Morgan Stanley, Bank Julius Baer & Co. Ltd, Zurich, Breakout Capital Partners, LP, Citadel Advisors Llc, LPL Financial LLC, Susquehanna International Group, Llp, NLB Skladi, upravljanje premozenja, d.o.o., Varma Mutual Pension Insurance Co, Jane Street Group, Llc, and Raymond James Financial Inc .
Global X Funds - Global X MSCI Argentina ETF (ARCA:ARGT) institutionel ejerskabsstruktur viser aktuelle positioner i virksomheden efter institutioner og fonde, samt seneste ændringer i positionsstørrelse. Større aktionærer kan omfatte individuelle investorer, investeringsforeninger, hedgefonde eller institutioner. Skema 13D angiver, at investoren besidder (eller besidder) mere end 5 % af virksomheden og har til hensigt (eller har til hensigt at) aktivt at forfølge en ændring i forretningsstrategi. Skema 13G indikerer en passiv investering på over 5%.
The share price as of April 1, 2026 is 93,21 / share. Previously, on April 2, 2025, the share price was 81,33 / share. This represents an increase of 14,61% over that period.
Fondens stemningsscore
Fund Sentiment Score (fka Ownership Accumulation Score) finder de aktier, der bliver mest købt af fonde. Det er resultatet af en sofistikeret, multi-faktor kvantitativ model, der identificerer virksomheder med de højeste niveauer af institutionel akkumulering. Scoringsmodellen bruger en kombination af den samlede stigning i oplyste ejere, ændringerne i porteføljeallokeringer i disse ejere og andre målinger. Tallet går fra 0 til 100, hvor højere tal indikerer et højere niveau af akkumulering for sine jævnaldrende, og 50 er gennemsnittet.
Opdateringsfrekvens: Dagligt
Se Ownership Explorer, som giver en liste over højest rangerende virksomheder.
AI+ Ask Fintel’s AI assistant about Global X Funds - Global X MSCI Argentina ETF.
Select a question to share a public post with an AI-crafted answer.
Thinking of good questions…
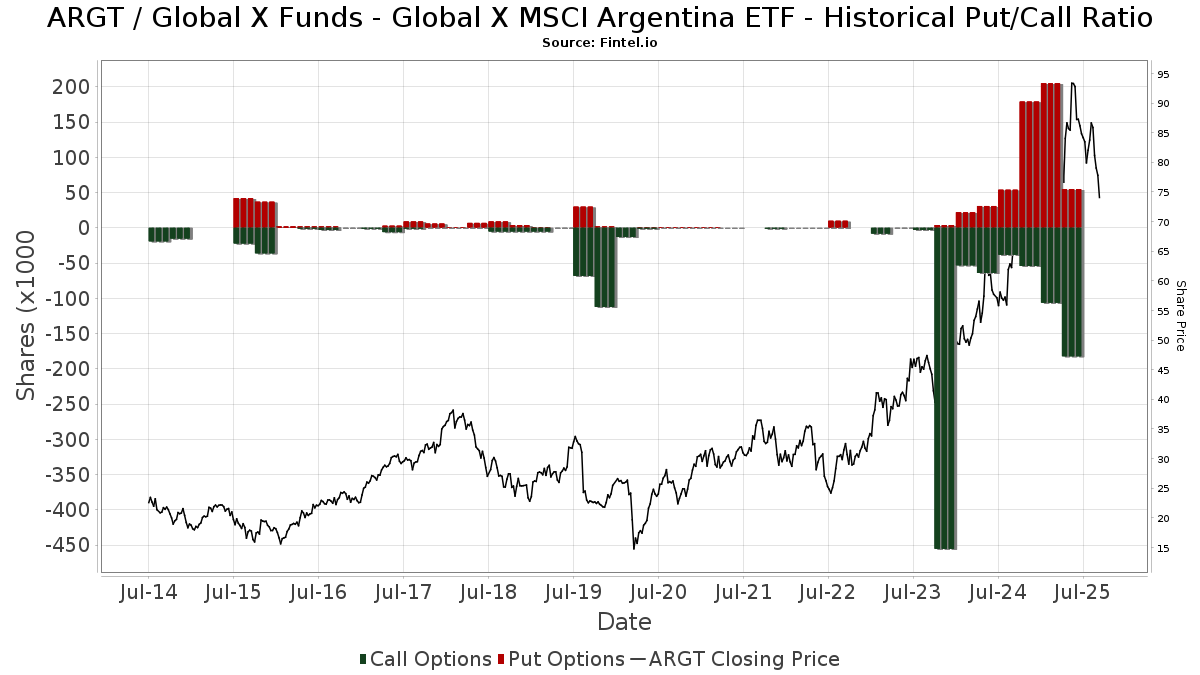
Institutionel Put/Call-forhold
Ud over at indberette standardaktie- og gældsudstedelser skal institutter med mere end 100 mill. aktiver under forvaltning også oplyse deres put- og call-optionsbeholdninger. Da salgsoptioner generelt indikerer negativ stemning, og købsoptioner indikerer positiv stemning, kan vi få en fornemmelse af den overordnede institutionelle stemning ved at plotte forholdet mellem put og kald. Diagrammet til højre viser det historiske put/call-forhold for dette instrument.
Brug af Put/Call Ratio som en indikator for investorernes stemning overvinder en af de vigtigste mangler ved at bruge totalt institutionelt ejerskab, som er, at en betydelig mængde af aktiver under forvaltning investeres passivt for at spore indekser. Passivt forvaltede fonde køber typisk ikke optioner, så indikatoren for put/call-forholdet følger mere nøje følelsen af aktivt forvaltede fonde.
13F og NPORT arkivering
Detaljer om 13F-arkivering er gratis. Detaljer om NP-ansøgninger kræver et premium-medlemskab. Grønne rækker angiver nye positioner. Røde rækker angiver lukkede positioner. Klik på linket ikon for at se den fulde transaktionshistorik.
Opgrader
for at låse premium-data op og eksportere til Excel ![]() .
.
| Fil dato | Kilde | Investor | Type | Gennemsnitlig pris (Øst) |
Aktier | Δ Aktier (%) |
Rapporteret Værdi ($1000) |
Δ Værdi (%) |
Port Alloc (%) |
|
|---|---|---|---|---|---|---|---|---|---|---|
| 2026-01-14 | 13F | ORG Partners LLC | 20 | 0,00 | 2 | 0,00 | ||||
| 2025-10-17 | 13F | Encompass More Asset Management | 0 | -100,00 | 0 | |||||
| 2025-11-13 | 13F | Barometer Capital Management Inc. | 0 | -100,00 | 0 | |||||
| 2025-10-08 | 13F | Fiduciary Alliance LLC | 0 | -100,00 | 0 | |||||
| 2025-11-13 | 13F | Bank Of Montreal /can/ | 0 | -100,00 | 0 | -100,00 | ||||
| 2026-01-16 | 13F | Park Edge Advisors, LLC | 3.181 | -38,21 | 291 | -19,22 | ||||
| 2026-02-10 | 13F | Rothschild Investment Llc | 200 | 0,00 | 18 | 38,46 | ||||
| 2025-11-14 | 13F | Wolverine Trading, Llc | Put | 3.600 | 261 | |||||
| 2025-11-14 | 13F | Wolverine Trading, Llc | Call | 11.100 | 805 | |||||
| 2026-02-13 | 13F | Morgan Stanley | 582.126 | 245,54 | 53.212 | 352,79 | ||||
| 2026-01-30 | 13F | Us Bancorp \de\ | 5.590 | 0,00 | 511 | 31,11 | ||||
| 2025-11-14 | 13F | Qube Research & Technologies Ltd | 0 | -100,00 | 0 | |||||
| 2026-01-21 | 13F | Sowell Financial Services LLC | 10.674 | -8,41 | 976 | 20,07 | ||||
| 2026-02-12 | 13F | Triumph Capital Management | 1.402 | -4,56 | 128 | 25,49 | ||||
| 2025-11-13 | 13F | FIL Ltd | 0 | -100,00 | 0 | |||||
| 2026-02-13 | 13F | Gts Securities Llc | 2.346 | 214 | ||||||
| 2026-02-17 | 13F | Fmr Llc | 782 | 2,89 | 72 | 33,96 | ||||
| 2025-10-23 | 13F | Spire Wealth Management | 0 | -100,00 | 0 | |||||
| 2026-02-17 | 13F | Tudor Investment Corp Et Al | 4.070 | -9,74 | 372 | 18,47 | ||||
| 2025-10-27 | 13F | Harbor Investment Advisory, Llc | 0 | -100,00 | 0 | |||||
| 2026-02-17 | 13F | Royal Bank Of Canada | 12.320 | -5,82 | 1.126 | 23,46 | ||||
| 2026-02-06 | 13F | Global Retirement Partners, LLC | 0 | -100,00 | 0 | |||||
| 2026-02-12 | 13F | Renaissance Technologies Llc | 6.900 | 631 | ||||||
| 2025-11-14 | 13F | D. E. Shaw & Co., Inc. | 0 | -100,00 | 0 | |||||
| 2026-02-17 | 13F | BTG Pactual Asset Management US LLC | Call | 0 | -100,00 | 0 | ||||
| 2026-01-21 | 13F | Capital Investment Advisory Services, LLC | 100 | 9 | ||||||
| 2026-02-17 | 13F | DZ BANK AG Deutsche Zentral Genossenschafts Bank, Frankfurt am Main | 5.900 | 0,00 | 539 | 31,14 | ||||
| 2026-02-13 | 13F | SRS Capital Advisors, Inc. | 2 | 0 | ||||||
| 2026-02-09 | 13F | Harbour Investments, Inc. | 179 | 258,00 | 16 | 433,33 | ||||
| 2026-02-17 | 13F | Bank Of America Corp /de/ | 34.957 | -12,04 | 3.195 | 15,26 | ||||
| 2025-11-14 | 13F | Hrt Financial Lp | 0 | -100,00 | 0 | |||||
| 2026-02-13 | 13F | Wexford Capital Lp | 21.405 | 1.957 | ||||||
| 2026-01-27 | 13F | Revisor Wealth Management LLC | 2.573 | 250 | ||||||
| 2025-11-14 | 13F | Sona Asset Management (us) Llc | 0 | -100,00 | 0 | |||||
| 2025-11-14 | 13F | Strategic Wealth Partners, Ltd. | 531 | 0,00 | 37 | -15,91 | ||||
| 2026-01-23 | 13F | Altfest L J & Co Inc | 0 | -100,00 | 0 | |||||
| 2026-02-13 | 13F | Ieq Capital, Llc | 35.728 | 0,00 | 3.266 | 31,02 | ||||
| 2026-02-17 | 13F | Old Mission Capital Llc | 0 | -100,00 | 0 | |||||
| 2026-01-08 | 13F | Wealth Enhancement Advisory Services, Llc | 2.309 | 215 | ||||||
| 2026-02-13 | 13F | Wells Fargo & Company/mn | 131 | 9,17 | 12 | 37,50 | ||||
| 2026-01-27 | 13F | Belpointe Asset Management LLC | 3.066 | 280 | ||||||
| 2026-02-17 | 13F | Millennium Management Llc | 0 | -100,00 | 0 | |||||
| 2025-11-07 | 13F | Glaxis Capital Management, LLC | 0 | -100,00 | 0 | |||||
| 2026-01-28 | 13F | Loring Wolcott & Coolidge Fiduciary Advisors Llp/ma | 4.765 | 0,00 | 491 | 39,20 | ||||
| 2026-02-12 | 13F | Wealthspire Advisors, LLC | 0 | -100,00 | 0 | |||||
| 2026-02-13 | 13F | Cavalier Investments, LLC | 24.781 | 3,16 | 2.265 | 89,70 | ||||
| 2026-02-17 | 13F | Breakout Capital Partners, LP | 186.400 | -12,61 | 17.039 | 14,51 | ||||
| 2025-10-30 | 13F | Twin Peaks Wealth Advisors, LLC | 0 | -100,00 | 0 | |||||
| 2025-11-06 | 13F | Fundamentun, Llc | 0 | -100,00 | 0 | -100,00 | ||||
| 2026-02-13 | 13F | NLB Skladi, upravljanje premozenja, d.o.o. | 70.990 | 6.489 | ||||||
| 2026-02-17 | 13F | Cetera Investment Advisers | Call | 0 | -100,00 | 0 | ||||
| 2025-11-07 | 13F | Pnc Financial Services Group, Inc. | 0 | -100,00 | 0 | |||||
| 2026-01-20 | 13F | C2P Capital Advisory Group, LLC d.b.a. Prosperity Capital Advisors | 0 | -100,00 | 0 | |||||
| 2026-01-21 | 13F | Capital Advisors, Ltd. LLC | 40.965 | 6.938,66 | 2 | |||||
| 2026-01-15 | 13F | Brookstone Capital Management | 5.580 | -5,01 | 510 | 24,69 | ||||
| 2026-01-29 | 13F | Comerica Bank | 170 | -36,57 | 16 | -16,67 | ||||
| 2026-02-17 | 13F | Trexquant Investment LP | 2.563 | -48,02 | 234 | -31,78 | ||||
| 2026-02-12 | 13F | Principal Securities, Inc. | 0 | -100,00 | 0 | |||||
| 2026-02-05 | 13F | Allworth Financial LP | 0 | -100,00 | 0 | |||||
| 2026-02-12 | 13F | Federation des caisses Desjardins du Quebec | 92 | -63,20 | 8 | -52,94 | ||||
| 2026-01-30 | 13F | Activest Wealth Management | 30.620 | -31,43 | 2.799 | -10,18 | ||||
| 2025-11-13 | 13F | Crewe Advisors LLC | 0 | -100,00 | 0 | |||||
| 2025-11-12 | 13F | Creative Financial Designs Inc /adv | 0 | -100,00 | 0 | |||||
| 2026-02-13 | 13F | Toroso Investments, LLC | 0 | -100,00 | 0 | |||||
| 2025-11-13 | 13F | Gordian Capital Singapore Pte Ltd | 0 | -100,00 | 0 | |||||
| 2025-11-14 | 13F | Kite Lake Capital Management (uk) Llp | 0 | -100,00 | 0 | |||||
| 2026-02-17 | 13F | Atom Investors LP | 0 | -100,00 | 0 | |||||
| 2026-02-11 | 13F | Jpmorgan Chase & Co | 42.952 | -17,26 | 3.926 | 8,42 | ||||
| 2026-01-13 | 13F | CoreCap Advisors, LLC | 937 | -4,58 | 86 | 25,00 | ||||
| 2025-10-22 | 13F | Kercheville Advisors, LLC | 0 | -100,00 | 0 | |||||
| 2026-02-13 | 13F | National Bank Of Canada /fi/ | 22.905 | 1.031,11 | 2.094 | 1.384,40 | ||||
| 2026-02-10 | 13F | Bnp Paribas Arbitrage, Sa | 22.112 | -41,29 | 2.021 | -23,07 | ||||
| 2025-11-14 | 13F | Wolverine Trading, Llc | 4.330 | 314 | ||||||
| 2026-02-17 | 13F | Point72 Asset Management, L.P. | Call | 40.000 | 3.656 | |||||
| 2026-02-10 | 13F | Envestnet Asset Management Inc | 3.824 | -7,52 | 350 | 21,18 | ||||
| 2025-10-27 | 13F | Belvedere Trading LLC | Put | 0 | -100,00 | 0 | ||||
| 2025-10-27 | 13F | Belvedere Trading LLC | Call | 0 | -100,00 | 0 | ||||
| 2025-10-27 | 13F | Belvedere Trading LLC | 0 | -100,00 | 0 | |||||
| 2026-01-23 | 13F | Rfg Holdings, Inc. | 31.330 | 2,46 | 2.864 | 34,22 | ||||
| 2026-01-26 | 13F | Moran Wealth Management, LLC | 0 | -100,00 | 0 | |||||
| 2026-01-28 | 13F | Legacy Capital Group California, Inc. | 0 | -100,00 | 0 | |||||
| 2025-10-15 | 13F | Private Trust Co Na | 0 | -100,00 | 0 | |||||
| 2025-10-31 | 13F | National Asset Management, Inc. | 0 | -100,00 | 0 | |||||
| 2026-02-11 | 13F | Group One Trading, L.p. | 14.556 | 193,23 | 1.331 | 284,39 | ||||
| 2026-01-26 | 13F | Whittier Trust Co | 419 | -18,00 | 39 | 21,88 | ||||
| 2026-02-13 | 13F | Kestra Advisory Services, LLC | 1.059 | 97 | ||||||
| 2026-02-17 | 13F | Raymond James Financial Inc | 51.755 | 93,19 | 4.731 | 153,21 | ||||
| 2026-02-10 | 13F | Black Swift Group, LLC | 4.445 | 406 | ||||||
| 2026-02-13 | 13F | Stifel Financial Corp | 0 | -100,00 | 0 | |||||
| 2026-02-12 | 13F | Loomis Sayles & Co L P | 1.575 | -5,97 | 144 | 23,28 | ||||
| 2026-02-12 | 13F | Banco BTG Pactual S.A. | 4.500 | -11,76 | 411 | 15,77 | ||||
| 2026-02-12 | 13F | Jane Street Group, Llc | 61.637 | -41,87 | 5.634 | -23,83 | ||||
| 2026-02-13 | 13F | MAI Capital Management | 150 | 0,00 | 14 | 30,00 | ||||
| 2025-10-28 | 13F | Leavell Investment Management, Inc. | 0 | -100,00 | 0 | |||||
| 2026-02-12 | 13F | Steward Partners Investment Advisory, Llc | 3.264 | 158,23 | 298 | 238,64 | ||||
| 2026-02-04 | 13F | MADDEN SECURITIES Corp | 3.000 | 0,00 | 274 | 31,10 | ||||
| 2026-02-17 | 13F | Clear Street Markets Llc | 7.400 | 676 | ||||||
| 2026-02-10 | 13F | Channing Global Advisors, Llc | 2.122 | 194 | ||||||
| 2025-10-07 | 13F | Family Legacy Financial Solutions, LLC | 0 | -100,00 | 0 | |||||
| 2026-01-12 | 13F | DAVENPORT & Co LLC | 4.078 | 7,37 | 373 | 40,91 | ||||
| 2026-01-26 | 13F | AE Wealth Management LLC | 127 | -12,41 | 12 | 10,00 | ||||
| 2026-02-13 | 13F | Southeast Asset Advisors Inc. | 20.000 | 1.828 | ||||||
| 2026-02-10 | 13F | CIBC World Markets Inc. | 3.068 | 0,00 | 280 | 30,84 | ||||
| 2026-02-12 | 13F | Commonwealth Equity Services, Llc | 9.207 | -12,26 | 842 | |||||
| 2026-02-17 | 13F | Citadel Advisors Llc | Call | 22.200 | -62,24 | 2.029 | -50,52 | |||
| 2026-02-17 | 13F | Balyasny Asset Management Llc | 11.699 | 1.069 | ||||||
| 2026-02-13 | 13F | Flow Traders U.s. Llc | 17.406 | 14,75 | 2 | 0,00 | ||||
| 2026-02-17 | 13F | Citadel Advisors Llc | Put | 39.300 | -21,56 | 3.592 | 2,80 | |||
| 2026-02-17 | 13F | Citadel Advisors Llc | 86.347 | 761,23 | 7.893 | 1.029,04 | ||||
| 2026-02-17 | 13F | Susquehanna International Group, Llp | 36.279 | -58,88 | 3.316 | -46,12 | ||||
| 2025-10-30 | 13F | Ridgewood Investments LLC | 0 | -100,00 | 0 | |||||
| 2026-02-05 | 13F | Cambridge Investment Research Advisors, Inc. | 0 | -100,00 | 0 | |||||
| 2025-11-07 | 13F | Coco Enterprises, LLC | 0 | -100,00 | 0 | |||||
| 2025-11-14 | 13F | Tower Research Capital LLC (TRC) | 0 | -100,00 | 0 | |||||
| 2025-12-01 | 13F | Private Wealth Advisors, LLC | 0 | -100,00 | 0 | |||||
| 2026-02-17 | 13F | Susquehanna International Group, Llp | Put | 36.800 | 5,44 | 3.364 | 38,17 | |||
| 2025-10-06 | 13F | Grove Bank & Trust | 0 | -100,00 | 0 | |||||
| 2026-02-17 | 13F | Susquehanna International Group, Llp | Call | 80.200 | -21,22 | 7.331 | 3,24 | |||
| 2026-01-20 | 13F | Stratos Wealth Advisors, LLC | 2.242 | 205 | ||||||
| 2026-02-09 | 13F | Smithfield Trust Co | 237 | 0,00 | 0 | |||||
| 2026-02-17 | 13F | Intrepid Family Office Llc | 0 | -100,00 | 0 | -100,00 | ||||
| 2026-02-13 | 13F | Towarzystwo Funduszy Inwestycyjnych Pzu Sa | 0 | -100,00 | 0 | |||||
| 2026-02-11 | 13F | Simplex Trading, Llc | 5.481 | 501 | ||||||
| 2026-02-17 | 13F | Nwi Management Lp | 8.900 | 0,00 | 1 | |||||
| 2025-11-12 | 13F | Blair William & Co/il | 0 | -100,00 | 0 | -100,00 | ||||
| 2026-02-11 | 13F | LPL Financial LLC | 84.631 | -9,17 | 7.736 | 19,02 | ||||
| 2026-01-21 | 13F | SJS Investment Consulting Inc. | 22 | 4,76 | 2 | 100,00 | ||||
| 2025-11-10 | 13F | EverSource Wealth Advisors, LLC | 0 | -100,00 | 0 | |||||
| 2025-11-12 | 13F | Itau Unibanco Holding S.A. | 0 | -100,00 | 0 | |||||
| 2025-11-14 | 13F | Two Sigma Securities, Llc | 0 | -100,00 | 0 | |||||
| 2026-01-28 | 13F | Geneos Wealth Management Inc. | 550 | -17,29 | 50 | 8,70 | ||||
| 2025-11-18 | 13F | Advisory Services Network, LLC | 0 | -100,00 | 0 | |||||
| 2026-02-17 | 13F | Advisor Group Holdings, Inc. | 5.405 | -31,41 | 494 | -19,15 | ||||
| 2026-02-17 | 13F | Ameriprise Financial Inc | 15.399 | -20,53 | 1.408 | 4,15 | ||||
| 2026-02-10 | 13F | Goldman Sachs Group Inc | 2.712 | 248 | ||||||
| 2026-02-17 | 13F | Private Advisor Group, LLC | 22.532 | -23,42 | 2.060 | 0,34 | ||||
| 2025-11-12 | 13F | Laffer Investments | 0 | -100,00 | 0 | -100,00 | ||||
| 2026-01-23 | 13F | Farther Finance Advisors, LLC | 120 | 400,00 | 11 | 900,00 | ||||
| 2026-02-06 | 13F | Verde Servicos Internacionais S.A. | 0 | -100,00 | 0 | |||||
| 2026-02-14 | 13F | Rockefeller Capital Management L.P. | 5.318 | -10,37 | 486 | 17,68 | ||||
| 2026-02-06 | 13F | HighTower Advisors, LLC | 7.569 | 0,38 | 692 | 31,62 | ||||
| 2026-02-10 | 13F | Foundations Investment Advisors, LLC | 11.653 | 21,44 | 1.065 | 59,19 | ||||
| 2026-02-17 | 13F | State Of Wisconsin Investment Board | 26.800 | 2.450 | ||||||
| 2026-02-09 | 13F | Praxis Capital Management LLC | 3.000 | 274 | ||||||
| 2026-02-11 | 13F | Fore Capital, LLC | Put | 0 | -100,00 | 0 | ||||
| 2025-11-13 | 13F | Marshall Wace, Llp | 0 | -100,00 | 0 | |||||
| 2026-02-11 | 13F | Fore Capital, LLC | 0 | -100,00 | 0 | |||||
| 2025-10-27 | 13F | Optima Capital Llc | 0 | -100,00 | 0 | -100,00 | ||||
| 2025-11-06 | 13F | Stratos Wealth Partners, LTD. | 0 | -100,00 | 0 | |||||
| 2025-11-03 | 13F | TD Waterhouse Canada Inc. | 0 | -100,00 | 0 | |||||
| 2026-02-17 | 13F | Cetera Investment Advisers | 8.682 | 3,05 | 794 | 35,09 | ||||
| 2026-02-10 | 13F | Parametrica Management Ltd | 11.900 | -11,19 | 1.088 | 16,38 | ||||
| 2025-11-13 | 13F | Basso Capital Management, L.p. | 0 | -100,00 | 0 | |||||
| 2026-02-02 | 13F | Varma Mutual Pension Insurance Co | 64.599 | 5.905 | ||||||
| 2026-02-05 | 13F | Bank Julius Baer & Co. Ltd, Zurich | 311.469 | 3,76 | 28.471 | 35,96 | ||||
| 2026-02-13 | 13F | Gen-Wealth Partners Inc | 3.222 | 2,03 | 295 | 33,64 | ||||
| 2026-01-12 | 13F | Contravisory Investment Management, Inc. | 0 | -100,00 | 0 | |||||
| 2026-02-13 | 13F | City Of London Investment Management Co Ltd | 29.000 | -30,12 | 2.651 | -8,46 | ||||
| 2026-02-06 | 13F | Berbice Capital Management LLC | 0 | -100,00 | 0 | |||||
| 2025-11-13 | 13F | Riggs Asset Managment Co. Inc. | 0 | -100,00 | 0 | |||||
| 2026-02-17 | 13F | Duquesne Family Office LLC | 0 | -100,00 | 0 | |||||
| 2026-01-29 | 13F | UBS Group AG | 21.407 | -84,20 | 1.957 | -79,31 | ||||
| 2026-02-06 | 13F | IFP Advisors, Inc | 125 | 11 | ||||||
| 2026-02-19 | 13F | Harbour Wealth Management Group, Inc. | 6.983 | 638 | ||||||
| 2025-10-28 | 13F | Csenge Advisory Group | 0 | -100,00 | 0 | |||||
| 2026-02-13 | 13F | Global Endowment Management, LP | 10.000 | -16,67 | 914 | 9,20 | ||||
| 2026-01-23 | 13F | Clear Creek Financial Management, LLC | 20.016 | -2,52 | 1.830 | 27,72 | ||||
| 2026-01-29 | 13F | Aprio Wealth Management, LLC | 4.354 | -27,60 | 398 | -5,01 |