Grundlæggende statistik
| Institutionelle ejere | 166 total, 166 long only, 0 short only, 0 long/short - change of 8,44% MRQ |
| Gennemsnitlig porteføljeallokering | 0.1104 % - change of 35,17% MRQ |
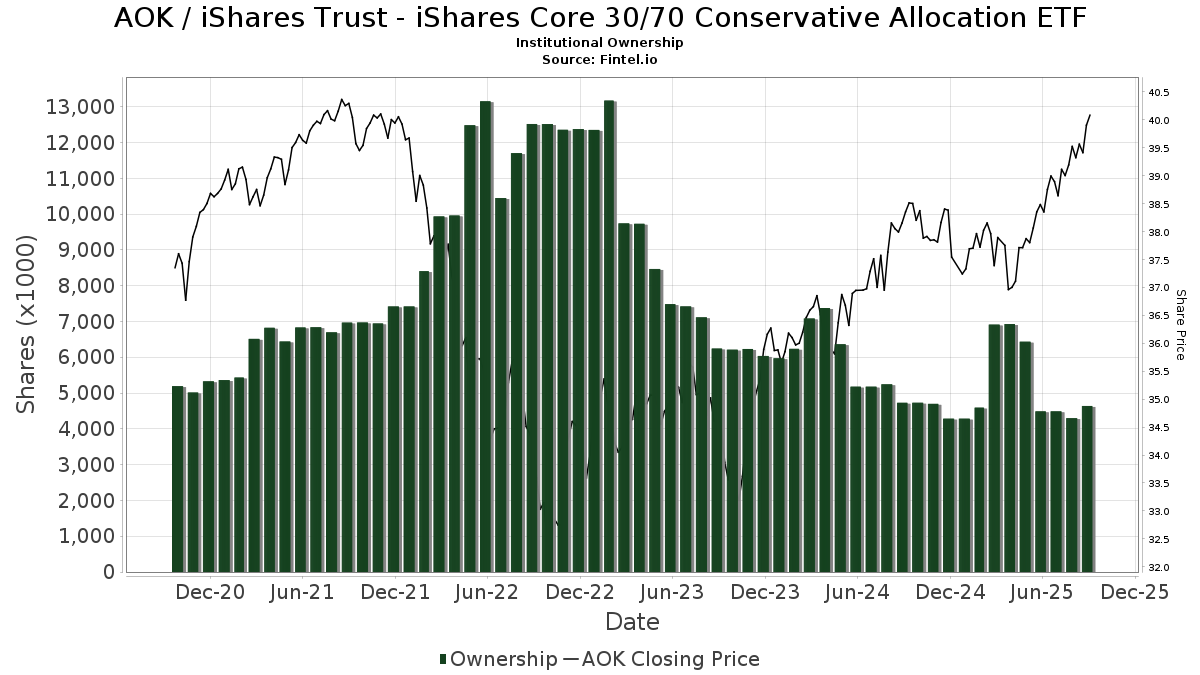
| Institutionelle aktier (lange) | 5.617.606 (ex 13D/G) - change of 1,64MM shares 41,26% MRQ |
| Institutionel værdi (lang) | $ 219.255 USD ($1000) |
Institutionelt ejerskab og aktionærer
iShares Trust - iShares Core 30/70 Conservative Allocation ETF (US:AOK) har 166 institutionelle ejere og aktionærer, der har indsendt 13D/G- eller 13F-formularer til Securities Exchange Commission (SEC). Disse institutioner har i alt 5,617,606 aktier. Største aktionærer omfatter LPL Financial LLC, Raymond James Financial Inc, Strategic Investment Solutions, Inc. /IL, BlackRock, Inc., Morgan Stanley, Cetera Investment Advisers, Bank Of America Corp /de/, Curran Financial Partners, LLC, Wells Fargo & Company/mn, and Lido Advisors, LLC .
iShares Trust - iShares Core 30/70 Conservative Allocation ETF (ARCA:AOK) institutionel ejerskabsstruktur viser aktuelle positioner i virksomheden efter institutioner og fonde, samt seneste ændringer i positionsstørrelse. Større aktionærer kan omfatte individuelle investorer, investeringsforeninger, hedgefonde eller institutioner. Skema 13D angiver, at investoren besidder (eller besidder) mere end 5 % af virksomheden og har til hensigt (eller har til hensigt at) aktivt at forfølge en ændring i forretningsstrategi. Skema 13G indikerer en passiv investering på over 5%.
The share price as of April 2, 2026 is 39,90 / share. Previously, on April 7, 2025, the share price was 36,30 / share. This represents an increase of 9,92% over that period.
Fondens stemningsscore
Fund Sentiment Score (fka Ownership Accumulation Score) finder de aktier, der bliver mest købt af fonde. Det er resultatet af en sofistikeret, multi-faktor kvantitativ model, der identificerer virksomheder med de højeste niveauer af institutionel akkumulering. Scoringsmodellen bruger en kombination af den samlede stigning i oplyste ejere, ændringerne i porteføljeallokeringer i disse ejere og andre målinger. Tallet går fra 0 til 100, hvor højere tal indikerer et højere niveau af akkumulering for sine jævnaldrende, og 50 er gennemsnittet.
Opdateringsfrekvens: Dagligt
Se Ownership Explorer, som giver en liste over højest rangerende virksomheder.
AI+ Ask Fintel’s AI assistant about iShares Trust - iShares Core 30/70 Conservative Allocation ETF.
Select a question to share a public post with an AI-crafted answer.
Thinking of good questions…
Institutionel Put/Call-forhold
Ud over at indberette standardaktie- og gældsudstedelser skal institutter med mere end 100 mill. aktiver under forvaltning også oplyse deres put- og call-optionsbeholdninger. Da salgsoptioner generelt indikerer negativ stemning, og købsoptioner indikerer positiv stemning, kan vi få en fornemmelse af den overordnede institutionelle stemning ved at plotte forholdet mellem put og kald. Diagrammet til højre viser det historiske put/call-forhold for dette instrument.
Brug af Put/Call Ratio som en indikator for investorernes stemning overvinder en af de vigtigste mangler ved at bruge totalt institutionelt ejerskab, som er, at en betydelig mængde af aktiver under forvaltning investeres passivt for at spore indekser. Passivt forvaltede fonde køber typisk ikke optioner, så indikatoren for put/call-forholdet følger mere nøje følelsen af aktivt forvaltede fonde.
13F og NPORT arkivering
Detaljer om 13F-arkivering er gratis. Detaljer om NP-ansøgninger kræver et premium-medlemskab. Grønne rækker angiver nye positioner. Røde rækker angiver lukkede positioner. Klik på linket ikon for at se den fulde transaktionshistorik.
Opgrader
for at låse premium-data op og eksportere til Excel ![]() .
.
| Fil dato | Kilde | Investor | Type | Gennemsnitlig pris (Øst) |
Aktier | Δ Aktier (%) |
Rapporteret Værdi ($1000) |
Δ Værdi (%) |
Port Alloc (%) |
|
|---|---|---|---|---|---|---|---|---|---|---|
| 2026-02-18 | 13F | Onyx Bridge Wealth Group LLC | 32.705 | 1,23 | 1.312 | 1,16 | ||||
| 2026-01-07 | 13F | Sovereign Financial Group, Inc. | 28.369 | 83,96 | 1.138 | 83,84 | ||||
| 2026-02-03 | 13F | Coston, McIsaac & Partners | 459 | 1,32 | 0 | |||||
| 2025-10-27 | 13F | Td Private Client Wealth Llc | 0 | -100,00 | 0 | -100,00 | ||||
| 2026-02-10 | 13F | Bnp Paribas Arbitrage, Sa | 30 | 1 | ||||||
| 2026-02-17 | 13F | Advisor Group Holdings, Inc. | 58.293 | 42,96 | 2.340 | 44,38 | ||||
| 2025-11-04 | 13F | Pineridge Advisors LLC | 58 | 0,00 | 2 | 0,00 | ||||
| 2025-11-07 | 13F | Pnc Financial Services Group, Inc. | 0 | -100,00 | 0 | |||||
| 2026-02-03 | 13F | Costello Asset Management, INC | 2.635 | 0,00 | 106 | 0,00 | ||||
| 2026-02-06 | 13F | Lloyd Advisory Services, LLC. | 4 | 0 | ||||||
| 2026-02-12 | 13F | Principal Securities, Inc. | 0 | -100,00 | 0 | -100,00 | ||||
| 2026-01-16 | 13F | Legacy Capital Wealth Partners, LLC | 54.879 | -0,80 | 2.202 | -0,86 | ||||
| 2026-02-05 | 13F | Legacy Financial Group LLC | 9.191 | 7,74 | 373 | 8,77 | ||||
| 2026-02-05 | 13F | Western Wealth Management, LLC | 5.084 | 0,00 | 204 | 0,00 | ||||
| 2026-01-16 | 13F | BridgePort Financial Solutions, LLC | 6.986 | -0,03 | 280 | 0,00 | ||||
| 2026-01-30 | 13F | United Community Bank | 1.425 | 0,00 | 57 | 0,00 | ||||
| 2026-01-21 | 13F | Modera Wealth Management, LLC | 18.275 | 0,00 | 733 | 0,00 | ||||
| 2026-02-17 | 13F | Gladstone Institutional Advisory LLC | 51.945 | 2,03 | 2.085 | 1,96 | ||||
| 2026-01-27 | 13F | Elevated Capital Advisors, LLC | 328 | 13 | ||||||
| 2026-02-12 | 13F | Bank Of Montreal /can/ | 8.207 | 0,00 | 329 | 0,00 | ||||
| 2026-02-17 | 13F | Royal Bank Of Canada | 39.336 | 28,97 | 1.578 | 28,82 | ||||
| 2026-02-10 | 13F | Weaver Consulting Group | 146.430 | 1,48 | 5.876 | 1,42 | ||||
| 2026-01-07 | 13F | Harbor Investment Advisory, Llc | 347 | 0,00 | 14 | 0,00 | ||||
| 2026-02-11 | 13F | Gilpin Wealth Management, Llc | 41.371 | 1.660 | ||||||
| 2026-02-09 | 13F | Hartland & Co., LLC | 15 | 0,00 | 1 | |||||
| 2026-01-29 | 13F | Nbc Securities, Inc. | 729 | 26,78 | 29 | 26,09 | ||||
| 2026-02-06 | 13F | Global Retirement Partners, LLC | 1.087 | 64,20 | 44 | 65,38 | ||||
| 2026-02-04 | 13F | Mascoma Wealth Management LLC | 183 | 0,00 | 7 | 0,00 | ||||
| 2026-02-17 | 13F | Equitable Holdings, Inc. | 19.639 | 18,56 | 788 | 18,50 | ||||
| 2025-11-17 | 13F | FSA Wealth Management LLC | 288 | 0,00 | 12 | 0,00 | ||||
| 2026-02-03 | 13F | Plan Group Financial, LLC | 0 | -100,00 | 0 | |||||
| 2026-02-17 | 13F | SageView Advisory Group, LLC | 477 | 19 | ||||||
| 2026-01-29 | 13F | UBS Group AG | 28.707 | 0,33 | 1.152 | 0,26 | ||||
| 2026-02-10 | 13F/A | Northwestern Mutual Wealth Management Co | 648 | 2,05 | 26 | 0,00 | ||||
| 2026-02-17 | 13F | Fmr Llc | 6.061 | 11,37 | 243 | 11,47 | ||||
| 2026-01-30 | 13F | RCW Management, LLC | 31.989 | 1.284 | ||||||
| 2026-02-05 | 13F | HFM Investment Advisors, LLC | 577 | 0,00 | 23 | 0,00 | ||||
| 2026-01-23 | 13F | High Net Worth Advisory Group LLC | 43.650 | 1.752 | ||||||
| 2026-01-26 | 13F | Consilium Wealth Advisory, LLC | 36.295 | -2,16 | 1.457 | -2,22 | ||||
| 2026-02-12 | 13F | Rik Saylor Financial, Inc. | 29.455 | -0,54 | 1.182 | -0,59 | ||||
| 2026-02-17 | 13F | Insight Wealth Partners, LLC | 9.401 | 0,00 | 377 | 0,00 | ||||
| 2026-02-12 | 13F | Steward Partners Investment Advisory, Llc | 26.804 | 27,67 | 1.076 | 27,52 | ||||
| 2026-01-22 | 13F | Curran Financial Partners, LLC | 174.567 | 12,91 | 7.005 | 12,82 | ||||
| 2026-02-06 | 13F | IFP Advisors, Inc | 4.630 | -4,12 | 186 | -4,15 | ||||
| 2025-11-14 | 13F | Moors & Cabot, Inc. | 0 | -100,00 | 0 | -100,00 | ||||
| 2026-02-05 | 13F | Cambridge Investment Research Advisors, Inc. | 92.818 | 7,19 | 4 | 0,00 | ||||
| 2026-01-20 | 13F | AdvisorNet Financial, Inc | 973 | 32,02 | 39 | 34,48 | ||||
| 2026-02-10 | 13F | Verus Capital Partners, Llc | 11.580 | 60,95 | 465 | 61,11 | ||||
| 2026-01-15 | 13F | Brookstone Capital Management | 30.769 | 17,80 | 1.235 | 17,75 | ||||
| 2026-01-26 | 13F | Private Trust Co Na | 300 | 0,00 | 12 | 0,00 | ||||
| 2026-01-23 | 13F | Investment Advisory Group, LLC | 144.388 | 1,38 | 5.794 | 1,31 | ||||
| 2026-02-17 | 13F | Camarda Financial Advisors, LLC | 0 | -100,00 | 0 | |||||
| 2026-02-17 | 13F | Forefront Analytics, LLC | 58.682 | 2.354 | ||||||
| 2026-02-13 | 13F | Morgan Stanley | 241.151 | 22,11 | 9.677 | 22,03 | ||||
| 2026-02-17 | 13F | Legacy Wealth Partners, LLC | 17.900 | 718 | ||||||
| 2025-11-10 | 13F | Redmond Asset Management, LLC | 0 | -100,00 | 0 | |||||
| 2026-01-26 | 13F | Cwm, Llc | 3.666 | -61,76 | 0 | |||||
| 2026-02-10 | 13F | David R. Rahn & Associates Inc. | 0 | -100,00 | 0 | |||||
| 2026-01-06 | 13F | Unique Wealth, Llc | 12.272 | -0,53 | 492 | -0,61 | ||||
| 2026-01-26 | 13F | Elevation Capital Advisory, LLC | 26.059 | 161,79 | 1.046 | 161,90 | ||||
| 2025-11-14 | 13F | Goldman Sachs Group Inc | 0 | -100,00 | 0 | |||||
| 2026-01-29 | 13F | Advisors Capital Management, LLC | 8.904 | 357 | ||||||
| 2026-02-13 | 13F | Visionary Wealth Advisors | 48.378 | -51,25 | 1.941 | -51,29 | ||||
| 2026-01-27 | 13F | TD Waterhouse Canada Inc. | 3.781 | 73,92 | 152 | 74,71 | ||||
| 2026-02-10 | 13F | Evolution Wealth Management Inc. | 1.777 | 71 | ||||||
| 2026-02-17 | 13F | Prosperity Consulting Group, LLC | 14.493 | 19,71 | 582 | 19,55 | ||||
| 2026-02-19 | 13F | CI Private Wealth, LLC | 35.003 | 0,67 | 1.405 | 0,57 | ||||
| 2026-02-17 | 13F | Jones Financial Companies Lllp | 8.652 | 267,39 | 347 | 269,15 | ||||
| 2026-02-17 | 13F | First Commonwealth Financial Corp /pa/ | 6.000 | 0,00 | 241 | 0,00 | ||||
| 2025-11-10 | 13F | Siligmueller & Norvid Wealth Advisors LLC | 22.519 | 904 | ||||||
| 2026-01-21 | 13F | Westfuller Advisors, LLC | 444 | 1,37 | 18 | 0,00 | ||||
| 2026-04-02 | 13F | Horizons Wealth Management | 156 | 0,00 | 6 | 0,00 | ||||
| 2026-02-10 | 13F | Tidemark, LLC | 551 | 0,00 | 22 | 0,00 | ||||
| 2026-01-20 | 13F | Wall Street Access Asset Management, LLC | 3.931 | 158 | ||||||
| 2026-01-30 | 13F | Kohmann Bosshard Financial Services, LLC | 753 | 30 | ||||||
| 2026-02-12 | 13F | Hrt Financial Lp | 5.224 | 0 | ||||||
| 2026-02-12 | 13F | Commonwealth Equity Services, Llc | 37.290 | 7,60 | 1.496 | 149.500,00 | ||||
| 2026-02-17 | 13F | Cetera Investment Advisers | 197.767 | 93,28 | 7.936 | 93,14 | ||||
| 2026-01-27 | 13F | RTD Financial Advisors, Inc. | 8.287 | -9,91 | 333 | -10,03 | ||||
| 2026-02-10 | 13F | Waterloo Capital, L.P. | 36.058 | 157,69 | 1.447 | 157,93 | ||||
| 2026-01-20 | 13F | Nvwm, Llc | 176 | 0,00 | 7 | 0,00 | ||||
| 2026-01-30 | 13F | Archer Investment Corp | 617 | 0,00 | 25 | 0,00 | ||||
| 2026-02-12 | 13F | BlackRock, Inc. | 318.824 | -0,17 | 12.794 | -0,24 | ||||
| 2025-11-05 | 13F | Capital Investment Advisory Services, LLC | 0 | -100,00 | 0 | |||||
| 2026-02-10 | 13F | Foundations Investment Advisors, LLC | 76.339 | -4,85 | 3.063 | -4,93 | ||||
| 2026-02-05 | 13F | Allworth Financial LP | 3.142 | -8,64 | 126 | -8,70 | ||||
| 2026-02-17 | 13F | Ameriprise Financial Inc | 38.592 | 8,69 | 1.549 | 8,63 | ||||
| 2026-02-10 | 13F | One Capital Management, LLC | 17.882 | -0,58 | 718 | -0,69 | ||||
| 2026-02-13 | 13F | Wells Fargo & Company/mn | 157.700 | 54,77 | 6.329 | 54,68 | ||||
| 2026-01-23 | 13F | Farther Finance Advisors, LLC | 2.765 | 175,12 | 111 | 175,00 | ||||
| 2026-02-13 | 13F | Perryman Financial Advisory Inc /ad | 23.232 | 932 | ||||||
| 2026-01-12 | 13F | Divergent Planning, LLC | 6.001 | 242 | ||||||
| 2026-02-17 | 13F | Susquehanna International Group, Llp | 40.410 | 278,34 | 1.622 | 278,74 | ||||
| 2026-02-17 | 13F | Private Advisor Group, LLC | 75.264 | 22,46 | 3.020 | 22,37 | ||||
| 2026-02-11 | 13F | Endeavor Private Wealth, Inc. | 5.258 | 0,00 | 211 | 0,00 | ||||
| 2026-01-27 | 13F | Phil A. Younker & Associates, Ltd. | 23.436 | 940 | ||||||
| 2026-02-12 | 13F | Federation des caisses Desjardins du Quebec | 10.989 | 0,00 | 441 | -0,23 | ||||
| 2026-02-13 | 13F | National Bank Of Canada /fi/ | 38.921 | -6,87 | 1.566 | -6,56 | ||||
| 2026-02-13 | 13F | Mml Investors Services, Llc | 8.966 | -7,85 | 360 | -7,95 | ||||
| 2026-01-27 | 13F | Sage Financial Group Inc | 9.495 | 381 | ||||||
| 2026-02-13 | 13F | Nicolet Advisory Services, Llc | 7.260 | 0,23 | 295 | 1,37 | ||||
| 2026-02-04 | 13F | Win Advisors, Inc | 22.281 | 894 | ||||||
| 2026-02-02 | 13F | Benjamin Edwards Inc | 5.699 | 229 | ||||||
| 2026-02-17 | 13F | Citadel Advisors Llc | 0 | -100,00 | 0 | |||||
| 2026-01-22 | 13F | Harwood Advisory Group, LLC | 8.544 | -1,67 | 343 | -1,72 | ||||
| 2026-01-08 | 13F | Wealth Enhancement Advisory Services, Llc | 6.776 | 19,07 | 275 | 20,18 | ||||
| 2026-02-13 | 13F/A | Archvest Wealth Advisors, Inc. | 11.055 | -4,17 | 444 | -4,32 | ||||
| 2026-02-02 | 13F | CENTRAL TRUST Co | 803 | -33,80 | 32 | -33,33 | ||||
| 2026-02-17 | 13F | Warren Averett Asset Management, LLC | 17.349 | -23,06 | 696 | -23,09 | ||||
| 2026-01-09 | 13F | Congress Asset Management Co /ma | 135.812 | 222,01 | 5.450 | 221,91 | ||||
| 2026-02-13 | 13F | Glen Eagle Advisors, LLC | 1.233 | 1,40 | 49 | 2,08 | ||||
| 2025-10-24 | 13F | Trilogy Capital Inc. | 0 | -100,00 | 0 | |||||
| 2026-01-30 | 13F | Wealth Forward, LLC | 15.409 | -8,20 | 618 | -8,31 | ||||
| 2026-02-09 | 13F | Harbour Investments, Inc. | 30.312 | 0,91 | 1.216 | 0,83 | ||||
| 2026-02-10 | 13F | Envestnet Asset Management Inc | 98.096 | 1.187,35 | 3.937 | 1.186,27 | ||||
| 2026-02-11 | 13F | Janney Capital Management LLC | 17.865 | 1 | ||||||
| 2025-10-17 | 13F | Fortitude Family Office, LLC | 0 | 0 | ||||||
| 2026-04-06 | 13F | CX Institutional | 606 | 4,84 | 0 | |||||
| 2026-02-13 | 13F | MAI Capital Management | 1.873 | 1,41 | 75 | 1,35 | ||||
| 2026-02-17 | 13F | GeoWealth Management, LLC | 8.706 | 8,68 | 349 | 8,72 | ||||
| 2026-01-21 | 13F | Flagship Harbor Advisors, Llc | 2.426 | 97 | ||||||
| 2026-02-13 | 13F | TRUE Private Wealth Advisors | 12.659 | 0,00 | 508 | 0,00 | ||||
| 2026-02-11 | 13F | Jpmorgan Chase & Co | 4.487 | -89,01 | 180 | -89,02 | ||||
| 2026-02-09 | 13F | Delta Asset Management Llc/tn | 475 | 0,00 | 19 | 0,00 | ||||
| 2026-02-13 | 13F | Ausdal Financial Partners, Inc. | 12.113 | -8,97 | 486 | -8,99 | ||||
| 2026-02-06 | 13F | Axxcess Wealth Management, Llc | 8.544 | 343 | ||||||
| 2026-02-13 | 13F | Stifel Financial Corp | 95.395 | 138,67 | 3.828 | 138,50 | ||||
| 2026-02-11 | 13F | Janney Montgomery Scott LLC | 25.929 | 1 | ||||||
| 2025-11-12 | 13F | Bellwether Advisors, LLC | 0 | -100,00 | 0 | -100,00 | ||||
| 2026-02-13 | 13F | SRS Capital Advisors, Inc. | 1.402 | 56 | ||||||
| 2026-02-10 | 13F | Lido Advisors, LLC | 156.719 | 0,00 | 6.294 | 0,00 | ||||
| 2026-02-17 | 13F | Advisory Services Network, LLC | 0 | -100,00 | 0 | |||||
| 2026-02-18 | 13F | GWM Advisors LLC | 0 | -100,00 | 0 | |||||
| 2026-02-11 | 13F | IMA Wealth, Inc. | 3.000 | -11,35 | 120 | 0,84 | ||||
| 2026-01-23 | 13F | Assetmark, Inc | 503 | 0,00 | 20 | 0,00 | ||||
| 2026-01-29 | 13F | Comerica Bank | 4.151 | 474,14 | 167 | 472,41 | ||||
| 2026-02-04 | 13F | Ameritas Advisory Services, LLC | 0 | -100,00 | 0 | |||||
| 2026-01-30 | 13F | Prentice Wealth Management LLC | 5.014 | -0,10 | 201 | 0,00 | ||||
| 2026-02-17 | 13F | Qube Research & Technologies Ltd | 0 | -100,00 | 0 | |||||
| 2025-11-06 | 13F | Prospera Financial Services Inc | 0 | -100,00 | 0 | |||||
| 2026-01-06 | 13F | RDA Financial Network | 18.194 | -7,49 | 730 | -7,48 | ||||
| 2026-01-28 | 13F | Geneos Wealth Management Inc. | 4.004 | 0,00 | 161 | 0,00 | ||||
| 2026-01-26 | 13F | Moss Adams Wealth Advisors LLC | 0 | -100,00 | 0 | |||||
| 2026-02-13 | 13F | Kestra Advisory Services, LLC | 5.257 | -34,54 | 211 | -34,78 | ||||
| 2026-02-13 | 13F | Integrity Financial Corp /WA | 4.318 | -11,12 | 173 | -11,28 | ||||
| 2026-02-02 | 13F | Mutual Advisors, LLC | 5.024 | 0,26 | 202 | -0,50 | ||||
| 2025-11-14 | 13F | Mount Yale Investment Advisors, LLC | 0 | -100,00 | 0 | -100,00 | ||||
| 2026-02-06 | 13F | HighTower Advisors, LLC | 5.661 | -2,51 | 227 | -2,58 | ||||
| 2025-10-10 | 13F | Sound Income Strategies, LLC | 0 | -100,00 | 0 | |||||
| 2026-02-13 | 13F | Denver Wealth Management, Inc. | 7.006 | -1,37 | 281 | -1,40 | ||||
| 2026-01-26 | 13F | AE Wealth Management LLC | 8.367 | -22,84 | 336 | -22,99 | ||||
| 2026-01-14 | 13F | Spire Wealth Management | 7.112 | 0,00 | 285 | 0,00 | ||||
| 2026-02-13 | 13F | Aptus Capital Advisors, LLC | 601 | 0,00 | 24 | 0,00 | ||||
| 2026-01-26 | 13F | Transcendent Capital Group LLC | 7.772 | 0,76 | 312 | 0,65 | ||||
| 2026-02-09 | 13F | Millington Financial Advisors, LLC | 7.394 | -29,75 | 302 | -28,67 | ||||
| 2026-01-12 | 13F | National Wealth Management Group, LLC | 8.020 | 322 | ||||||
| 2026-01-28 | 13F | Chicago Partners Investment Group LLC | 8.926 | 21,49 | 363 | 21,40 | ||||
| 2026-01-14 | 13F | Kmg Fiduciary Partners, Llc | 33.918 | 1,76 | 1.361 | 1,72 | ||||
| 2026-02-17 | 13F | Raymond James Financial Inc | 398.245 | 866,61 | 15.982 | 866,20 | ||||
| 2026-02-13 | 13F | Integrated Wealth Concepts LLC | 19.929 | 15,02 | 800 | 14,96 | ||||
| 2026-02-06 | 13F | BlueStem Wealth Partners, LLC | 31.382 | -7,33 | 1.259 | -7,36 | ||||
| 2026-01-28 | 13F | N.E.W. Advisory Services LLC | 797 | 0,00 | 32 | -3,12 | ||||
| 2026-01-15 | 13F | SILVER OAK SECURITIES, Inc | 15.352 | 32,28 | 620 | 33,05 | ||||
| 2026-02-10 | 13F | Sentinus, LLC | 39.623 | -15,77 | 1.590 | -15,83 | ||||
| 2026-02-06 | 13F | Creative Financial Designs Inc /adv | 14.975 | 3,08 | 601 | 2,92 | ||||
| 2026-02-11 | 13F | J.w. Cole Advisors, Inc. | 35.154 | -0,13 | 1.382 | -2,26 | ||||
| 2026-02-05 | 13F | USAdvisors Wealth Management, LLC | 5.981 | -2,14 | 0 | |||||
| 2026-03-04 | 13F/A | Valpey Financial Services, LLC | 11.467 | 7,69 | 460 | 7,73 | ||||
| 2026-01-06 | 13F | Tucker Asset Management Llc | 0 | -100,00 | 0 | |||||
| 2026-02-11 | 13F | Buckingham Strategic Partners | 6.466 | -53,46 | 260 | -53,83 | ||||
| 2026-02-20 | 13F | Sunbelt Securities, Inc. | 358 | -2,98 | 14 | 0,00 | ||||
| 2026-01-27 | 13F | WestEnd Advisors, LLC | 0 | -100,00 | 0 | |||||
| 2026-02-27 | 13F | Strategic Investment Solutions, Inc. /IL | 388.741 | 15.600 | ||||||
| 2025-11-25 | 13F | Briaud Financial Planning, Inc | 0 | -100,00 | 0 | |||||
| 2026-01-13 | 13F | CoreCap Advisors, LLC | 830 | 0,73 | 33 | 0,00 | ||||
| 2026-02-11 | 13F | O'shaughnessy Asset Management, Llc | 183 | -6,63 | 7 | 0,00 | ||||
| 2026-02-13 | 13F | Golden State Wealth Management, LLC | 657 | -75,14 | 26 | -75,47 | ||||
| 2026-01-16 | 13F | Tempus Wealth Planning, LLC | 6.641 | -1,01 | 266 | -1,12 | ||||
| 2026-02-13 | 13F | 1 North Wealth Services Llc | 1.195 | 0,00 | 48 | 0,00 | ||||
| 2026-02-09 | 13F | Thrive Capital Management, LLC | 26.870 | -15,21 | 1.078 | -15,25 | ||||
| 2026-02-17 | 13F | Valley Financial Group, Inc. | 6.872 | -42,79 | 276 | -42,95 | ||||
| 2026-02-10 | 13F | Root Financial Partners, LLC | 863 | 6,02 | 35 | 6,25 | ||||
| 2026-02-13 | 13F | Mariner, LLC | 39.651 | 16,52 | 1.591 | 16,47 | ||||
| 2026-01-20 | 13F | Aspiriant, Llc | 8.060 | 0,00 | 323 | 0,00 | ||||
| 2026-01-30 | 13F | Caldwell Trust Co | 2.250 | 0,00 | 90 | 0,00 | ||||
| 2026-02-17 | 13F | Bank Of America Corp /de/ | 182.719 | 24,01 | 7.333 | 23,91 | ||||
| 2026-01-13 | 13F | Well Done, LLC | 6.748 | 0,00 | 271 | -0,37 | ||||
| 2026-02-02 | 13F | Bay Harbor Wealth Management, LLC | 3.304 | 3,87 | 133 | 3,94 | ||||
| 2026-02-11 | 13F | LPL Financial LLC | 646.961 | 30,09 | 25.963 | 30,00 | ||||
| 2026-02-02 | 13F | Cornerstone Planning Group LLC | 1.105 | -9,50 | 45 | -8,16 | ||||
| 2026-02-18 | 13F | Vermillion & White Wealth Management Group, LLC | 63 | 3 |