Grundlæggende statistik
| Institutionelle ejere | 184 total, 170 long only, 1 short only, 13 long/short - change of 4,08% MRQ |
| Gennemsnitlig porteføljeallokering | 0.8284 % - change of -11,55% MRQ |
| Institutionelle aktier (lange) | 78.055.896 (ex 13D/G) - change of 5,15MM shares 4,64% MRQ |
| Institutionel værdi (lang) | $ 2.586.395 USD ($1000) |
Institutionelt ejerskab og aktionærer
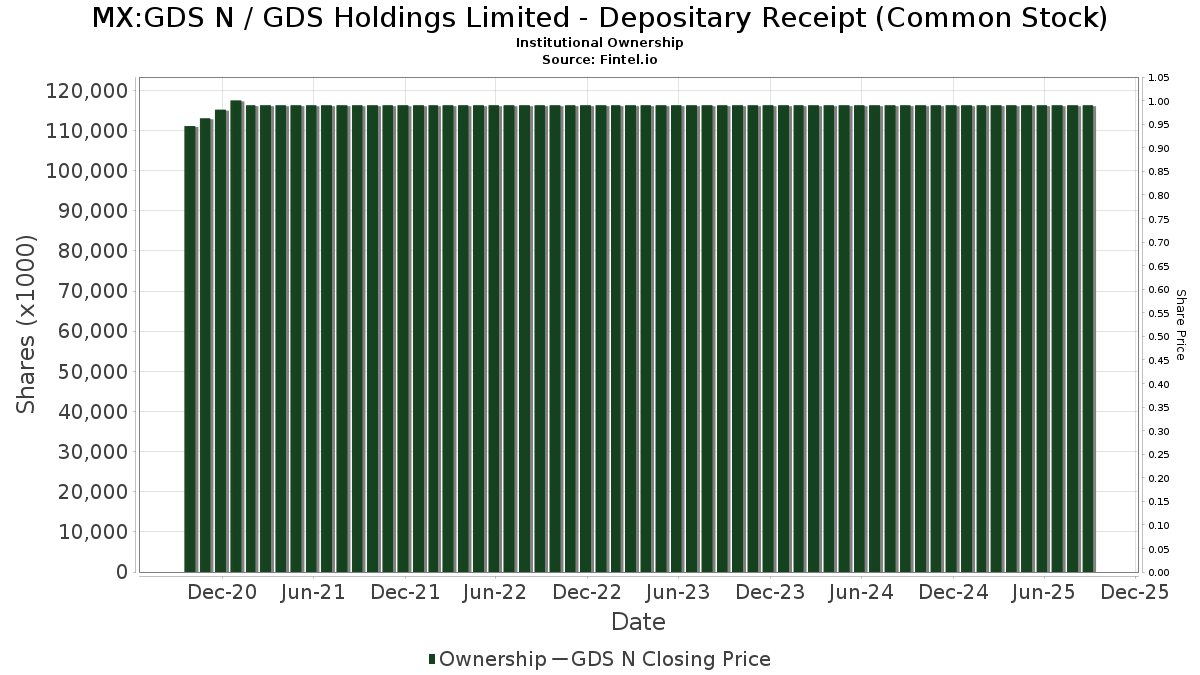
GDS Holdings Limited - Depositary Receipt (Common Stock) (MX:GDS N) har 184 institutionelle ejere og aktionærer, der har indsendt 13D/G- eller 13F-formularer til Securities Exchange Commission (SEC). Disse institutioner har i alt 78,055,896 aktier. Største aktionærer omfatter Singapore Technologies Telemedia Pte Ltd, Sachem Head Capital Management LP, Canada Pension Plan Investment Board, Tekne Capital Management, LLC, 12 West Capital Management LP, Bamco Inc /ny/, Baupost Group Llc/ma, Triata Capital Ltd, Carrhae Capital LLP, and Bank Of America Corp /de/ .
GDS Holdings Limited - Depositary Receipt (Common Stock) (BMV:GDS N) institutionel ejerskabsstruktur viser aktuelle positioner i virksomheden efter institutioner og fonde, samt seneste ændringer i positionsstørrelse. Større aktionærer kan omfatte individuelle investorer, investeringsforeninger, hedgefonde eller institutioner. Skema 13D angiver, at investoren besidder (eller besidder) mere end 5 % af virksomheden og har til hensigt (eller har til hensigt at) aktivt at forfølge en ændring i forretningsstrategi. Skema 13G indikerer en passiv investering på over 5%.
Fondens stemningsscore
Fund Sentiment Score (fka Ownership Accumulation Score) finder de aktier, der bliver mest købt af fonde. Det er resultatet af en sofistikeret, multi-faktor kvantitativ model, der identificerer virksomheder med de højeste niveauer af institutionel akkumulering. Scoringsmodellen bruger en kombination af den samlede stigning i oplyste ejere, ændringerne i porteføljeallokeringer i disse ejere og andre målinger. Tallet går fra 0 til 100, hvor højere tal indikerer et højere niveau af akkumulering for sine jævnaldrende, og 50 er gennemsnittet.
Opdateringsfrekvens: Dagligt
Se Ownership Explorer, som giver en liste over højest rangerende virksomheder.
AI+ Ask Fintel’s AI assistant about GDS Holdings Limited - Depositary Receipt (Common Stock).
Select a question to share a public post with an AI-crafted answer.
Thinking of good questions…
13F og NPORT arkivering
Detaljer om 13F-arkivering er gratis. Detaljer om NP-ansøgninger kræver et premium-medlemskab. Grønne rækker angiver nye positioner. Røde rækker angiver lukkede positioner. Klik på linket ikon for at se den fulde transaktionshistorik.
Opgrader
for at låse premium-data op og eksportere til Excel ![]() .
.
| Fil dato | Kilde | Investor | Type | Gennemsnitlig pris (Øst) |
Aktier | Δ Aktier (%) |
Rapporteret Værdi ($1000) |
Δ Værdi (%) |
Port Alloc (%) |
|
|---|---|---|---|---|---|---|---|---|---|---|
| 2026-02-11 | 13F | IMA Wealth, Inc. | 18 | 1 | ||||||
| 2026-04-27 | 13F | Argos Wealth Advisors, LLC | 14.322 | 0,00 | 577 | 15,63 | ||||
| 2026-02-17 | 13F | Clear Street Markets Llc | 0 | -100,00 | 0 | |||||
| 2026-02-10 | 13F | Quantbot Technologies LP | 403 | 933,33 | 14 | 1.300,00 | ||||
| 2026-02-17 | 13F | Caption Management, LLC | Call | 0 | -100,00 | 0 | ||||
| 2026-02-17 | 13F | Melqart Asset Management (uk) Ltd | 0 | -100,00 | 0 | |||||
| 2026-02-17 | 13F | Laird Norton Trust Company, Llc | 20.428 | 713 | ||||||
| 2026-02-05 | 13F | Baader Bank INC | 15.512 | 535 | ||||||
| 2026-02-17 | 13F | Jones Financial Companies Lllp | 1.108 | 10,69 | 39 | -5,00 | ||||
| 2026-02-17 | 13F | Sig Brokerage, Lp | 0 | -100,00 | 0 | |||||
| 2026-02-10 | 13F/A | Northwestern Mutual Wealth Management Co | 1.787 | 0,00 | 62 | -10,14 | ||||
| 2026-02-02 | 13F | Qrg Capital Management, Inc. | 0 | -100,00 | 0 | |||||
| 2026-02-11 | 13F | Group One Trading, L.p. | Put | 47.000 | -83,57 | 1.640 | -85,19 | |||
| 2026-02-12 | 13F | Jane Street Group, Llc | Call | 476.700 | -12,52 | 16.637 | -21,11 | |||
| 2026-02-17 | 13F | Dv Equities, Llc | 173.200 | 750 | ||||||
| 2026-04-13 | 13F | True Wealth Design, LLC | 23 | 130,00 | 1 | |||||
| 2026-02-06 | 13F | Bare Financial Services, Inc | 23 | 0,00 | 1 | |||||
| 2026-02-17 | 13F | Summit Partners Public Asset Management, Llc | Call | 0 | -100,00 | 0 | ||||
| 2026-02-17 | 13F | Quadrature Capital Ltd | 0 | -100,00 | 0 | |||||
| 2026-03-12 | 13F/A | Peak6 Llc | 121.194 | -15,58 | 4.230 | -23,87 | ||||
| 2026-04-24 | 13F | Ninety One UK Ltd | 3.196 | 129 | ||||||
| 2026-02-11 | 13F | Parallel Advisors, LLC | 6.901 | 3,54 | 241 | -6,61 | ||||
| 2025-11-14 | 13F | Aspex Management (HK) Ltd | 0 | -100,00 | 0 | -100,00 | ||||
| 2026-02-13 | 13F | Healthcare Of Ontario Pension Plan Trust Fund | 0 | -100,00 | 0 | |||||
| 2026-02-02 | 13F | Nkcfo Llc | 0 | -100,00 | 0 | |||||
| 2026-02-09 | 13F | Huntington National Bank | 838 | 0,00 | 29 | -9,37 | ||||
| 2026-02-17 | 13F | Summit Partners Public Asset Management, Llc | 0 | -100,00 | 0 | |||||
| 2026-02-17 | 13F | DV Trading LLC | 20 | 1 | ||||||
| 2025-11-14 | 13F | Millennium Management Llc | Put | 0 | -100,00 | 0 | -100,00 | |||
| 2026-03-06 | 13F | Hsbc Holdings Plc | 309.502 | 628,38 | 10.788 | 542,91 | ||||
| 2026-02-09 | 13F | Legal & General Group Plc | 10.658 | -1,50 | 372 | -11,00 | ||||
| 2026-02-17 | 13F | Balyasny Asset Management Llc | Call | 0 | -100,00 | 0 | ||||
| 2026-02-17 | 13F | CastleKnight Management LP | 34.200 | 0,00 | 1.194 | -9,83 | ||||
| 2026-02-12 | 13F | Jane Street Group, Llc | 0 | -100,00 | 0 | -100,00 | ||||
| 2026-02-17 | 13F | Nishkama Capital, LLC | 557.312 | -23,07 | 19.450 | -30,63 | ||||
| 2026-03-12 | 13F/A | Peak6 Llc | Put | 203.000 | -37,33 | 7.085 | -43,48 | |||
| 2026-02-13 | 13F | Ubs Asset Management Americas Inc | 37 | 1 | ||||||
| 2026-03-12 | 13F/A | Peak6 Llc | Call | 5.400 | -98,95 | 188 | -99,06 | |||
| 2026-02-13 | 13F | Mariner, LLC | 28.972 | 9,77 | 1.011 | -1,08 | ||||
| 2026-02-13 | 13F | Citigroup Inc | 254.537 | 410,48 | 8.883 | 360,50 | ||||
| 2026-02-12 | 13F | Advisors Asset Management, Inc. | 3.666 | 46,29 | 128 | 32,29 | ||||
| 2026-02-17 | 13F | Susquehanna International Group, Llp | Put | 506.700 | -34,20 | 17.684 | -40,67 | |||
| 2026-02-17 | 13F | Susquehanna International Group, Llp | Call | 235.000 | -74,08 | 8.202 | -76,63 | |||
| 2026-02-12 | 13F | Bank Of Montreal /can/ | 5.806 | 203 | ||||||
| 2026-02-17 | 13F | Susquehanna International Group, Llp | 214.649 | -49,01 | 7.491 | -54,02 | ||||
| 2025-11-07 | 13F | Credit Industriel Et Commercial | Put | 0 | -100,00 | 0 | ||||
| 2025-11-14 | 13F | Sig Brokerage, Lp | Call | 0 | -100,00 | 0 | -100,00 | |||
| 2026-02-17 | 13F | Shay Capital LLC | 0 | -100,00 | 0 | |||||
| 2026-02-17 | 13F | Canada Pension Plan Investment Board | 7.004.083 | 0,00 | 244.442 | -9,82 | ||||
| 2026-02-12 | 13F | Senvest Management, LLC | 502.655 | 17.543 | ||||||
| 2026-01-23 | 13F | Galvin, Gaustad & Stein, LLC | 21.354 | 207,21 | 745 | 176,95 | ||||
| 2025-11-14 | 13F | Capula Management Ltd | 0 | -100,00 | 0 | |||||
| 2026-01-14 | 13F | Amiral Gestion | 0 | -100,00 | 0 | |||||
| 2026-02-11 | 13F | J.w. Cole Advisors, Inc. | 0 | -100,00 | 0 | |||||
| 2026-02-12 | 13F | APG Asset Management N.V. | 421.577 | 0,00 | 12.528 | -9,78 | ||||
| 2026-02-17 | 13F | Moore Capital Management, Lp | 0 | -100,00 | 0 | |||||
| 2026-02-17 | 13F | Citadel Advisors Llc | Put | 75.400 | -70,66 | 2.631 | -73,54 | |||
| 2026-02-12 | 13F | Principal Securities, Inc. | 0 | -100,00 | 0 | -100,00 | ||||
| 2026-02-17 | 13F | Citadel Advisors Llc | 60.674 | -88,32 | 2.118 | -89,47 | ||||
| 2026-02-17 | 13F | Citadel Advisors Llc | Call | 248.600 | -55,30 | 8.676 | -59,69 | |||
| 2026-02-11 | 13F | Group One Trading, L.p. | Call | 293.900 | -48,46 | 10.257 | -53,52 | |||
| 2026-02-14 | 13F | Taikang Asset Management (Hong Kong) Co Ltd | 200.000 | 33,33 | 6.980 | 20,24 | ||||
| 2026-02-05 | 13F | Bessemer Group Inc | 6 | 0,00 | 0 | |||||
| 2026-02-13 | 13F | Macquarie Group Ltd | 755 | 0,00 | 26 | -10,34 | ||||
| 2026-02-13 | 13F | Baupost Group Llc/ma | 3.044.818 | -6,31 | 106 | -15,20 | ||||
| 2026-02-12 | 13F | BlackRock, Inc. | 675.124 | 22,37 | 23.562 | 10,35 | ||||
| 2025-11-12 | 13F | HAP Trading, LLC | Call | 60.900 | 114 | |||||
| 2026-02-10 | 13F | Future Fund LLC | 71.699 | 13,26 | 2.502 | 2,16 | ||||
| 2026-02-17 | 13F | Prelude Capital Management, Llc | 12.037 | -28,15 | 420 | -35,19 | ||||
| 2025-11-07 | 13F | Credit Industriel Et Commercial | 0 | -100,00 | 0 | |||||
| 2026-02-13 | 13F | Barclays Plc | 1.720.247 | 20.731,28 | 60.037 | 18.720,06 | ||||
| 2025-11-14 | 13F | Cubist Systematic Strategies, LLC | Call | 0 | -100,00 | 0 | -100,00 | |||
| 2026-02-17 | 13F | Burkehill Global Management, LP | 700.000 | 0,00 | 24.430 | -9,82 | ||||
| 2026-02-17 | 13F | Agf Management Ltd | 6.447 | 225 | ||||||
| 2026-02-13 | 13F | Itau Unibanco Holding S.A. | 0 | -100,00 | 0 | |||||
| 2026-02-17 | 13F | Jain Global LLC | 202.193 | 24,85 | 7.057 | 12,59 | ||||
| 2026-02-12 | 13F | Hrt Financial Lp | 0 | -100,00 | 0 | |||||
| 2026-02-17 | 13F | Schonfeld Strategic Advisors LLC | 0 | -100,00 | 0 | |||||
| 2026-02-13 | 13F | Maplelane Capital, Llc | 0 | -100,00 | 0 | |||||
| 2025-11-14 | 13F | Parallax Volatility Advisers, L.P. | Call | 0 | -100,00 | 0 | ||||
| 2026-02-11 | 13F | Simplex Trading, Llc | Put | 58.000 | -80,25 | 2.024 | 18.300,00 | |||
| 2026-02-17 | 13F | Advisor Group Holdings, Inc. | 4.984 | 141,36 | 174 | 124,68 | ||||
| 2026-02-11 | 13F | Simplex Trading, Llc | Call | 99.900 | -46,03 | 3.487 | 49.700,00 | |||
| 2026-02-03 | 13F | SBI Securities Co., Ltd. | 1 | 0,00 | 0 | |||||
| 2026-02-13 | 13F | Maplelane Capital, Llc | Call | 0 | -100,00 | 0 | ||||
| 2026-02-17 | 13F | Wellington Management Group Llp | 0 | -100,00 | 0 | |||||
| 2025-11-14 | 13F | Hood River Capital Management LLC | 0 | -100,00 | 0 | |||||
| 2026-02-12 | 13F | Long Corridor Asset Management Ltd | 17.425 | -79,47 | 608 | -81,49 | ||||
| 2026-04-08 | 13F | Wealth Enhancement Advisory Services, Llc | 6.694 | -38,07 | 267 | -34,40 | ||||
| 2026-02-06 | 13F | Pnc Financial Services Group, Inc. | 3.601 | 27,83 | 126 | 14,68 | ||||
| 2026-02-19 | 13F | Invesco Ltd. | 69.516 | -10,33 | 2.426 | -19,13 | ||||
| 2025-11-14 | 13F | Goldman Sachs Group Inc | Put | 0 | -100,00 | 0 | -100,00 | |||
| 2026-02-17 | 13F | KEYWISE CAPITAL MANAGEMENT (HK) Ltd | 0 | -100,00 | 0 | |||||
| 2026-02-17 | 13F | Philosophy Capital Management LLC | 570.140 | 19.898 | ||||||
| 2026-02-12 | 13F | Loomis Sayles & Co L P | 3.393 | 0,00 | 118 | -9,92 | ||||
| 2026-04-23 | 13F | Broad Peak Investment Advisers Pte Ltd | 445.050 | 17.931 | ||||||
| 2026-02-11 | 13F | Jpmorgan Chase & Co | Call | 0 | -100,00 | 0 | -100,00 | |||
| 2025-11-10 | 13F | Raiffeisen Bank International AG | 0 | -100,00 | 0 | -100,00 | ||||
| 2026-02-09 | 13F | Hantz Financial Services, Inc. | 3.827 | 180,37 | 0 | |||||
| 2026-04-14 | 13F | Wealthcare Advisory Partners LLC | 0 | -100,00 | 0 | |||||
| 2026-02-17 | 13F | Advisor Group Holdings, Inc. | Call | 1 | 2 | |||||
| 2026-02-06 | 13F | Gsa Capital Partners Llp | 0 | -100,00 | 0 | |||||
| 2026-02-12 | 13F | Marex Group plc | Call | 11.000 | -63,33 | 384 | -67,01 | |||
| 2026-02-12 | 13F | Marex Group plc | 7.357 | -64,73 | 257 | -68,28 | ||||
| 2026-01-26 | 13F | Private Trust Co Na | 0 | -100,00 | 0 | -100,00 | ||||
| 2026-02-11 | 13F | Franklin Resources Inc | 442.602 | 15.447 | ||||||
| 2026-04-24 | 13F | UMA Financial Services, Inc. | 53 | 89,29 | 2 | |||||
| 2026-02-13 | 13F | Wells Fargo & Company/mn | Call | 0 | -100,00 | 0 | -100,00 | |||
| 2026-02-12 | 13F | AI-Squared Management Ltd | 166.740 | 69,66 | 5.819 | 53,01 | ||||
| 2026-02-13 | 13F | JustInvest LLC | 15.955 | 3,02 | 557 | -7,18 | ||||
| 2026-02-17 | 13F | SIH Partners, LLLP | 265.200 | 16,26 | 9.255 | 4,85 | ||||
| 2026-02-17 | 13F | Millennium Management Llc | Call | 0 | -100,00 | 0 | ||||
| 2026-02-17 | 13F | Two Sigma Investments, Lp | 0 | -100,00 | 0 | |||||
| 2025-11-14 | 13F | Goldman Sachs Group Inc | Call | 0 | -100,00 | 0 | -100,00 | |||
| 2026-02-13 | 13F | Alyeska Investment Group, L.P. | 1.028.000 | -45,67 | 35.877 | -51,00 | ||||
| 2026-04-21 | 13F | Financial Consulate, Inc | 71 | 787,50 | 3 | |||||
| 2026-02-17 | 13F | Raymond James Financial Inc | 138.379 | 10,96 | 4.829 | 0,06 | ||||
| 2026-04-24 | 13F | Profund Advisors Llc | 6.766 | -1,49 | 273 | 13,81 | ||||
| 2026-02-13 | 13F | Resources Investment Advisors, LLC. | 7.095 | -0,38 | 248 | -10,18 | ||||
| 2026-02-17 | 13F | Tiger Pacific Capital LP | 599.097 | 20.908 | ||||||
| 2026-02-17 | 13F | Two Sigma Securities, Llc | 0 | -100,00 | 0 | |||||
| 2025-11-14 | 13F | Anson Funds Management LP | 0 | -100,00 | 0 | |||||
| 2026-02-13 | 13F | American Century Companies Inc | 1.173.492 | 6,11 | 40.955 | -4,31 | ||||
| 2025-11-14 | 13F | Scientech Research LLC | 0 | -100,00 | 0 | -100,00 | ||||
| 2026-02-11 | 13F | Cerity Partners LLC | 787.502 | -0,00 | 27.484 | -9,82 | ||||
| 2026-02-13 | 13F | Pinnacle Wealth Planning Services, Inc. | 564 | 20 | ||||||
| 2026-02-04 | 13F | Pacer Advisors, Inc. | 0 | -100,00 | 0 | |||||
| 2026-02-11 | 13F | Harvest Fund Management Co., Ltd | 8.362 | -54,46 | 0 | |||||
| 2026-02-12 | 13F | XY Capital Ltd | 0 | -100,00 | 0 | -100,00 | ||||
| 2026-02-17 | 13F | Dark Forest Capital Management Lp | 0 | -100,00 | 0 | -100,00 | ||||
| 2026-02-17 | 13F | Sender Co & Partners, Inc. | Call | 0 | -100,00 | 0 | ||||
| 2025-11-12 | 13F | Group One Trading, L.p. | 0 | -100,00 | 0 | -100,00 | ||||
| 2026-02-17 | 13F | Sender Co & Partners, Inc. | 0 | -100,00 | 0 | |||||
| 2026-02-17 | 13F | OnyxPoint Global Management LP | Call | 42.600 | 1.487 | |||||
| 2026-02-05 | 13F | Central Asset Investments & Management Holdings (HK) Ltd | 0 | -100,00 | 0 | |||||
| 2026-02-17 | 13F | ExodusPoint Capital Management, LP | 0 | -100,00 | 0 | -100,00 | ||||
| 2026-04-21 | 13F | Vise Technologies, Inc. | 13.717 | 0,00 | 479 | 0,00 | ||||
| 2026-01-22 | 13F | BOCHK Asset Management Ltd | 0 | -100,00 | 0 | |||||
| 2025-11-13 | 13F | Norges Bank | 0 | -100,00 | 0 | |||||
| 2026-02-12 | 13F | Quadrant Capital Group Llc | 8.288 | -2,98 | 289 | -12,42 | ||||
| 2026-02-12 | 13F | Skopos Labs, Inc. | 16.112 | 107,47 | 558 | 86,00 | ||||
| 2026-04-22 | 13F | Pictet Asset Management Holding SA | 102.607 | -28,13 | 4.134 | -17,02 | ||||
| 2026-02-13 | 13F | Marshall Wace, Llp | 1.506.344 | 22,75 | 52.571 | 10,69 | ||||
| 2026-02-17 | 13F | Massar Capital Management, LP | 29.000 | -45,87 | 1.012 | -51,18 | ||||
| 2026-02-17 | 13F | Selkirk Management LLC | 287.000 | 0,00 | 10.016 | -9,81 | ||||
| 2026-02-09 | 13F | Geode Capital Management, Llc | 85.211 | -5,75 | 2.974 | -15,01 | ||||
| 2026-04-22 | 13F | Stone House Investment Management, LLC | 62 | 3,33 | 2 | 0,00 | ||||
| 2026-02-14 | 13F | Rockefeller Capital Management L.P. | 360 | 33,83 | 13 | 20,00 | ||||
| 2025-11-13 | 13F | Lord, Abbett & Co. Llc | Call | 0 | -100,00 | 0 | ||||
| 2026-02-13 | 13F | Parkside Financial Bank & Trust | 22 | 0,00 | 1 | |||||
| 2026-02-13 | 13F | Verition Fund Management LLC | 0 | -100,00 | 0 | |||||
| 2026-02-06 | 13F | Larson Financial Group LLC | 544 | 231,71 | 19 | 200,00 | ||||
| 2026-02-13 | 13F | Headlands Technologies LLC | 0 | -100,00 | 0 | |||||
| 2026-01-23 | 13F | Assetmark, Inc | 674 | -1,61 | 24 | -11,54 | ||||
| 2026-02-11 | 13F | LPL Financial LLC | 6.689 | -45,00 | 233 | -50,43 | ||||
| 2025-11-14 | 13F | Voloridge Investment Management, Llc | 0 | -100,00 | 0 | |||||
| 2026-04-10 | 13F | Abound Wealth Management | 0 | -100,00 | 0 | |||||
| 2026-02-03 | 13F | Manning & Napier Advisors Llc | 0 | -100,00 | 0 | -100,00 | ||||
| 2026-02-10 | 13F | State of Wyoming | 20.590 | 15,45 | 719 | 4,06 | ||||
| 2026-02-17 | 13F | Lighthouse Investment Partners, LLC | 104.344 | -31,56 | 3.642 | -38,29 | ||||
| 2026-04-20 | 13F | Ronald Blue Trust, Inc. | 88 | 125,64 | 4 | 200,00 | ||||
| 2026-04-21 | 13F | SmartHarvest Portfolios, LLC | 5.069 | 204 | ||||||
| 2026-02-17 | 13F | Ghisallo Capital Management LLC | 0 | -100,00 | 0 | |||||
| 2025-10-29 | 13F | Massachusetts Financial Services Co /ma/ | 0 | -100,00 | 0 | |||||
| 2025-11-14 | 13F | Centerbridge Partners, L.P. | 0 | -100,00 | 0 | -100,00 | ||||
| 2026-01-29 | 13F | UBS Group AG | Call | 69.000 | 37,45 | 2.408 | 24,00 | |||
| 2026-02-13 | 13F | Centiva Capital, LP | 0 | -100,00 | 0 | |||||
| 2026-04-07 | 13F | Farther Finance Advisors, LLC | 15.113 | 0,90 | 630 | 20,50 | ||||
| 2026-01-14 | 13F | Spire Wealth Management | 0 | -100,00 | 0 | -100,00 | ||||
| 2026-02-17 | 13F | Ardmore Road Asset Management LP | 0 | -100,00 | 0 | |||||
| 2026-02-13 | 13F | Walleye Trading LLC | Call | 185.100 | -4,14 | 6.460 | -13,56 | |||
| 2026-02-13 | 13F | Squarepoint Ops LLC | 0 | -100,00 | 0 | |||||
| 2026-04-24 | 13F | Raiffeisen Bank International AG | Call | 686 | 0,00 | 28 | 42,11 | |||
| 2026-02-13 | 13F | Infini Capital Management Ltd | 0 | -100,00 | 0 | -100,00 | ||||
| 2026-02-13 | 13F | Walleye Trading LLC | Put | 97.600 | 1.135,44 | 3.406 | 1.016,72 | |||
| 2026-02-13 | 13F | Y-Intercept (Hong Kong) Ltd | 0 | -100,00 | 0 | |||||
| 2026-04-15 | 13F | Bayforest Capital Ltd | 56 | -99,52 | 2 | -99,51 | ||||
| 2026-01-30 | 13F | Harbor Advisors LLC | 20.000 | 33,33 | 698 | 20,34 | ||||
| 2026-02-10 | 13F | One Capital Management, LLC | 59.048 | 41,37 | 2.061 | 27,48 | ||||
| 2026-02-13 | 13F | Dymon Asia Capital (singapore) Pte. Ltd. | 0 | -100,00 | 0 | |||||
| 2026-02-13 | 13F | Tekne Capital Management, LLC | 5.051.818 | -20,27 | 176.308 | -28,10 | ||||
| 2026-02-17 | 13F | Polymer Capital Management (US) LLC | 0 | -100,00 | 0 | |||||
| 2026-02-06 | 13F | EverSource Wealth Advisors, LLC | 1.245 | -9,59 | 43 | -18,87 | ||||
| 2026-04-17 | 13F | Bell Investment Advisors, Inc | 207 | -1,43 | 8 | 14,29 | ||||
| 2026-01-29 | 13F | Quent Capital, LLC | 15.000 | 524 | ||||||
| 2026-02-17 | 13F | D. E. Shaw & Co., Inc. | 0 | -100,00 | 0 | |||||
| 2026-04-23 | 13F | Elevate Capital Advisors, LLC | 6.211 | -60,74 | 250 | -54,71 | ||||
| 2026-02-17 | 13F | Jump Financial, LLC | 34.619 | 1.208 | ||||||
| 2026-02-17 | 13F | Hidden Lake Asset Management LP | 87.877 | -57,24 | 3.067 | -61,44 | ||||
| 2025-11-14 | 13F | Caption Management, LLC | 0 | -100,00 | 0 | -100,00 | ||||
| 2026-02-13 | 13F | Sachem Head Capital Management LP | 9.300.000 | 44,97 | 324.570 | 30,74 | ||||
| 2025-11-14 | 13F | Wetherby Asset Management Inc | 15.787 | 4,20 | 611 | 31,75 | ||||
| 2026-02-12 | 13F | Northwest & Ethical Investments L.P. | 0 | -100,00 | 0 | |||||
| 2025-11-14 | 13F | Point72 Hong Kong Ltd | 518.463 | 20.065 | ||||||
| 2026-02-17 | 13F | Royal Bank Of Canada | 277.763 | 0,99 | 9.694 | -8,93 | ||||
| 2026-02-17 | 13F | Fmr Llc | 47 | -99,99 | 2 | -99,99 | ||||
| 2026-02-17 | 13F | Persistent Asset Partners Ltd | 13.271 | 463 | ||||||
| 2026-02-12 | 13F | Barometer Capital Management Inc. | 0 | -100,00 | 0 | |||||
| 2026-02-17 | 13F | 12 West Capital Management LP | 4.283.776 | -5,27 | 149.504 | -14,57 | ||||
| 2026-02-04 | 13F | Ground Swell Capital, LLC | 0 | -100,00 | 0 | |||||
| 2026-02-17 | 13F | Portolan Capital Management, LLC | 15.359 | 9,21 | 536 | -1,47 | ||||
| 2026-02-18 | 13F | Vident Advisory, LLC | 12.673 | -20,49 | 442 | -28,25 | ||||
| 2026-02-17 | 13F | Susquehanna Advisors Group, Inc. | 31.427 | -7,09 | 1.097 | -16,27 | ||||
| 2025-11-14 | 13F | Brookfield Asset Management Inc. | 0 | -100,00 | 0 | |||||
| 2026-02-05 | 13F | Macroview Investment Management Llc | 12.460 | 0,00 | 435 | -9,96 | ||||
| 2026-02-17 | 13F | Light Street Capital Management, Llc | 65.272 | -73,31 | 2.278 | -75,94 | ||||
| 2026-02-03 | 13F | Maxi Investments CY Ltd | 172.700 | 6 | ||||||
| 2026-02-13 | 13F | Van Eck Associates Corp | 1.692 | 245,31 | 0 | |||||
| 2026-02-17 | 13F | Two Sigma Advisers, Lp | 11.900 | 58,67 | 415 | 43,10 | ||||
| 2025-11-14 | 13F | Walleye Trading LLC | 0 | -100,00 | 0 | -100,00 | ||||
| 2026-04-24 | 13F | Root Financial Partners, LLC | 1 | 0,00 | 0 | |||||
| 2026-02-10 | 13F | Goldman Sachs Group Inc | 403.419 | -56,25 | 14.079 | -60,55 | ||||
| 2026-02-13 | 13F | Eschler Asset Management LLP | 16.300 | -96,61 | 569 | -96,95 | ||||
| 2026-02-13 | 13F | Pinpoint Asset Management (Singapore) Pte. Ltd. | 109.321 | 4,94 | 3.815 | -5,36 | ||||
| 2026-02-13 | 13F | Morgan Stanley | 1.148.494 | -0,22 | 40.082 | -10,02 | ||||
| 2026-02-06 | 13F | Pinnbrook Capital Management Lp | 0 | -100,00 | 0 | |||||
| 2026-01-29 | 13F | UBS Group AG | 1.553.401 | 6,80 | 54.214 | -3,69 | ||||
| 2025-11-14 | 13F | Lazard Asset Management Llc | 0 | -100,00 | 0 | |||||
| 2025-11-14 | 13F | National Bank Of Canada /fi/ | Put | 0 | -100,00 | 0 | -100,00 | |||
| 2026-01-30 | 13F | Us Bancorp \de\ | 6.022 | -3,94 | 210 | -13,22 | ||||
| 2026-02-12 | 13F | DRW Securities, LLC | 0 | -100,00 | 0 | |||||
| 2026-02-17 | 13F | Tudor Investment Corp Et Al | Put | 20.300 | 103,00 | 708 | 82,95 | |||
| 2026-02-17 | 13F | Tudor Investment Corp Et Al | Call | 8.500 | -79,52 | 297 | -81,57 | |||
| 2026-01-26 | 13F | Mirae Asset Global Investments Co., Ltd. | 37.074 | -14,29 | 1.294 | -22,76 | ||||
| 2026-02-13 | 13F | BNP Paribas Asset Management Holding S.A. | 691.698 | -3,83 | 24 | -14,29 | ||||
| 2026-02-17 | 13F | Tudor Investment Corp Et Al | 7.799 | 272 | ||||||
| 2026-02-17 | 13F | Bank Of America Corp /de/ | 1.734.887 | 227,62 | 60.548 | 195,45 | ||||
| 2026-02-06 | 13F | Carrhae Capital LLP | 2.167.199 | 31,48 | 75.635 | 18,57 | ||||
| 2026-02-17 | 13F | Monolith Management Ltd | 0 | -100,00 | 0 | |||||
| 2026-02-18 | 13F | GWM Advisors LLC | 1.000 | 0,00 | 35 | -10,53 | ||||
| 2026-02-17 | 13F | LMR Partners LLP | Put | 196.700 | 0,00 | 6.865 | -9,83 | |||
| 2026-02-17 | 13F | LMR Partners LLP | 323.965 | -12,30 | 11.306 | -20,91 | ||||
| 2026-02-11 | 13F | Fiera Capital Corp | 71.052 | 2.480 | ||||||
| 2025-11-03 | 13F | Summit Global Investments | 0 | -100,00 | 0 | |||||
| 2026-02-11 | 13F | O'shaughnessy Asset Management, Llc | 5.824 | 11,00 | 203 | 0,00 | ||||
| 2026-02-11 | 13F | Jpmorgan Chase & Co | 669.548 | -40,03 | 23.367 | -45,92 | ||||
| 2026-02-17 | 13F | Tower Research Capital LLC (TRC) | 32 | -98,35 | 1 | -98,65 | ||||
| 2026-01-26 | 13F | Cwm, Llc | 309 | 68,85 | 0 | |||||
| 2026-01-07 | 13F | Harbour Capital Advisors, LLC | 6.000 | -13,36 | 230 | -11,20 | ||||
| 2026-02-12 | 13F | Federation des caisses Desjardins du Quebec | 1.000 | 0,00 | 35 | -10,53 | ||||
| 2026-02-12 | 13F | Nuveen, LLC | 377.800 | -1,72 | 13.185 | -11,37 | ||||
| 2026-04-21 | 13F | Pinnacle Associates Ltd | 253.022 | -0,14 | 10.194 | 15,28 | ||||
| 2026-04-16 | 13F | SG Americas Securities, LLC | 3.268 | 0 | ||||||
| 2026-02-11 | 13F | Fox Run Management, L.l.c. | 0 | -100,00 | 0 | |||||
| 2026-02-10 | 13F | Singapore Technologies Telemedia Pte Ltd | 9.835.680 | 0,00 | 343.265 | -9,82 | ||||
| 2026-02-12 | 13F | Dimensional Fund Advisors Lp | 197.209 | 6,16 | 6.882 | -4,28 | ||||
| 2026-02-17 | 13F | Trexquant Investment LP | 106.406 | 162,12 | 3.714 | 136,50 | ||||
| 2026-02-13 | 13F | Tairen Capital Ltd | 0 | -100,00 | 0 | |||||
| 2026-04-27 | 13F | Leonteq Securities AG | 645 | -32,95 | 26 | -24,24 | ||||
| 2026-02-12 | 13F | CIBC Private Wealth Group, LLC | 375 | -35,57 | 13 | -40,91 | ||||
| 2026-02-13 | 13F | National Bank Of Canada /fi/ | 0 | -100,00 | 0 | -100,00 | ||||
| 2026-04-06 | 13F | Versant Capital Management, Inc | 16 | 1 | ||||||
| 2026-02-13 | 13F | MAI Capital Management | 23 | 0,00 | 1 | |||||
| 2025-11-14 | 13F | Concentric Capital Strategies, LP | 0 | -100,00 | 0 | |||||
| 2026-02-10 | 13F | Nomura Asset Management Co Ltd | 0 | 0 | ||||||
| 2026-02-12 | 13F | Glaxis Capital Management, LLC | 0 | -100,00 | 0 | |||||
| 2026-02-13 | 13F | Polymer Capital Management (HK) LTD | 7.684 | -35,97 | 268 | -42,24 | ||||
| 2026-02-17 | 13F | Beaconlight Capital, Llc | 136.043 | -15,93 | 4.748 | -24,19 | ||||
| 2026-02-17 | 13F | Point72 Asset Management, L.P. | 1.203.879 | 658,83 | 42.015 | 584,39 | ||||
| 2026-02-17 | 13F | Point72 Asset Management, L.P. | Put | 57.900 | 2.021 | |||||
| 2026-02-17 | 13F | Bamco Inc /ny/ | 3.784.848 | -11,13 | 132.091 | -19,85 | ||||
| 2026-02-17 | 13F | Quantinno Capital Management LP | 14.379 | 18,50 | 502 | 6,82 | ||||
| 2026-02-17 | 13F | Point72 Asset Management, L.P. | Call | 26.100 | 911 | |||||
| 2026-02-17 | 13F | Fred Alger Management, Llc | 322.589 | 6,66 | 11.258 | -3,81 | ||||
| 2026-02-13 | 13F | Smartleaf Asset Management LLC | 653 | 23 | ||||||
| 2026-02-13 | 13F | Wells Fargo & Company/mn | 30.615 | 12,90 | 1.068 | 1,81 | ||||
| 2026-02-17 | 13F | Elequin Capital Lp | 405 | 14 | ||||||
| 2026-02-17 | 13F | Aqr Capital Management Llc | 8.903 | 311 | ||||||
| 2026-01-29 | 13F | Rakuten Securities, Inc. | 0 | -100,00 | 0 | |||||
| 2025-11-14 | 13F | Cubist Systematic Strategies, LLC | Put | 5.900 | 228 | |||||
| 2026-02-04 | 13F | Abc Arbitrage Sa | 0 | -100,00 | 0 | |||||
| 2026-02-17 | 13F | Qube Research & Technologies Ltd | 0 | -100,00 | 0 | |||||
| 2026-02-17 | 13F | XTX Topco Ltd | 5.864 | -22,93 | 205 | -30,61 | ||||
| 2026-02-13 | 13F | Squarepoint Ops LLC | Call | 0 | -100,00 | 0 | ||||
| 2026-02-17 | 13F | Waterfront Capital Partners, LLC | 0 | -100,00 | 0 | -100,00 | ||||
| 2026-02-11 | 13F | Deutsche Bank Ag\ | 215.110 | 16,23 | 7.507 | 4,82 | ||||
| 2026-03-10 | 13F | MY.Alpha Management HK Advisors Ltd | 454.171 | -13,77 | 15.851 | -22,24 | ||||
| 2026-02-13 | 13F | Walleye Capital LLC | 150.534 | -40,55 | 5.254 | -46,39 | ||||
| 2026-02-13 | 13F | Walleye Capital LLC | Call | 30.200 | 1.054 | |||||
| 2025-11-14 | 13F | Boothbay Fund Management, Llc | 0 | -100,00 | 0 | |||||
| 2026-01-29 | 13F | IMC-Chicago, LLC | Call | 102.100 | -67,29 | 3.563 | -70,50 | |||
| 2026-04-07 | 13F | Signaturefd, Llc | 6.070 | -3,57 | 245 | 11,42 | ||||
| 2026-02-17 | 13F | Millennium Management Llc | 625.007 | 28,81 | 21.813 | 16,16 | ||||
| 2026-02-13 | 13F | Walleye Capital LLC | Put | 42.000 | 1.466 | |||||
| 2026-02-17 | 13F | Saba Capital Management, L.P. | 160.000 | 0,00 | 5.584 | -9,82 | ||||
| 2026-02-17 | 13F | Northern Trust Corp | 25.328 | 13,64 | 884 | 2,44 | ||||
| 2026-03-03 | 13F/A | Caitong International Asset Management Co., Ltd | 1.884 | 5,31 | 66 | -5,80 | ||||
| 2026-01-16 | 13F | Standard Life Aberdeen plc | 576.498 | 27,54 | 20.120 | 12,47 | ||||
| 2026-02-17 | 13F | Discovery Capital Management, Llc / Ct | 1.428.017 | 35,20 | 49.838 | 21,93 | ||||
| 2026-02-17 | 13F | MIRAE ASSET GLOBAL ETFS HOLDINGS Ltd. | 878.448 | 49,77 | 30.658 | 35,06 | ||||
| 2026-02-05 | 13F | Allworth Financial LP | 100 | 11,11 | 3 | 0,00 | ||||
| 2026-02-13 | 13F | Alberta Investment Management Corp | 0 | -100,00 | 0 | |||||
| 2026-02-17 | 13F | Ameriprise Financial Inc | 29.117 | -91,83 | 1.016 | -92,63 | ||||
| 2026-02-12 | 13F | Jane Street Group, Llc | Put | 357.400 | -59,45 | 12.473 | -63,43 | |||
| 2026-02-09 | 13F | Jefferies Financial Group Inc. | Put | 30.000 | 1.047 | |||||
| 2026-02-10 | 13F | Bnp Paribas Arbitrage, Sa | 307.830 | 5,70 | 10.743 | -4,68 | ||||
| 2026-02-09 | 13F | Jefferies Financial Group Inc. | 7.000 | 244 | ||||||
| 2026-02-17 | 13F | Electron Capital Partners, LLC | 105.448 | 52,20 | 3.680 | 37,26 | ||||
| 2026-02-13 | 13F | Rhumbline Advisers | 191 | 172,86 | 7 | 200,00 | ||||
| 2026-01-29 | 13F | IMC-Chicago, LLC | 55.332 | 1.931 | ||||||
| 2026-01-29 | 13F | IMC-Chicago, LLC | Put | 140.300 | 10,21 | 4.896 | -0,61 | |||
| 2026-02-17 | 13F | Creative Planning | 53.330 | 74,78 | 1.861 | 57,71 | ||||
| 2026-02-17 | 13F | Balyasny Asset Management Llc | 270.069 | -7,21 | 9.425 | -16,32 | ||||
| 2025-11-07 | 13F | State of New Jersey Common Pension Fund D | 0 | -100,00 | 0 | -100,00 | ||||
| 2026-01-16 | 13F | FNY Investment Advisers, LLC | 0 | -100,00 | 0 | |||||
| 2026-02-14 | 13F | Triata Capital Ltd | 2.974.298 | 23,52 | 103.803 | 11,39 | ||||
| 2026-02-17 | 13F | BlueCrest Capital Management Ltd | 31.535 | 308,27 | 1.101 | 269,13 | ||||
| 2026-01-16 | 13F | FNY Investment Advisers, LLC | Call | 0 | -100,00 | 0 | ||||
| 2026-02-13 | 13F | Hel Ved Capital Management Ltd | 0 | -100,00 | 0 | -100,00 | ||||
| 2026-02-17 | 13F | Driehaus Capital Management Llc | 51.576 | 0,00 | 1.800 | -9,77 |