Grundlæggende statistik
| Institutionelle ejere | 168 total, 139 long only, 2 short only, 27 long/short - change of 13,13% MRQ |
| Gennemsnitlig porteføljeallokering | 0.6461 % - change of -31,40% MRQ |
| Institutionelle aktier (lange) | 31.186.902 (ex 13D/G) - change of 3,05MM shares 2,18% MRQ |
| Institutionel værdi (lang) | $ 756.426 USD ($1000) |
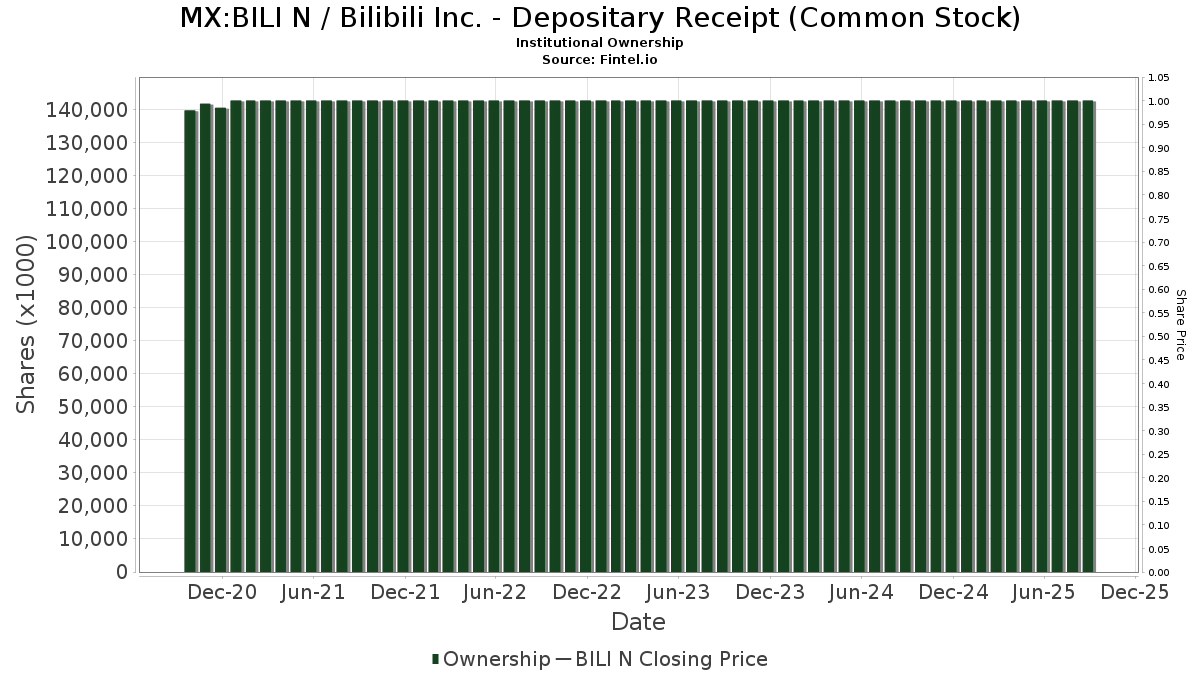
Institutionelt ejerskab og aktionærer
Bilibili Inc. - Depositary Receipt (Common Stock) (MX:BILI N) har 168 institutionelle ejere og aktionærer, der har indsendt 13D/G- eller 13F-formularer til Securities Exchange Commission (SEC). Disse institutioner har i alt 31,186,902 aktier. Største aktionærer omfatter UBS Group AG, Morgan Stanley, Susquehanna International Group, Llp, Jane Street Group, Llc, Susquehanna International Group, Llp, Susquehanna International Group, Llp, LMR Partners LLP, Yiheng Capital Management, L.P., BlackRock, Inc., and KEYWISE CAPITAL MANAGEMENT (HK) Ltd .
Bilibili Inc. - Depositary Receipt (Common Stock) (BMV:BILI N) institutionel ejerskabsstruktur viser aktuelle positioner i virksomheden efter institutioner og fonde, samt seneste ændringer i positionsstørrelse. Større aktionærer kan omfatte individuelle investorer, investeringsforeninger, hedgefonde eller institutioner. Skema 13D angiver, at investoren besidder (eller besidder) mere end 5 % af virksomheden og har til hensigt (eller har til hensigt at) aktivt at forfølge en ændring i forretningsstrategi. Skema 13G indikerer en passiv investering på over 5%.
Fondens stemningsscore
Fund Sentiment Score (fka Ownership Accumulation Score) finder de aktier, der bliver mest købt af fonde. Det er resultatet af en sofistikeret, multi-faktor kvantitativ model, der identificerer virksomheder med de højeste niveauer af institutionel akkumulering. Scoringsmodellen bruger en kombination af den samlede stigning i oplyste ejere, ændringerne i porteføljeallokeringer i disse ejere og andre målinger. Tallet går fra 0 til 100, hvor højere tal indikerer et højere niveau af akkumulering for sine jævnaldrende, og 50 er gennemsnittet.
Opdateringsfrekvens: Dagligt
Se Ownership Explorer, som giver en liste over højest rangerende virksomheder.
AI+ Ask Fintel’s AI assistant about Bilibili Inc. - Depositary Receipt (Common Stock).
Select a question to share a public post with an AI-crafted answer.
Thinking of good questions…
13F og NPORT arkivering
Detaljer om 13F-arkivering er gratis. Detaljer om NP-ansøgninger kræver et premium-medlemskab. Grønne rækker angiver nye positioner. Røde rækker angiver lukkede positioner. Klik på linket ikon for at se den fulde transaktionshistorik.
Opgrader
for at låse premium-data op og eksportere til Excel ![]() .
.
| Fil dato | Kilde | Investor | Type | Gennemsnitlig pris (Øst) |
Aktier | Δ Aktier (%) |
Rapporteret Værdi ($1000) |
Δ Værdi (%) |
Port Alloc (%) |
|
|---|---|---|---|---|---|---|---|---|---|---|
| 2026-02-03 | 13F | SBI Securities Co., Ltd. | 16.277 | 0,56 | 400 | -11,89 | ||||
| 2026-02-13 | 13F | MAI Capital Management | 63 | 0,00 | 2 | 0,00 | ||||
| 2026-04-22 | 13F | Stone House Investment Management, LLC | 8 | 0,00 | 0 | |||||
| 2026-02-17 | 13F | Raymond James Financial Inc | 9.105 | 224 | ||||||
| 2026-04-20 | 13F | Ronald Blue Trust, Inc. | 303 | 31,74 | 7 | 20,00 | ||||
| 2026-02-17 | 13F | Man Group plc | 40.941 | -96,40 | 1.007 | -96,85 | ||||
| 2026-02-02 | 13F | Advisors Preferred, LLC | 0 | -100,00 | 0 | -100,00 | ||||
| 2026-02-06 | 13F | Leonteq Securities AG | 16.149 | 230,58 | 397 | 189,78 | ||||
| 2026-04-21 | 13F | Financial Consulate, Inc | 231 | 600,00 | 5 | |||||
| 2026-02-17 | 13F | Yiheng Capital Management, L.P. | 1.148.898 | -19,01 | 28.251 | -29,10 | ||||
| 2025-11-12 | 13F | Quantbot Technologies LP | 0 | -100,00 | 0 | -100,00 | ||||
| 2026-02-11 | 13F | O'shaughnessy Asset Management, Llc | 24.770 | 30,16 | 609 | 14,04 | ||||
| 2026-01-22 | 13F | BOCHK Asset Management Ltd | 35.000 | -3,05 | 861 | -15,19 | ||||
| 2026-02-13 | 13F | Kestra Advisory Services, LLC | 1.736 | 43 | ||||||
| 2026-03-30 | 13F/A | Barclays Plc | Call | 0 | -100,00 | 0 | -100,00 | |||
| 2026-02-13 | 13F | Vontobel Holding Ltd. | 26.126 | 642 | ||||||
| 2026-02-03 | 13F | Ethic Inc. | 49.159 | 12,52 | 1.209 | -1,55 | ||||
| 2026-04-21 | 13F | Venturi Wealth Management, LLC | 0 | -100,00 | 0 | |||||
| 2026-01-23 | 13F | Bridgewater Advisors Inc. | 7.099 | 227 | ||||||
| 2025-11-06 | 13F | Arista Wealth Management, LLC | 0 | -100,00 | 0 | |||||
| 2026-02-13 | 13F | Schroder Investment Management Group | 449.387 | 9,55 | 11.032 | -1,60 | ||||
| 2026-02-13 | 13F | Toroso Investments, LLC | 0 | -100,00 | 0 | |||||
| 2026-02-13 | 13F | Rhumbline Advisers | 2.107 | -10,03 | 52 | -21,54 | ||||
| 2025-11-14 | 13F | Two Sigma Investments, Lp | 0 | -100,00 | 0 | -100,00 | ||||
| 2026-01-21 | 13F | Flagship Harbor Advisors, Llc | 29 | 1 | ||||||
| 2026-02-17 | 13F | Edmond De Rothschild Holding S.a. | 242.000 | 6,28 | 5.951 | -6,97 | ||||
| 2026-01-21 | 13F | Greenleaf Trust | 10.253 | 3,06 | 252 | -9,68 | ||||
| 2026-02-13 | 13F | BNP Paribas Asset Management Holding S.A. | 248.894 | 8 | ||||||
| 2026-02-13 | 13F | Ieq Capital, Llc | 13.829 | 4,09 | 340 | -8,85 | ||||
| 2025-11-14 | 13F | Centiva Capital, LP | 0 | -100,00 | 0 | -100,00 | ||||
| 2026-04-21 | 13F | Vise Technologies, Inc. | 44.913 | 0,00 | 1.104 | 0,00 | ||||
| 2026-01-16 | 13F | FNY Investment Advisers, LLC | 0 | -100,00 | 0 | -100,00 | ||||
| 2026-04-06 | 13F | Highline Wealth Partners Llc | 0 | -100,00 | 0 | |||||
| 2026-02-17 | 13F | Susquehanna International Group, Llp | Put | 1.668.100 | -0,20 | 41.019 | -12,64 | |||
| 2026-02-17 | 13F | Susquehanna International Group, Llp | Call | 3.356.000 | 31,01 | 82.524 | 14,68 | |||
| 2026-02-17 | 13F | Susquehanna International Group, Llp | 1.897.902 | -51,15 | 46.669 | -57,24 | ||||
| 2026-02-12 | 13F | Hrt Financial Lp | 40.700 | -71,46 | 1 | -75,00 | ||||
| 2026-02-17 | 13F | Jain Global LLC | 0 | -100,00 | 0 | -100,00 | ||||
| 2025-11-14 | 13F/A | DLD Asset Management, LP | Put | 0 | -100,00 | 0 | -100,00 | |||
| 2025-11-13 | 13F | Bnp Paribas Arbitrage, Sa | Put | 0 | -100,00 | 0 | -100,00 | |||
| 2025-11-14 | 13F | Scientech Research LLC | 0 | -100,00 | 0 | -100,00 | ||||
| 2026-02-17 | 13F | Caption Management, LLC | Call | 0 | -100,00 | 0 | ||||
| 2026-02-17 | 13F | Lazard Asset Management Llc | 22.527 | -8,06 | 554 | -19,62 | ||||
| 2026-02-12 | 13F | Skopos Labs, Inc. | 8.515 | 210 | ||||||
| 2026-02-13 | 13F | Sculptor Capital LP | Put | 962.800 | 0,00 | 23.675 | -12,46 | |||
| 2026-03-06 | 13F | Hsbc Holdings Plc | 60.229 | 535,66 | 1.483 | 457,52 | ||||
| 2026-02-13 | 13F | Walleye Capital LLC | 84.204 | 2.071 | ||||||
| 2026-02-13 | 13F | Walleye Capital LLC | Put | 105.800 | 2.602 | |||||
| 2026-02-17 | 13F | KEYWISE CAPITAL MANAGEMENT (HK) Ltd | 126.080 | 93,97 | 3.100 | 69,86 | ||||
| 2026-02-27 | 13F/A | Barclays Plc | Put | 0 | -100,00 | 0 | -100,00 | |||
| 2026-02-17 | 13F | KEYWISE CAPITAL MANAGEMENT (HK) Ltd | Call | 1.054.000 | 24,88 | 25.918 | 9,32 | |||
| 2026-02-17 | 13F | Cetera Investment Advisers | Call | 0 | -100,00 | 0 | ||||
| 2026-02-06 | 13F | Pnc Financial Services Group, Inc. | 10.068 | -0,48 | 248 | -13,03 | ||||
| 2026-02-17 | 13F | Cetera Investment Advisers | 0 | -100,00 | 0 | |||||
| 2026-02-12 | 13F | Quadrant Capital Group Llc | 9.175 | 0,16 | 226 | -12,45 | ||||
| 2026-02-12 | 13F | Federation des caisses Desjardins du Quebec | 10 | 0,00 | 0 | |||||
| 2026-01-26 | 13F | Cwm, Llc | 2.179 | 1,35 | 0 | |||||
| 2026-02-17 | 13F | Citadel Advisors Llc | Put | 830.600 | -9,27 | 20.424 | -20,58 | |||
| 2026-03-09 | 13F/A | CI Private Wealth, LLC | 10.913 | 2,59 | 268 | -10,07 | ||||
| 2026-02-17 | 13F | Citadel Advisors Llc | 530.415 | -22,29 | 13.043 | -31,98 | ||||
| 2026-02-17 | 13F | Engineers Gate Manager LP | 23.266 | 59,60 | 572 | 39,85 | ||||
| 2026-02-17 | 13F | XTX Topco Ltd | 31.170 | 766 | ||||||
| 2026-02-10 | 13F | Acadian Asset Management Llc | 3.572 | 0,00 | 0 | |||||
| 2026-02-17 | 13F | Citadel Advisors Llc | Call | 695.600 | -18,52 | 17.105 | -28,67 | |||
| 2026-01-23 | 13F | Assetmark, Inc | 318 | 48,60 | 8 | 16,67 | ||||
| 2026-04-24 | 13F | UMA Financial Services, Inc. | 100 | 0,00 | 2 | 0,00 | ||||
| 2025-11-14 | 13F | Boothbay Fund Management, Llc | 0 | -100,00 | 0 | -100,00 | ||||
| 2026-01-30 | 13F | Mizuho Securities Co. Ltd. | 74.206 | 0,00 | 1.825 | -12,48 | ||||
| 2026-02-05 | 13F | LGT Fund Management Co Ltd. | 202.100 | 8,83 | 4.962 | -6,18 | ||||
| 2026-02-12 | 13F | Renaissance Technologies Llc | 229.435 | 5.642 | ||||||
| 2025-11-14 | 13F | Public Employees Retirement System Of Ohio | 0 | -100,00 | 0 | -100,00 | ||||
| 2026-02-17 | 13F | Creative Planning | 20.787 | 8,98 | 511 | -4,49 | ||||
| 2026-02-17 | 13F | Fmr Llc | 11.008 | -98,91 | 271 | -99,05 | ||||
| 2026-01-28 | 13F | Quaker Wealth Management, LLC | 0 | -100,00 | 0 | |||||
| 2026-01-21 | 13F | Step Capital Management Pte. Ltd. | 1.000.000 | 24.590 | ||||||
| 2026-02-06 | 13F | Prescott Group Capital Management, L.l.c. | 150.000 | 0,00 | 3.688 | -12,46 | ||||
| 2026-02-17 | 13F | Bank Of America Corp /de/ | 504.309 | 2,48 | 12.401 | -10,29 | ||||
| 2026-02-17 | 13F | Clear Street Markets Llc | 0 | -100,00 | 0 | |||||
| 2026-02-17 | 13F | Parallax Volatility Advisers, L.P. | Put | 125.100 | 0,00 | 3.076 | -12,46 | |||
| 2026-02-17 | 13F | Parallax Volatility Advisers, L.P. | Call | 4.500 | -98,45 | 111 | -98,66 | |||
| 2026-02-17 | 13F | Parallax Volatility Advisers, L.P. | 18.844 | 463 | ||||||
| 2026-02-13 | 13F | Parkside Financial Bank & Trust | 61 | 0,00 | 2 | 0,00 | ||||
| 2026-02-17 | 13F | Quantinno Capital Management LP | 139.166 | 63,13 | 3.422 | 42,82 | ||||
| 2026-02-10 | 13F/A | Northwestern Mutual Wealth Management Co | 801 | 7,66 | 20 | -5,00 | ||||
| 2026-02-13 | 13F | JustInvest LLC | 38.712 | 8,41 | 952 | -5,18 | ||||
| 2026-02-17 | 13F | Tower Research Capital LLC (TRC) | 1.239 | -95,31 | 30 | -95,95 | ||||
| 2026-02-12 | 13F | Dimensional Fund Advisors Lp | 159.421 | 18,55 | 3.920 | 3,79 | ||||
| 2026-02-11 | 13F | LPL Financial LLC | 0 | -100,00 | 0 | |||||
| 2025-11-14 | 13F | Wolverine Trading, Llc | 30.743 | 840 | ||||||
| 2025-11-14 | 13F | Wolverine Trading, Llc | Call | 239.600 | 6.548 | |||||
| 2026-04-07 | 13F | Farther Finance Advisors, LLC | 1.112 | 42,20 | 25 | 31,58 | ||||
| 2025-11-13 | 13F | Pinpoint Asset Management (Singapore) Pte. Ltd. | 0 | -100,00 | 0 | |||||
| 2025-11-14 | 13F | Wolverine Trading, Llc | Put | 120.100 | 3.282 | |||||
| 2026-04-20 | 13F | Jfs Wealth Advisors, Llc | 79 | 0,00 | 2 | 0,00 | ||||
| 2026-02-10 | 13F | AdvisorShares Investments LLC | 14.018 | 3,26 | 345 | -9,71 | ||||
| 2026-02-17 | 13F | Dv Equities, Llc | 76.504 | 1.881 | ||||||
| 2025-11-12 | 13F | NewSquare Capital LLC | 0 | -100,00 | 0 | |||||
| 2025-11-13 | 13F | Total Investment Management Inc | 0 | -100,00 | 0 | -100,00 | ||||
| 2026-02-12 | 13F | Principal Securities, Inc. | 0 | -100,00 | 0 | |||||
| 2026-02-17 | 13F | Russell Investments Group, Ltd. | 87.038 | -49,82 | 2.140 | -56,08 | ||||
| 2025-11-12 | 13F | Integrated Quantitative Investments LLC | 0 | -100,00 | 0 | -100,00 | ||||
| 2026-02-11 | 13F | Simplex Trading, Llc | Put | 522.900 | -12,66 | 12.858 | 80.262,50 | |||
| 2026-02-12 | 13F | Jane Street Group, Llc | 1.011.292 | -39,05 | 24.868 | -46,64 | ||||
| 2026-02-06 | 13F | HighTower Advisors, LLC | 0 | -100,00 | 0 | |||||
| 2026-02-11 | 13F | Simplex Trading, Llc | 404.527 | -0,99 | 9.947 | 90.327,27 | ||||
| 2026-02-12 | 13F | Jane Street Group, Llc | Put | 622.300 | -18,41 | 15.302 | -28,58 | |||
| 2026-02-12 | 13F | Jane Street Group, Llc | Call | 2.049.500 | 28,84 | 50.397 | 12,79 | |||
| 2026-02-17 | 13F | Two Sigma Securities, Llc | 0 | -100,00 | 0 | |||||
| 2026-02-17 | 13F | SIH Partners, LLLP | 1.021.800 | 327,07 | 25.126 | 273,90 | ||||
| 2026-02-11 | 13F | Simplex Trading, Llc | Call | 361.400 | -50,94 | 8.887 | 44.330,00 | |||
| 2026-01-08 | 13F | Chesapeake Asset Management Llc | 9 | 0,00 | 0 | |||||
| 2026-02-09 | 13F | Hantz Financial Services, Inc. | 5.886 | 61,75 | 0 | |||||
| 2026-02-12 | 13F | CIBC Private Wealth Group, LLC | 191 | 0,00 | 5 | -20,00 | ||||
| 2026-02-17 | 13F | Qube Research & Technologies Ltd | Put | 12.000 | 16,50 | 295 | 2,08 | |||
| 2026-04-09 | 13F | DHJJ Financial Advisors, Ltd. | 6 | 0,00 | 0 | |||||
| 2026-04-13 | 13F | True Wealth Design, LLC | 137 | 4,58 | 3 | 0,00 | ||||
| 2026-02-17 | 13F | Qube Research & Technologies Ltd | Call | 1.300 | -60,61 | 32 | -66,30 | |||
| 2026-02-05 | 13F | Allworth Financial LP | 389 | 36,97 | 10 | 28,57 | ||||
| 2026-02-17 | 13F | Qube Research & Technologies Ltd | 639.751 | 15,53 | 15.731 | 1,14 | ||||
| 2026-02-18 | 13F | Vident Advisory, LLC | 20.861 | -4,47 | 513 | -16,48 | ||||
| 2026-02-13 | 13F | Panagora Asset Management Inc | 869.388 | 137,98 | 21.378 | 108,34 | ||||
| 2026-02-11 | 13F | Group One Trading, L.p. | Call | 725.100 | 41,79 | 17.830 | 24,12 | |||
| 2026-02-11 | 13F | Group One Trading, L.p. | Put | 212.500 | 33,15 | 5.225 | 16,55 | |||
| 2026-02-13 | 13F | Wells Fargo & Company/mn | Call | 80.000 | 0,00 | 1.967 | -12,46 | |||
| 2026-02-13 | 13F | Smartleaf Asset Management LLC | 526 | 75,33 | 13 | 50,00 | ||||
| 2026-02-17 | 13F | MIRAE ASSET GLOBAL ETFS HOLDINGS Ltd. | 353.822 | -21,16 | 8.700 | -30,99 | ||||
| 2026-02-11 | 13F | Group One Trading, L.p. | 130.499 | -63,41 | 3.209 | -67,98 | ||||
| 2026-02-13 | 13F | Transamerica Financial Advisors, Inc. | 2 | 0,00 | 0 | |||||
| 2026-02-13 | 13F | Wells Fargo & Company/mn | 94.772 | 24,16 | 2.330 | 8,68 | ||||
| 2026-02-17 | 13F | SageView Advisory Group, LLC | 126 | 3 | ||||||
| 2026-02-17 | 13F | D. E. Shaw & Co., Inc. | 0 | -100,00 | 0 | |||||
| 2026-02-12 | 13F | Brown Brothers Harriman & Co | 122 | 0,00 | 3 | 0,00 | ||||
| 2026-01-29 | 13F | Rakuten Securities, Inc. | 1.426 | -65,27 | 35 | -69,57 | ||||
| 2026-03-12 | 13F/A | Peak6 Llc | Put | 170.700 | -42,27 | 4.198 | -49,47 | |||
| 2026-03-12 | 13F/A | Peak6 Llc | Call | 31.600 | -91,13 | 777 | -92,24 | |||
| 2026-02-17 | 13F | BlueCrest Capital Management Ltd | 0 | -100,00 | 0 | -100,00 | ||||
| 2026-02-17 | 13F | Voloridge Investment Management, Llc | 38.792 | 954 | ||||||
| 2026-01-26 | 13F | Mirae Asset Global Investments Co., Ltd. | 10.883 | -0,28 | 268 | -12,75 | ||||
| 2026-02-17 | 13F | Balyasny Asset Management Llc | Put | 126.400 | 109,62 | 3.108 | 83,58 | |||
| 2026-02-17 | 13F | Persistent Asset Partners Ltd | 30.000 | 738 | ||||||
| 2026-02-17 | 13F | Balyasny Asset Management Llc | 134.001 | 7,90 | 3.295 | -5,53 | ||||
| 2026-02-13 | 13F | Caitong International Asset Management Co., Ltd | 521 | 13 | ||||||
| 2026-04-02 | 13F | Marex Group plc | 0 | 0 | ||||||
| 2026-02-17 | 13F | Balyasny Asset Management Llc | Call | 115.700 | -3,18 | 2.845 | -15,23 | |||
| 2026-02-13 | 13F | Verition Fund Management LLC | Put | 92.800 | -41,82 | 2.282 | -49,08 | |||
| 2025-11-12 | 13F | Itau Unibanco Holding S.A. | 0 | -100,00 | 0 | -100,00 | ||||
| 2026-02-10 | 13F | Bnp Paribas Arbitrage, Sa | 99.708 | -58,60 | 2.452 | -63,76 | ||||
| 2026-02-13 | 13F | Verition Fund Management LLC | Call | 21.700 | -76,59 | 534 | -79,52 | |||
| 2026-02-13 | 13F | Verition Fund Management LLC | 35.190 | 36,39 | 865 | 19,48 | ||||
| 2026-02-17 | 13F | Laird Norton Trust Company, Llc | 31.586 | 777 | ||||||
| 2026-04-17 | 13F | Bell Investment Advisors, Inc | 99 | -69,72 | 2 | -75,00 | ||||
| 2026-04-07 | 13F | Signaturefd, Llc | 9.375 | -4,41 | 212 | -12,45 | ||||
| 2026-02-17 | 13F | D. E. Shaw & Co., Inc. | Put | 13.300 | 327 | |||||
| 2026-04-16 | 13F | SG Americas Securities, LLC | 51.970 | 187,72 | 1 | |||||
| 2026-04-22 | 13F | Pictet Asset Management Holding SA | 11.800 | -9,23 | 266 | -16,61 | ||||
| 2026-02-17 | 13F | Linden Advisors Lp | 11.122 | 273 | -99,69 | |||||
| 2026-02-04 | 13F | Atlantic Union Bankshares Corp | 46 | 1 | ||||||
| 2026-02-06 | 13F | Profund Advisors Llc | 43.833 | -11,81 | 1.078 | -22,85 | ||||
| 2026-02-23 | 13F | Virtu Financial LLC | 0 | -100,00 | 0 | |||||
| 2026-02-13 | 13F | Infini Capital Management Ltd | 0 | -100,00 | 0 | |||||
| 2026-02-17 | 13F | Dark Forest Capital Management Lp | 0 | -100,00 | 0 | |||||
| 2026-01-30 | 13F | Us Bancorp \de\ | 25.662 | -4,14 | 631 | -15,98 | ||||
| 2026-02-17 | 13F | LMR Partners LLP | 374.770 | -4,87 | 9.216 | -16,73 | ||||
| 2026-02-17 | 13F | LMR Partners LLP | Put | 1.297.100 | 0,00 | 31.896 | -12,46 | |||
| 2025-11-14 | 13F | Ionic Capital Management LLC | Call | 0 | -100,00 | 0 | -100,00 | |||
| 2026-02-17 | 13F | Tudor Investment Corp Et Al | Put | 111.200 | -9,08 | 2.734 | -20,41 | |||
| 2026-02-11 | 13F | Empowered Funds, LLC | 0 | -100,00 | 0 | |||||
| 2026-02-17 | 13F | Tudor Investment Corp Et Al | Call | 85.100 | -10,52 | 2.093 | -21,68 | |||
| 2026-01-28 | 13F | Oversea-Chinese Banking CORP Ltd | 0 | -100,00 | 0 | |||||
| 2026-02-13 | 13F | Mariner, LLC | 23.070 | 11,44 | 567 | -2,41 | ||||
| 2026-02-13 | 13F | Headlands Technologies LLC | 0 | -100,00 | 0 | |||||
| 2026-02-11 | 13F | Jpmorgan Chase & Co | Put | 20.000 | 0,00 | 492 | -12,48 | |||
| 2026-02-10 | 13F | Bnp Paribas Arbitrage, Sa | Call | 100 | 246 | |||||
| 2026-02-10 | 13F | Rovida Investment Management Ltd | 150.000 | 0,00 | 3.687 | -12,49 | ||||
| 2026-02-19 | 13F | Atomi Financial Group, Inc. | 9.608 | 20,34 | 236 | 5,36 | ||||
| 2026-02-17 | 13F | Trexquant Investment LP | 0 | -100,00 | 0 | |||||
| 2026-02-11 | 13F | Jpmorgan Chase & Co | 3.203 | -50,45 | 79 | -56,91 | ||||
| 2026-02-12 | 13F | BRYN MAWR TRUST Co | 0 | -100,00 | 0 | -100,00 | ||||
| 2026-04-15 | 13F | Bayforest Capital Ltd | 2.058 | -77,87 | 46 | -79,82 | ||||
| 2026-02-13 | 13F | Arrowstreet Capital, Limited Partnership | 1.008.816 | -47,73 | 24.807 | -54,24 | ||||
| 2025-11-12 | 13F | HAP Trading, LLC | Put | 55.300 | 255 | |||||
| 2026-02-03 | 13F | Sequoia Financial Advisors, LLC | 12.733 | 1,43 | 313 | -11,08 | ||||
| 2026-02-13 | 13F | Natixis | 6.352 | -3,26 | 156 | -15,22 | ||||
| 2025-11-14 | 13F | Nomura Holdings Inc | 0 | -100,00 | 0 | -100,00 | ||||
| 2025-11-14 | 13F | Nomura Holdings Inc | Put | 0 | -100,00 | 0 | -100,00 | |||
| 2025-11-14 | 13F | Walleye Capital LLC | Call | 0 | -100,00 | 0 | -100,00 | |||
| 2025-11-14 | 13F | Moore Capital Management, Lp | 0 | -100,00 | 0 | -100,00 | ||||
| 2026-02-13 | 13F | Ubs Asset Management Americas Inc | 20.585 | 506 | ||||||
| 2026-02-12 | 13F | XY Capital Ltd | 123.541 | -25,75 | 3.038 | -35,01 | ||||
| 2026-01-16 | 13F | TB Alternative Assets Ltd. | 0 | -100,00 | 0 | |||||
| 2025-11-12 | 13F | Fox Run Management, L.l.c. | 0 | -100,00 | 0 | -100,00 | ||||
| 2026-02-06 | 13F | EverSource Wealth Advisors, LLC | 922 | 1,32 | 23 | -12,00 | ||||
| 2026-02-14 | 13F | Rockefeller Capital Management L.P. | 35 | -70,34 | 1 | -100,00 | ||||
| 2026-02-17 | 13F | Optiver Holding B.V. | 278.120 | 0,00 | 6.828 | -10,17 | ||||
| 2026-01-13 | 13F | CoreCap Advisors, LLC | 0 | -100,00 | 0 | |||||
| 2026-02-13 | 13F | State Street Corp | 189.126 | -48,62 | 4.651 | -55,02 | ||||
| 2026-01-29 | 13F | IMC-Chicago, LLC | 72.807 | -67,52 | 1.790 | -71,56 | ||||
| 2025-11-12 | 13F | HAP Trading, LLC | 10.072 | 283 | ||||||
| 2026-01-29 | 13F | IMC-Chicago, LLC | Put | 310.500 | -10,47 | 7.635 | -21,62 | |||
| 2026-02-13 | 13F | Walleye Trading LLC | Call | 660.300 | -15,85 | 16.237 | -26,34 | |||
| 2026-01-29 | 13F | IMC-Chicago, LLC | Call | 452.000 | 23,80 | 11.115 | 8,38 | |||
| 2026-02-13 | 13F | Marathon Trading Investment Management LLC | 33.796 | 5,63 | 831 | -7,46 | ||||
| 2026-02-20 | 13F/A | CMT Capital Markets Trading GmbH | Put | 149.800 | -10,99 | 4 | -25,00 | |||
| 2026-02-13 | 13F | Marathon Trading Investment Management LLC | Call | 12.400 | -0,80 | 305 | -13,39 | |||
| 2026-02-20 | 13F/A | CMT Capital Markets Trading GmbH | Call | 70.600 | 4,59 | 2 | 0,00 | |||
| 2026-02-13 | 13F | Marathon Trading Investment Management LLC | Put | 200 | 5 | |||||
| 2025-11-13 | 13F | Connor, Clark & Lunn Investment Management Ltd. | 0 | -100,00 | 0 | |||||
| 2026-02-13 | 13F | Walleye Trading LLC | Put | 1.019.400 | 36,37 | 25.067 | 19,38 | |||
| 2026-02-13 | 13F | Morgan Stanley | 3.846.849 | 187,18 | 94.594 | 151,40 | ||||
| 2026-02-09 | 13F | Geode Capital Management, Llc | 104.063 | 0,40 | 2.559 | -12,13 | ||||
| 2026-02-06 | 13F | Gsa Capital Partners Llp | 9.944 | -56,04 | 0 | |||||
| 2026-02-13 | 13F | Squarepoint Ops LLC | Call | 11.400 | -17,39 | 280 | -27,65 | |||
| 2026-02-13 | 13F | Squarepoint Ops LLC | Put | 43.900 | -15,09 | 1.080 | -25,69 | |||
| 2026-02-13 | 13F | Squarepoint Ops LLC | 26.173 | -55,99 | 644 | -61,50 | ||||
| 2026-02-13 | 13F | Pinnacle Wealth Planning Services, Inc. | 783 | 19 | ||||||
| 2025-11-14 | 13F | Lighthouse Investment Partners, LLC | 0 | -100,00 | 0 | -100,00 | ||||
| 2026-02-10 | 13F | Goldman Sachs Group Inc | 957.386 | 55,06 | 23.542 | 35,74 | ||||
| 2026-02-13 | 13F | Barclays Plc | 65.998 | 9,85 | 1.623 | -3,85 | ||||
| 2026-01-15 | 13F | Nisa Investment Advisors, Llc | 200 | 0,00 | 5 | -20,00 | ||||
| 2026-02-10 | 13F | Goldman Sachs Group Inc | Put | 520.000 | 2.500,00 | 12.787 | 2.179,14 | |||
| 2026-02-17 | 13F | Quadrature Capital Ltd | 97.068 | 6,85 | 2.387 | -6,54 | ||||
| 2026-02-13 | 13F | Dymon Asia Capital (singapore) Pte. Ltd. | 0 | -100,00 | 0 | |||||
| 2026-02-12 | 13F | Federated Hermes, Inc. | 19.425 | -23,19 | 478 | -32,82 | ||||
| 2026-02-04 | 13F | Abc Arbitrage Sa | 0 | -100,00 | 0 | |||||
| 2026-02-17 | 13F | Royal Bank Of Canada | 122.430 | -2,35 | 3.011 | -14,51 | ||||
| 2026-02-17 | 13F | Advisory Services Network, LLC | 0 | -100,00 | 0 | |||||
| 2026-04-21 | 13F | Maseco Llp | 79 | 2 | ||||||
| 2026-02-13 | 13F | Ubs Oconnor Llc | 0 | -100,00 | 0 | |||||
| 2025-11-14 | 13F | Wetherby Asset Management Inc | 22.170 | 3,35 | 623 | 35,22 | ||||
| 2026-02-17 | 13F | Guggenheim Capital Llc | 0 | -100,00 | 0 | |||||
| 2026-02-12 | 13F | Advisors Asset Management, Inc. | 8.092 | 26,14 | 199 | 10,00 | ||||
| 2026-02-17 | 13F | Northern Trust Corp | 226.299 | -5,08 | 5.565 | -16,92 | ||||
| 2026-02-17 | 13F | Millennium Management Llc | Call | 166.300 | -29,95 | 4.089 | -38,68 | |||
| 2026-02-02 | 13F | Fifth Third Bancorp | 50 | 0,00 | 1 | 0,00 | ||||
| 2026-02-12 | 13F | BlackRock, Inc. | 1.135.655 | 21,08 | 27.926 | 5,99 | ||||
| 2026-02-06 | 13F | Global Retirement Partners, LLC | 123 | 0,00 | 3 | 0,00 | ||||
| 2026-02-17 | 13F | Jones Financial Companies Lllp | 866 | 41,27 | 21 | 40,00 | ||||
| 2025-11-21 | 13F | Ovata Capital Management Ltd | 0 | -100,00 | 0 | |||||
| 2026-02-09 | 13F | Legal & General Group Plc | 45.065 | -1,48 | 1.108 | -13,85 | ||||
| 2026-02-13 | 13F | Citigroup Inc | 467.229 | 7,94 | 11.489 | -5,50 | ||||
| 2026-02-13 | 13F | Citigroup Inc | Call | 125.000 | 0,00 | 3.074 | -12,48 | |||
| 2026-01-28 | 13F | Financial Perspectives, Inc | 139 | 0,00 | 3 | 0,00 | ||||
| 2026-02-13 | 13F | Citigroup Inc | Put | 325.000 | 0,00 | 7.992 | -12,47 | |||
| 2026-02-13 | 13F | Marshall Wace, Llp | Call | 4.000 | 233,33 | 98 | 196,97 | |||
| 2026-02-13 | 13F | Marshall Wace, Llp | 20.217 | -44,91 | 497 | -51,75 | ||||
| 2026-02-13 | 13F | Marshall Wace, Llp | Put | 8.500 | 34,92 | 209 | 18,75 | |||
| 2026-02-20 | 13F/A | CMT Capital Markets Trading GmbH | 53.203 | -23,92 | 1 | 0,00 | ||||
| 2026-03-10 | 13F | MY.Alpha Management HK Advisors Ltd | 675.896 | 16.620 | ||||||
| 2026-02-09 | 13F | Huntington National Bank | 2 | 0,00 | 0 | |||||
| 2026-02-17 | 13F | Yiheng Capital Management, L.P. | Call | 0 | -100,00 | 0 | ||||
| 2026-02-03 | 13F | Ballentine Partners, LLC | 11.093 | 11,57 | 273 | -2,51 | ||||
| 2026-02-13 | 13F | Y-Intercept (Hong Kong) Ltd | 0 | -100,00 | 0 | -100,00 | ||||
| 2026-01-29 | 13F | UBS Group AG | Call | 247.820 | -81,04 | 6.094 | -83,40 | |||
| 2026-04-23 | 13F | North Star Investment Management Corp. | 115 | 0,00 | 3 | 0,00 | ||||
| 2026-01-29 | 13F | UBS Group AG | 6.180.399 | -10,27 | 151.976 | -21,45 | ||||
| 2026-02-11 | 13F | IMA Wealth, Inc. | 4 | 0 | ||||||
| 2026-02-17 | 13F | Millennium Management Llc | Put | 279.300 | 14,80 | 6.868 | 0,48 | |||
| 2026-02-17 | 13F | Millennium Management Llc | 433.200 | 84,41 | 10.652 | 61,44 | ||||
| 2026-02-13 | 13F | Polymer Capital Management (HK) LTD | 353.870 | -8,18 | 8.702 | -19,62 | ||||
| 2025-11-14 | 13F | Ghisallo Capital Management LLC | 0 | -100,00 | 0 | -100,00 | ||||
| 2026-02-17 | 13F | Point72 Asset Management, L.P. | Put | 38.900 | 0,00 | 957 | -12,45 | |||
| 2026-02-17 | 13F | Two Sigma Advisers, Lp | 69.900 | -76,04 | 1.719 | -79,03 | ||||
| 2026-02-13 | 13F | Gts Securities Llc | 229.186 | -32,78 | 5.636 | -41,16 | ||||
| 2025-11-14 | 13F | AXA Investment Managers S.A. | 272.103 | 7.643 | ||||||
| 2026-01-26 | 13F | KBC Group NV | 14.146 | 0,00 | 0 | |||||
| 2026-02-17 | 13F | Point72 Asset Management, L.P. | Call | 58.200 | 0,00 | 1.431 | -12,42 | |||
| 2026-02-10 | 13F | Norges Bank | 11.397 | 280 | ||||||
| 2026-02-17 | 13F | Evergreen Quality Fund GP, Ltd. | 56.000 | 1.377 | ||||||
| 2026-01-08 | 13F | Tuttle Tactical Management LLC | 15.200 | 374 | ||||||
| 2026-02-11 | 13F | Parallel Advisors, LLC | 5.046 | 4,02 | 124 | -8,82 | ||||
| 2026-04-24 | 13F | Root Financial Partners, LLC | 3 | 0 | ||||||
| 2026-02-17 | 13F | Advisor Group Holdings, Inc. | 3.151 | 30,21 | 77 | 32,76 | ||||
| 2026-01-29 | 13F | UBS Group AG | Put | 37.600 | 18.700,00 | 925 | 18.380,00 | |||
| 2026-02-19 | 13F | Invesco Ltd. | 109.141 | -2,59 | 2.684 | -14,74 | ||||
| 2026-04-16 | 13F | BI Asset Management Fondsmaeglerselskab A/S | 37.713 | -2,57 | 1 | |||||
| 2026-02-12 | 13F | DRW Securities, LLC | 22.774 | 560 | ||||||
| 2026-02-06 | 13F | Abn Amro Investment Solutions | 39.120 | -41,89 | 962 | -49,18 | ||||
| 2025-11-12 | 13F | Rovida Advisors Inc. | 0 | -100,00 | 0 | -100,00 | ||||
| 2025-11-13 | 13F | Glenmede Investment Management, LP | 0 | -100,00 | 0 | -100,00 | ||||
| 2025-11-14 | 13F | Larson Financial Group LLC | 0 | -100,00 | 0 | -100,00 |