Grundlæggende statistik
| Institutionelle aktier (lange) | 235.525.092 - 66,27% (ex 13D/G) - change of -7,33MM shares -2,95% MRQ |
| Institutionel værdi (lang) | $ 1.615.991 USD ($1000) |
Institutionelt ejerskab og aktionærer
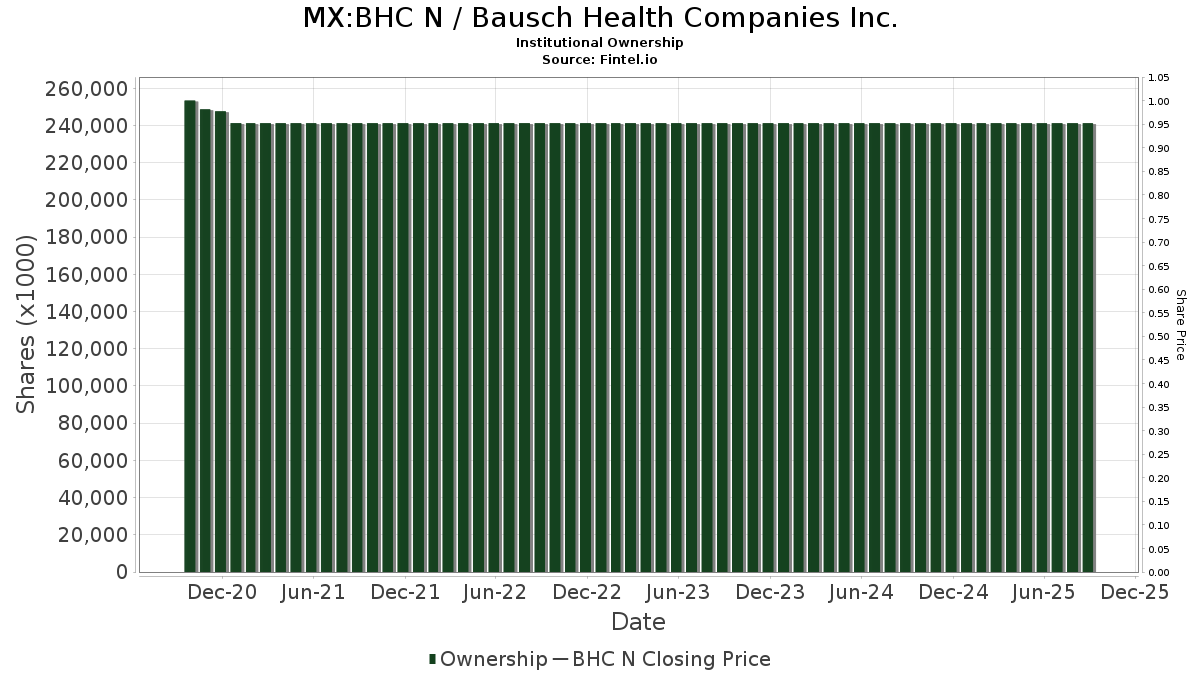
Bausch Health Companies Inc. (MX:BHC N) har 247 institutionelle ejere og aktionærer, der har indsendt 13D/G- eller 13F-formularer til Securities Exchange Commission (SEC). Disse institutioner har i alt 235,525,092 aktier. Største aktionærer omfatter Paulson & Co. Inc., Goldentree Asset Management Lp, Vanguard Group Inc, Royal Bank Of Canada, Nomura Holdings Inc, Healthcare Of Ontario Pension Plan Trust Fund, MFN Partners Management, LP, National Bank Of Canada /fi/, Kohlberg Kravis Roberts & Co. L.P., and Goldman Sachs Group Inc .
Bausch Health Companies Inc. (BMV:BHC N) institutionel ejerskabsstruktur viser aktuelle positioner i virksomheden efter institutioner og fonde, samt seneste ændringer i positionsstørrelse. Større aktionærer kan omfatte individuelle investorer, investeringsforeninger, hedgefonde eller institutioner. Skema 13D angiver, at investoren besidder (eller besidder) mere end 5 % af virksomheden og har til hensigt (eller har til hensigt at) aktivt at forfølge en ændring i forretningsstrategi. Skema 13G indikerer en passiv investering på over 5%.
Fondens stemningsscore
Fund Sentiment Score (fka Ownership Accumulation Score) finder de aktier, der bliver mest købt af fonde. Det er resultatet af en sofistikeret, multi-faktor kvantitativ model, der identificerer virksomheder med de højeste niveauer af institutionel akkumulering. Scoringsmodellen bruger en kombination af den samlede stigning i oplyste ejere, ændringerne i porteføljeallokeringer i disse ejere og andre målinger. Tallet går fra 0 til 100, hvor højere tal indikerer et højere niveau af akkumulering for sine jævnaldrende, og 50 er gennemsnittet.
Opdateringsfrekvens: Dagligt
Se Ownership Explorer, som giver en liste over højest rangerende virksomheder.
AI+ Ask Fintel’s AI assistant about Bausch Health Companies Inc..
Select a question to share a public post with an AI-crafted answer.
Thinking of good questions…
13F og NPORT arkivering
Detaljer om 13F-arkivering er gratis. Detaljer om NP-ansøgninger kræver et premium-medlemskab. Grønne rækker angiver nye positioner. Røde rækker angiver lukkede positioner. Klik på linket ikon for at se den fulde transaktionshistorik.
Opgrader
for at låse premium-data op og eksportere til Excel ![]() .
.
| Fil dato | Kilde | Investor | Type | Gennemsnitlig pris (Øst) |
Aktier | Δ Aktier (%) |
Rapporteret Værdi ($1000) |
Δ Værdi (%) |
Port Alloc (%) |
|
|---|---|---|---|---|---|---|---|---|---|---|
| 2026-02-12 | 13F | MFN Partners Management, LP | 6.000.000 | 0,00 | 41.700 | 7,75 | ||||
| 2026-02-19 | 13F | Invesco Ltd. | 178.607 | 5,89 | 1.241 | 14,17 | ||||
| 2026-04-20 | 13F | LVW Advisors, LLC | 38.090 | 206 | ||||||
| 2026-02-12 | 13F | Jane Street Group, Llc | Call | 0 | -100,00 | 0 | -100,00 | |||
| 2026-02-17 | 13F | Amundi | 14.835 | 103 | ||||||
| 2026-04-03 | 13F | Investors Research Corp | 1.300 | 0,00 | 7 | -22,22 | ||||
| 2026-02-11 | 13F | Fox Run Management, L.l.c. | 36.787 | 256 | ||||||
| 2026-02-13 | 13F | Healthcare Of Ontario Pension Plan Trust Fund | 8.452.119 | -34,98 | 58.742 | -29,94 | ||||
| 2026-02-03 | 13F | SBI Securities Co., Ltd. | 1.575 | 0,32 | 11 | 0,00 | ||||
| 2026-04-23 | 13F | SJS Investment Consulting Inc. | 30 | 0,00 | 0 | |||||
| 2026-04-22 | 13F | Stone House Investment Management, LLC | 332 | 2 | ||||||
| 2026-01-26 | 13F | Mountain Hill Investment Partners Corp. | 6.000 | 0,00 | 42 | 7,89 | ||||
| 2026-01-29 | 13F | UBS Group AG | Put | 40.000 | -27,16 | 278 | -21,47 | |||
| 2026-01-29 | 13F | UBS Group AG | 607.477 | -88,20 | 4.222 | -87,29 | ||||
| 2026-02-06 | 13F | Leonteq Securities AG | 19.976 | 8.661,40 | 190 | 18.800,00 | ||||
| 2026-02-13 | 13F | Morgan Stanley | 1.054.718 | 89,64 | 7.330 | 104,35 | ||||
| 2026-02-13 | 13F | Financial Freedom, LLC | 17.394 | 0,00 | 121 | 7,14 | ||||
| 2026-01-27 | 13F | WealthCollab, LLC | 268 | 0,00 | 2 | 0,00 | ||||
| 2026-04-17 | 13F | Viewpoint Capital Management LLC | 17.900 | 97 | ||||||
| 2026-02-02 | 13F | Wolverine Asset Management Llc | Put | 4.600 | 119,05 | 32 | 138,46 | |||
| 2026-02-17 | 13F | Cetera Investment Advisers | 18.663 | 68,67 | 130 | 81,69 | ||||
| 2026-02-13 | 13F | MAI Capital Management | 498 | 6,41 | 3 | 0,00 | ||||
| 2026-01-21 | 13F | Flagship Harbor Advisors, Llc | 61 | 0 | ||||||
| 2025-10-27 | 13F | First Horizon Corp | 0 | -100,00 | 0 | |||||
| 2026-02-13 | 13F | OMERS ADMINISTRATION Corp | 0 | -100,00 | 0 | -100,00 | ||||
| 2026-04-20 | 13F | Concurrent Investment Advisors, LLC | 0 | -100,00 | 0 | -100,00 | ||||
| 2026-02-13 | 13F | Aviso Financial Inc. | 740 | 5 | ||||||
| 2026-02-18 | 13F | State of Tennessee, Treasury Department | 46.420 | 62,77 | 266 | 45,36 | ||||
| 2026-01-28 | 13F | Lebenthal Global Advisors, LLC | 80.722 | 26,76 | 561 | 36,83 | ||||
| 2026-02-06 | 13F | Summit Wealth Group, LLC | 11.918 | 0,00 | 83 | 7,89 | ||||
| 2026-02-17 | 13F | Man Group plc | 602.128 | 4.185 | ||||||
| 2026-02-13 | 13F | Inspire Advisors, LLC | 0 | -100,00 | 0 | |||||
| 2026-04-22 | 13F | Coston, McIsaac & Partners | 201 | 0,00 | 0 | |||||
| 2026-02-17 | 13F | Aquatic Capital Management LLC | 7.069 | -54,57 | 49 | -51,00 | ||||
| 2026-02-17 | 13F | Canada Pension Plan Investment Board | 809.644 | 0,00 | 5.624 | 7,82 | ||||
| 2026-02-10 | 13F | CIBC Asset Management Inc | 242.169 | -10,38 | 1.682 | -3,17 | ||||
| 2026-02-17 | 13F | Raymond James Financial Inc | 83.539 | -22,38 | 581 | -16,43 | ||||
| 2026-02-12 | 13F | CIBC Private Wealth Group, LLC | 0 | -100,00 | 0 | |||||
| 2026-02-13 | 13F | Mariner, LLC | 55.664 | 146,24 | 387 | 166,21 | ||||
| 2026-02-13 | 13F | Squarepoint Ops LLC | Put | 0 | -100,00 | 0 | -100,00 | |||
| 2026-02-12 | 13F | Hrt Financial Lp | 37.500 | 178,00 | 0 | |||||
| 2026-02-17 | 13F | Two Sigma Investments, Lp | 1.662.680 | 154,77 | 11.556 | 174,53 | ||||
| 2026-02-06 | 13F | Global Retirement Partners, LLC | 3.610 | 0,00 | 25 | 8,70 | ||||
| 2026-02-13 | 13F | Vontobel Holding Ltd. | 23.621 | -16,73 | 164 | -9,89 | ||||
| 2025-11-14 | 13F | Ubs Asset Management Americas Inc | 0 | -100,00 | 0 | |||||
| 2026-02-04 | 13F | LRI Investments, LLC | 188 | 0,00 | 1 | 0,00 | ||||
| 2026-04-07 | 13F | Armstrong Henry H Associates Inc | 44.215 | 0,00 | 239 | -22,48 | ||||
| 2026-02-04 | 13F | Swiss Life Asset Management Ltd | 11.707 | 5,39 | 81 | 14,08 | ||||
| 2026-02-11 | 13F | Fore Capital, LLC | 120.000 | 33,33 | 834 | 43,79 | ||||
| 2026-02-17 | 13F | Soviero Asset Management, LP | 240.000 | 1.668 | ||||||
| 2026-04-02 | 13F | Ares Financial Consulting, LLC | 70 | 0 | ||||||
| 2026-02-11 | 13F | Fore Capital, LLC | Call | 120.000 | 834 | |||||
| 2026-02-17 | 13F | Private Advisor Group, LLC | 15.758 | -0,54 | 110 | 6,86 | ||||
| 2026-02-10 | 13F | Bnp Paribas Arbitrage, Sa | Put | 0 | -100,00 | 0 | -100,00 | |||
| 2026-04-20 | 13F | Ronald Blue Trust, Inc. | 50 | 0,00 | 0 | |||||
| 2026-04-10 | 13F | Country Trust Bank | 20 | 0,00 | 0 | |||||
| 2026-02-13 | 13F | Kilter Group LLC | 0 | -100,00 | 0 | |||||
| 2026-02-17 | 13F | Brevan Howard Capital Management LP | 19.740 | 137 | ||||||
| 2026-02-10 | 13F | State of Wyoming | 59.227 | 117,33 | 412 | 134,86 | ||||
| 2026-02-17 | 13F | Clear Street Markets Llc | 0 | -100,00 | 0 | |||||
| 2026-01-28 | 13F | CAPROCK Group, Inc. | 49.740 | 346 | ||||||
| 2026-02-11 | 13F | O'shaughnessy Asset Management, Llc | 331.377 | 2.303 | ||||||
| 2026-01-26 | 13F | Cwm, Llc | 2.000 | 0 | ||||||
| 2026-02-12 | 13F | Wealthspire Advisors, LLC | 0 | -100,00 | 0 | |||||
| 2026-04-16 | 13F | SG Americas Securities, LLC | 14.810 | 3,32 | 0 | |||||
| 2026-02-11 | 13F | MCF Advisors LLC | 37 | 0,00 | 0 | |||||
| 2026-02-13 | 13F | Headlands Technologies LLC | 31.729 | 221 | ||||||
| 2025-11-13 | 13F | Glenmede Investment Management, LP | 0 | -100,00 | 0 | |||||
| 2026-02-02 | 13F | Academy Capital Management Inc/tx | 42.288 | 0,00 | 294 | 7,72 | ||||
| 2025-11-14 | 13F | Point72 (DIFC) Ltd | 1.385 | 9 | ||||||
| 2026-02-12 | 13F | Brinker Capital Investments, LLC | 14.373 | 100 | ||||||
| 2025-11-14 | 13F | Royal Bank Of Canada | Call | 0 | -100,00 | 0 | -100,00 | |||
| 2026-02-10 | 13F | Quantbot Technologies LP | 46.936 | 23,42 | 326 | 33,06 | ||||
| 2026-02-17 | 13F | Alliancebernstein L.p. | 30.118 | 0,00 | 209 | 7,73 | ||||
| 2026-01-13 | 13F | Kathmere Capital Management, LLC | 12.790 | 89 | ||||||
| 2026-02-17 | 13F | Lazard Asset Management Llc | 46.025 | 15,55 | 320 | 24,61 | ||||
| 2026-02-12 | 13F | Banco BTG Pactual S.A. | 170.700 | 1.186 | ||||||
| 2026-02-10 | 13F/A | Northwestern Mutual Wealth Management Co | 5.409 | 0,00 | 38 | 8,82 | ||||
| 2026-02-13 | 13F/A | Virtus ETF Advisers LLC | 0 | -100,00 | 0 | |||||
| 2026-02-17 | 13F | Graham Capital Management, L.P. | 134.985 | 189,36 | 938 | 212,67 | ||||
| 2026-04-20 | 13F | Ritholtz Wealth Management | 222.459 | 178,78 | 1.201 | 116,79 | ||||
| 2026-02-13 | 13F | Walleye Capital LLC | Call | 23.300 | 162 | |||||
| 2026-02-13 | 13F | Walleye Capital LLC | Put | 1.200 | 8 | |||||
| 2026-02-13 | 13F | Truvestments Capital Llc | 109 | 0,00 | 1 | |||||
| 2026-02-13 | 13F | Walleye Capital LLC | 13.884 | 96 | ||||||
| 2026-02-13 | 13F | Bridgewater Associates, LP | 489.441 | 12,11 | 3.402 | 20,82 | ||||
| 2025-11-07 | 13F | Shell Asset Management Co | 4.000 | -71,83 | 0 | |||||
| 2026-02-10 | 13F | Acadian Asset Management Llc | 2.210.403 | 136,28 | 15 | 150,00 | ||||
| 2026-04-10 | 13F | Abound Wealth Management | 8 | 0 | ||||||
| 2026-02-10 | 13F | Lido Advisors, LLC | 371.629 | 2.583 | ||||||
| 2026-02-13 | 13F | Cornerstone Financial Management LLC | 187 | 1 | ||||||
| 2026-02-13 | 13F | Great West Life Assurance Co /can/ | 41.204 | -61,99 | 0 | |||||
| 2026-02-17 | 13F | Creative Planning | 18.622 | -63,23 | 129 | -60,43 | ||||
| 2026-04-16 | 13F | Toth Financial Advisory Corp | 150 | -62,50 | 1 | -100,00 | ||||
| 2026-02-17 | 13F | Susquehanna International Group, Llp | Put | 1.701.000 | 42,36 | 11.822 | 53,38 | |||
| 2026-02-13 | 13F | BNP Paribas Asset Management Holding S.A. | 655.055 | 5 | ||||||
| 2026-02-17 | 13F | Susquehanna International Group, Llp | Call | 435.100 | 8,64 | 3.024 | 17,03 | |||
| 2026-02-17 | 13F | Susquehanna International Group, Llp | 418.810 | 101,59 | 2.911 | 117,16 | ||||
| 2026-02-17 | 13F | Biglari Capital Corp. | 41.070 | 0,00 | 285 | 7,95 | ||||
| 2026-02-17 | 13F | XTX Topco Ltd | 61.148 | 55,89 | 425 | 67,59 | ||||
| 2026-02-17 | 13F | Engineers Gate Manager LP | 98.410 | 587,75 | 684 | 642,39 | ||||
| 2026-02-11 | 13F | X-Square Capital, LLC | 17.950 | -4,12 | 0 | |||||
| 2026-04-23 | 13F | MQS Management LLC | 17.492 | 94 | ||||||
| 2026-02-17 | 13F | PDT Partners, LLC | 50.045 | 19,60 | 348 | 29,00 | ||||
| 2026-02-02 | 13F | Intact Investment Management Inc. | 100.500 | -11,53 | 698 | -4,65 | ||||
| 2026-01-28 | 13F | Universal- Beteiligungs- und Servicegesellschaft mbH | 171.169 | 29,47 | 1.194 | 40,19 | ||||
| 2025-11-06 | 13F | CBIZ Investment Advisory Services, LLC | 0 | -100,00 | 0 | |||||
| 2025-11-14 | 13F | Parallax Volatility Advisers, L.P. | Call | 0 | -100,00 | 0 | -100,00 | |||
| 2026-02-12 | 13F | Renaissance Technologies Llc | 1.432.191 | 20,89 | 9.954 | 30,26 | ||||
| 2026-02-03 | 13F | Credit Industriel Et Commercial | 46.797 | 0,00 | 325 | 7,97 | ||||
| 2026-02-17 | 13F | Parallax Volatility Advisers, L.P. | Put | 0 | -100,00 | 0 | -100,00 | |||
| 2026-02-17 | 13F | SIG North Trading, ULC | Put | 160.400 | 33,00 | 1.115 | 43,37 | |||
| 2026-02-17 | 13F | SIG North Trading, ULC | Call | 277.900 | 47,98 | 1.931 | 59,45 | |||
| 2026-02-12 | 13F | Federation des caisses Desjardins du Quebec | 11.410 | -7,01 | 79 | 1,28 | ||||
| 2026-02-17 | 13F | Tower Research Capital LLC (TRC) | 3.028 | -56,88 | 21 | -53,33 | ||||
| 2025-11-14 | 13F | Wolverine Trading, Llc | 18.553 | 120 | ||||||
| 2026-02-05 | 13F | Bessemer Group Inc | 13.500 | 0 | ||||||
| 2025-11-14 | 13F | Wolverine Trading, Llc | Call | 152.000 | 983 | |||||
| 2025-11-14 | 13F | Wolverine Trading, Llc | Put | 204.700 | 1.324 | |||||
| 2026-02-13 | 13F | JustInvest LLC | 11.431 | 79 | ||||||
| 2025-10-29 | 13F | JCIC Asset Management Inc. | 0 | -100,00 | 0 | |||||
| 2026-02-18 | 13F | Mackenzie Financial Corp | 310.915 | 57,91 | 2.173 | 71,43 | ||||
| 2026-04-07 | 13F | Farther Finance Advisors, LLC | 75 | -91,03 | 0 | -100,00 | ||||
| 2026-02-10 | 13F | Savant Capital, LLC | 38.004 | 264 | ||||||
| 2026-02-12 | 13F | Dimensional Fund Advisors Lp | 3.253.995 | 8,02 | 22.616 | 16,39 | ||||
| 2026-02-06 | 13F | GPS Wealth Strategies Group, LLC | 270 | 0,00 | 2 | 0,00 | ||||
| 2026-02-17 | 13F | Investment Management Corp of Ontario | 32.275 | 224 | ||||||
| 2026-02-06 | 13F | EverSource Wealth Advisors, LLC | 196 | 161,33 | 1 | |||||
| 2026-02-11 | 13F | Simplex Trading, Llc | Put | 141.700 | -72,81 | 985 | 32.700,00 | |||
| 2026-02-12 | 13F | Round Hill Asset Management | 73.687 | -0,54 | 511 | 7,13 | ||||
| 2025-11-06 | 13F | Stratos Wealth Advisors, LLC | 0 | -100,00 | 0 | |||||
| 2026-02-11 | 13F | Simplex Trading, Llc | 6.478 | 45 | ||||||
| 2026-02-11 | 13F | Group One Trading, L.p. | Put | 673.800 | -6,97 | 4.683 | 0,24 | |||
| 2026-01-12 | 13F | CVA Family Office, LLC | 143 | 1 | ||||||
| 2026-02-05 | 13F | Gamco Investors, Inc. Et Al | 874.452 | -3,49 | 6.077 | 4,00 | ||||
| 2026-02-17 | 13F | Goldentree Asset Management Lp | 34.665.731 | -0,48 | 240.639 | 7,23 | ||||
| 2026-02-12 | 13F | Swiss National Bank | 514.160 | 1,64 | 3.577 | 9,79 | ||||
| 2026-02-17 | 13F | Paulson & Co. Inc. | 73.255.869 | 3,53 | 509.128 | 11,56 | ||||
| 2026-02-17 | 13F | Gotham Asset Management, LLC | 57.161 | 0,24 | 397 | 8,17 | ||||
| 2026-02-17 | 13F | Russell Investments Group, Ltd. | 105.363 | 2.010,64 | 733 | 2.187,50 | ||||
| 2026-02-17 | 13F | Qube Research & Technologies Ltd | 636.065 | 4.421 | ||||||
| 2026-02-17 | 13F | Third Point LLC | 350.000 | 250,00 | 2.432 | 277,05 | ||||
| 2026-02-10 | 13F | Td Asset Management Inc | 840.584 | 2,81 | 5.844 | 11,00 | ||||
| 2026-02-12 | 13F | Skopos Labs, Inc. | 20.679 | 147 | ||||||
| 2026-02-13 | 13F | Public Sector Pension Investment Board | 0 | -100,00 | 0 | |||||
| 2026-04-03 | 13F | Global Wealth Strategies & Associates | 137 | 0,00 | 1 | |||||
| 2026-04-23 | 13F | Glass Jacobson Investment Advisors llc | 372 | 0,00 | 2 | 0,00 | ||||
| 2026-02-17 | 13F | Bank Of America Corp /de/ | 1.507.558 | 4,12 | 10.478 | 12,20 | ||||
| 2026-02-17 | 13F | Caption Management, LLC | Put | 0 | -100,00 | 0 | ||||
| 2025-11-14 | 13F | ExodusPoint Capital Management, LP | 0 | -100,00 | 0 | |||||
| 2026-04-15 | 13F | Merit Financial Group, LLC | 30.915 | -13,01 | 167 | -32,52 | ||||
| 2026-02-19 | 13F | First Growth Capital LLC | 32.660 | 199 | ||||||
| 2026-01-29 | 13F | Vanguard Group Inc | 10.679.760 | -12,75 | 74.150 | -5,91 | ||||
| 2026-02-05 | 13F | Gabelli Funds Llc | 56.000 | 0,00 | 389 | 7,76 | ||||
| 2026-02-13 | 13F | Hudson Bay Capital Management LP | 5.000.000 | 0,00 | 34.750 | 7,75 | ||||
| 2026-02-12 | 13F | Quadrant Capital Group Llc | 1.749 | 122,80 | 12 | 140,00 | ||||
| 2026-02-12 | 13F | Nuveen, LLC | 334.156 | 62,39 | 2.323 | 75,32 | ||||
| 2026-04-15 | 13F | Activest Wealth Management | 1.900 | 0,00 | 10 | -23,08 | ||||
| 2026-02-17 | 13F | Jump Financial, LLC | 776.865 | 1.216,72 | 5.399 | 1.320,79 | ||||
| 2026-02-12 | 13F | Marex Group plc | 30.327 | -43,35 | 211 | -39,13 | ||||
| 2026-02-13 | 13F | Smartleaf Asset Management LLC | 53 | 0 | ||||||
| 2026-02-17 | 13F | Trexquant Investment LP | 233.487 | 1.623 | ||||||
| 2026-02-05 | 13F | Millennium Capital Advisors, LLC | 0 | -100,00 | 0 | |||||
| 2026-04-20 | 13F | Nexus Investment Management ULC | 8.500 | 0,00 | 46 | -23,73 | ||||
| 2025-11-21 | 13F | Nebula Research & Development LLC | 0 | -100,00 | 0 | |||||
| 2026-02-02 | 13F | Cornerstone Planning Group LLC | 12 | 0,00 | 0 | |||||
| 2026-02-11 | 13F | Winton Capital Group Ltd | 48.857 | 1,82 | 340 | 9,71 | ||||
| 2026-04-09 | 13F | Park Place Capital Corp | 150 | 0,00 | 1 | -100,00 | ||||
| 2026-01-30 | 13F | Mitsubishi UFJ Trust & Banking Corp | 366.724 | 15,28 | 2.529 | 23,49 | ||||
| 2026-02-17 | 13F | Citadel Advisors Llc | Put | 559.700 | 1,49 | 3.890 | 9,33 | |||
| 2026-04-09 | 13F | Sanders Morris Harris Llc | 28.975 | 156 | ||||||
| 2026-02-17 | 13F | Whitebox Advisors Llc | 544.497 | 55,20 | 3.784 | 67,29 | ||||
| 2026-02-17 | 13F | Balyasny Asset Management Llc | 296.903 | 1.432,32 | 2.063 | 1.563,71 | ||||
| 2026-02-17 | 13F | Public Employees Retirement System Of Ohio | 201.742 | -12,11 | 1.403 | -5,14 | ||||
| 2026-02-13 | 13F | National Bank Of Canada /fi/ | 5.315.669 | -31,17 | 36.902 | -25,90 | ||||
| 2026-04-17 | 13F | Bell Investment Advisors, Inc | 233 | 57,43 | 1 | 0,00 | ||||
| 2026-02-13 | 13F | Eschler Asset Management LLP | 0 | -100,00 | 0 | |||||
| 2026-02-17 | 13F | Citadel Advisors Llc | Call | 156.200 | -59,37 | 1.086 | -56,23 | |||
| 2026-02-17 | 13F | Citadel Advisors Llc | 1.487.295 | 5.292,66 | 10.337 | 5.739,55 | ||||
| 2026-02-17 | 13F | Royal Bank Of Canada | 9.100.604 | -13,38 | 63.249 | -6,67 | ||||
| 2026-02-11 | 13F | Group One Trading, L.p. | Call | 648.300 | -3,38 | 4.506 | 4,11 | |||
| 2026-02-11 | 13F | Picton Mahoney Asset Management | 91.528 | -1,16 | 636 | |||||
| 2026-02-11 | 13F | Simplex Trading, Llc | Call | 271.600 | -21,98 | 1.888 | 94.250,00 | |||
| 2026-02-02 | 13F | Wolverine Asset Management Llc | Call | 5.400 | 58,82 | 38 | 76,19 | |||
| 2026-02-05 | 13F | Allworth Financial LP | 1.881 | 16,40 | 13 | 30,00 | ||||
| 2026-02-13 | 13F | Verition Fund Management LLC | 22.127 | -87,10 | 154 | -86,17 | ||||
| 2025-10-27 | 13F | New Republic Capital, LLC | 0 | -100,00 | 0 | |||||
| 2026-04-22 | 13F | Pictet Asset Management Holding SA | 54.169 | 4,06 | 292 | -19,39 | ||||
| 2025-11-07 | 13F | Pnc Financial Services Group, Inc. | 0 | -100,00 | 0 | |||||
| 2026-02-17 | 13F | Capstone Investment Advisors, Llc | 93.469 | 17,29 | 650 | 26,26 | ||||
| 2026-02-13 | 13F | SRS Capital Advisors, Inc. | 28 | 0 | ||||||
| 2026-02-12 | 13F | Steward Partners Investment Advisory, Llc | 43 | 0,00 | 0 | |||||
| 2026-02-17 | 13F | Alpine Global Management, LLC | Put | 0 | -100,00 | 0 | -100,00 | |||
| 2026-02-13 | 13F | Charles Schwab Investment Management Inc | 2.045.737 | 8,01 | 14.223 | 16,61 | ||||
| 2026-01-16 | 13F | Kendall Capital Management | 0 | -100,00 | 0 | |||||
| 2026-02-13 | 13F | National Bank Of Canada /fi/ | Put | 332 | 230 | |||||
| 2026-02-13 | 13F | Colony Group, LLC | 71.016 | 0,26 | 459 | -1,29 | ||||
| 2026-02-13 | 13F | Wells Fargo & Company/mn | 339.313 | 10,41 | 2.358 | 18,97 | ||||
| 2026-02-14 | 13F | Rockefeller Capital Management L.P. | 54 | 0 | ||||||
| 2026-02-12 | 13F | Jane Street Group, Llc | 682.163 | 408,56 | 4.741 | 448,09 | ||||
| 2026-01-30 | 13F | Us Bancorp \de\ | 240 | 0,00 | 2 | 0,00 | ||||
| 2026-02-11 | 13F | Ing Groep Nv | 5.000.000 | 0,00 | 34.750 | 7,75 | ||||
| 2026-02-12 | 13F | Jane Street Group, Llc | Put | 170.400 | 0,95 | 1.184 | 8,82 | |||
| 2026-04-07 | 13F | Signaturefd, Llc | 7.040 | -22,33 | 38 | -38,71 | ||||
| 2026-02-17 | 13F | Alpine Global Management, LLC | 0 | -100,00 | 0 | -100,00 | ||||
| 2026-02-06 | 13F | Larson Financial Group LLC | 815 | 1.214,52 | 6 | |||||
| 2026-01-27 | 13F | TD Waterhouse Canada Inc. | 1.468 | 10,38 | 10 | 25,00 | ||||
| 2026-02-17 | 13F | D. E. Shaw & Co., Inc. | 1.680.629 | 80,21 | 11.678 | 94,26 | ||||
| 2026-02-11 | 13F | Compass Rose Asset Management, LP | 0 | -100,00 | 0 | |||||
| 2025-11-06 | 13F | Gruss & Co., LLC | 0 | -100,00 | 0 | |||||
| 2026-01-27 | 13F | Zurcher Kantonalbank (Zurich Cantonalbank) | 88.971 | 0,00 | 619 | 8,04 | ||||
| 2026-04-23 | 13F | McMillan Office, Inc. | 300 | 0,00 | 2 | -50,00 | ||||
| 2026-02-17 | 13F | Tudor Investment Corp Et Al | 11.800 | 82 | ||||||
| 2026-04-15 | 13F | FNY Investment Advisers, LLC | 130 | 333,33 | 0 | |||||
| 2025-11-07 | 13F | Readystate Asset Management Lp | 0 | -100,00 | 0 | |||||
| 2026-02-17 | 13F | Aqr Capital Management Llc | 101.341 | 704 | ||||||
| 2026-03-03 | 13F/A | Caitong International Asset Management Co., Ltd | 10.058 | 25.689,74 | 70 | |||||
| 2026-02-03 | 13F | Sequoia Financial Advisors, LLC | 25.158 | 4,14 | 175 | 12,26 | ||||
| 2026-02-17 | 13F | Blair William & Co/il | 78.002 | -0,98 | 542 | 6,69 | ||||
| 2026-02-03 | 13F | Sequoia Financial Advisors, LLC | Call | 313 | 141,86 | |||||
| 2026-02-06 | 13F | Gsa Capital Partners Llp | 18.872 | 0 | ||||||
| 2026-04-22 | 13F | Spire Wealth Management | 0 | -100,00 | 0 | |||||
| 2026-02-24 | 13F | DGS Capital Management, LLC | 0 | -100,00 | 0 | |||||
| 2026-01-07 | 13F | Marotta Asset Management | 13.225 | 0,00 | 92 | 4,60 | ||||
| 2026-02-10 | 13F | Bank of New York Mellon Corp | 37.504 | -1,78 | 261 | 5,69 | ||||
| 2026-02-10 | 13F | Hillsdale Investment Management Inc. | 524.892 | 3.651 | ||||||
| 2026-02-20 | 13F | Sunbelt Securities, Inc. | 0 | -100,00 | 0 | |||||
| 2026-02-02 | 13F | Alpha Wealth Funds, LLC | 10.000 | 0,00 | 72 | 26,32 | ||||
| 2026-02-13 | 13F | Centiva Capital, LP | 0 | -100,00 | 0 | |||||
| 2026-02-26 | 13F/A | Aristides Capital LLC | 28.639 | 199 | ||||||
| 2026-02-12 | 13F | Commonwealth Equity Services, Llc | 14.067 | 14,79 | 98 | |||||
| 2025-11-12 | 13F | GABELLI & Co INVESTMENT ADVISERS, INC. | 0 | -100,00 | 0 | |||||
| 2026-01-29 | 13F | IMC-Chicago, LLC | Put | 72.200 | 24,48 | 502 | 33,96 | |||
| 2026-01-29 | 13F | IMC-Chicago, LLC | Call | 35.100 | -51,92 | 244 | -48,30 | |||
| 2026-02-13 | 13F | Manufacturers Life Insurance Company, The | 0 | -100,00 | 0 | |||||
| 2026-02-17 | 13F | Tang Capital Management Llc | 0 | -100,00 | 0 | |||||
| 2026-02-10 | 13F | Bnp Paribas Arbitrage, Sa | 53.236 | -95,96 | 370 | -95,66 | ||||
| 2026-02-13 | 13F | Umb Bank N A/mo | 1.770 | 0,00 | 12 | 9,09 | ||||
| 2026-02-11 | 13F | Jpmorgan Chase & Co | 253.640 | 3,62 | 1.763 | 11,66 | ||||
| 2026-02-17 | 13F | DZ BANK AG Deutsche Zentral Genossenschafts Bank, Frankfurt am Main | 784.523 | 47,21 | 5.452 | 58,63 | ||||
| 2026-02-11 | 13F | Jpmorgan Chase & Co | Call | 50.200 | 349 | |||||
| 2025-11-12 | 13F | HAP Trading, LLC | Put | 372.500 | 212 | |||||
| 2026-02-13 | 13F | Arrowstreet Capital, Limited Partnership | 2.723.655 | 1.224,79 | 18.914 | 1.327,47 | ||||
| 2026-02-17 | 13F | Susquehanna Advisors Group, Inc. | 15.800 | -75,16 | 110 | -73,41 | ||||
| 2026-01-30 | 13F | Harbor Advisors LLC | 10.000 | 0,00 | 70 | 7,81 | ||||
| 2026-02-11 | 13F | LPL Financial LLC | 144.104 | 134,44 | 1.002 | 152,78 | ||||
| 2026-02-13 | 13F | Macquarie Group Ltd | 3.250.000 | 0,00 | 22.588 | 7,75 | ||||
| 2026-02-02 | 13F | Truist Financial Corp | 61.398 | 132,11 | 390 | 128,82 | ||||
| 2026-02-02 | 13F | Wolverine Asset Management Llc | 82.718 | -1,05 | 575 | 6,49 | ||||
| 2025-11-14 | 13F | Quarry LP | 0 | -100,00 | 0 | |||||
| 2026-02-17 | 13F | Two Sigma Securities, Llc | 11.473 | 80 | ||||||
| 2026-02-17 | 13F | Fountainhead AM, LLC | 0 | -100,00 | 0 | |||||
| 2026-02-17 | 13F | Maple Rock Capital Partners Inc. | 0 | -100,00 | 0 | |||||
| 2026-02-17 | 13F | Crawford Fund Management, LLC | Put | 198.500 | -26,48 | 1.380 | -20,79 | |||
| 2026-01-15 | 13F | Range Financial Group LLC | 175.996 | 8,79 | 1.223 | 17,26 | ||||
| 2026-02-12 | 13F | Federated Hermes, Inc. | 134.030 | 7,52 | 932 | 15,80 | ||||
| 2026-04-16 | 13F | Clark Asset Management, LLC | 11.628 | 0,00 | 63 | -22,50 | ||||
| 2026-02-13 | 13F | Walleye Trading LLC | 31.813 | 221 | ||||||
| 2026-02-17 | 13F | Nomura Holdings Inc | 8.699.533 | -44,62 | 60.462 | -40,32 | ||||
| 2025-11-14 | 13F | Icahn Carl C | 0 | -100,00 | 0 | -100,00 | ||||
| 2026-02-11 | 13F | Deutsche Bank Ag\ | 20.544 | 0,00 | 143 | 7,58 | ||||
| 2026-02-11 | 13F | Cerity Partners LLC | 70.178 | -0,96 | 488 | 6,56 | ||||
| 2025-11-17 | 13F | GWM Advisors LLC | 0 | -100,00 | 0 | |||||
| 2026-02-13 | 13F | Walleye Trading LLC | Put | 79.100 | 28,62 | 550 | 38,64 | |||
| 2026-02-13 | 13F | Stifel Financial Corp | 14.206 | -12,34 | 99 | -5,77 | ||||
| 2026-02-13 | 13F | Walleye Trading LLC | Call | 60.700 | -37,16 | 422 | -32,42 | |||
| 2026-02-11 | 13F | Franklin Resources Inc | 69.531 | -4,22 | 483 | -50,00 | ||||
| 2026-02-17 | 13F | Advisory Services Network, LLC | 0 | -100,00 | 0 | |||||
| 2026-02-13 | 13F | National Bank Of Canada /fi/ | Call | 550 | 216,09 | 382 | 240,18 | |||
| 2026-02-11 | 13F | Private Management Group Inc | 1.892.895 | 16,72 | 13.156 | 25,76 | ||||
| 2026-02-13 | 13F | Neuberger Berman Group LLC | 31.050 | 0,16 | 216 | 8,04 | ||||
| 2026-02-17 | 13F/A | Northwest & Ethical Investments L.P. | 59.984 | 52,27 | 417 | 64,43 | ||||
| 2026-03-06 | 13F | Hsbc Holdings Plc | 0 | -100,00 | 0 | |||||
| 2026-02-09 | 13F | Legal & General Group Plc | 341.678 | 6,57 | 2.375 | 15,07 | ||||
| 2026-02-17 | 13F | Oxford Asset Management Llp | 60.736 | 422 | ||||||
| 2026-02-17 | 13F | Oaktree Capital Management Lp | 1.270.000 | 0,00 | 8.826 | 7,75 | ||||
| 2026-02-13 | 13F | Fort Point Capital Partners LLC | 0 | -100,00 | 0 | |||||
| 2026-02-13 | 13F/A | Alberta Investment Management Corp | 0 | -100,00 | 0 | |||||
| 2026-02-09 | 13F | Geode Capital Management, Llc | 1.723.682 | 18,74 | 15.995 | 26,68 | ||||
| 2026-02-17 | 13F | Cinctive Capital Management LP | 0 | -100,00 | 0 | |||||
| 2026-02-13 | 13F | Barclays Plc | 19.965 | 181,59 | 139 | 206,67 | ||||
| 2026-02-06 | 13F | Handelsbanken Fonder AB | 48.600 | -19,40 | 0 | |||||
| 2026-02-17 | 13F | Kohlberg Kravis Roberts & Co. L.P. | 5.235.000 | 0,00 | 36.383 | 7,75 | ||||
| 2026-02-17 | 13F | Advisor Group Holdings, Inc. | 48.291 | 19,46 | 336 | 23,62 | ||||
| 2025-11-14 | 13F | Point72 Asia (Singapore) Pte. Ltd. | 132 | 1 | ||||||
| 2026-03-05 | 13F | Gunpowder Capital Management, LLC dba Oliver Wealth Management | 1.000 | 7 | ||||||
| 2026-02-10 | 13F | MUFG Securities EMEA plc | 0 | -100,00 | 0 | |||||
| 2026-02-13 | 13F | Dynamic Technology Lab Private Ltd | 0 | -100,00 | 0 | |||||
| 2026-02-13 | 13F | Van Eck Associates Corp | 206.438 | 78,75 | 1 | |||||
| 2026-02-17 | 13F | New Vernon Capital Holdings II LLC | 10.951 | 0,00 | 104 | 48,57 | ||||
| 2026-02-17 | 13F | Quadrature Capital Ltd | 336.712 | 2.341 | ||||||
| 2026-01-22 | 13F | Bfsg, Llc | 15.095 | 4,36 | 105 | 11,83 | ||||
| 2026-02-13 | 13F | American Century Companies Inc | 41.260 | 51,49 | 286 | 63,43 | ||||
| 2026-02-17 | 13F | SIG North Trading, ULC | 0 | -100,00 | 0 | |||||
| 2025-11-14 | 13F | Cubist Systematic Strategies, LLC | 24.340 | 157 | ||||||
| 2026-04-14 | 13F | Nbc Securities, Inc. | 150 | 0,00 | 1 | -100,00 | ||||
| 2026-02-13 | 13F | Gendell Jeffrey L | 1.298.275 | 9.023 | ||||||
| 2026-02-05 | 13F | Cambridge Investment Research Advisors, Inc. | 0 | -100,00 | 0 | |||||
| 2026-02-13 | 13F | Toroso Investments, LLC | 50.465 | -2,45 | 351 | 5,11 | ||||
| 2026-02-10 | 13F | CIBC World Markets Inc. | 73.098 | -55,61 | 507 | -52,12 | ||||
| 2026-02-11 | 13F | Parallel Advisors, LLC | 1.607 | 0,00 | 11 | 10,00 | ||||
| 2026-02-13 | 13F | Citigroup Inc | 205.863 | 38,02 | 1.431 | 49,06 | ||||
| 2026-04-21 | 13F | Poehling Capital Management, LLC | 85.604 | -0,48 | 462 | -22,61 | ||||
| 2026-02-13 | 13F | Citigroup Inc | Put | 220.000 | 0,00 | 1.530 | 7,98 | |||
| 2026-02-12 | 13F | Bank Of Montreal /can/ | 832.267 | 2,19 | 5.779 | 10,23 | ||||
| 2026-02-10 | 13F | Gifford Fong Associates | 100.000 | 0,00 | 1 | |||||
| 2026-02-13 | 13F | Y-Intercept (Hong Kong) Ltd | 212.231 | 218,86 | 1.475 | 243,82 | ||||
| 2026-02-17 | 13F | Lombard Odier Asset Management (USA) Corp | Put | 666.000 | -61,19 | 4.629 | -58,19 | |||
| 2026-02-17 | 13F | Jones Financial Companies Lllp | 45 | -92,01 | 0 | -100,00 | ||||
| 2026-02-13 | 13F | BRITISH COLUMBIA INVESTMENT MANAGEMENT Corp | 139.610 | -8,84 | 969 | -1,62 | ||||
| 2026-02-13 | 13F | Squarepoint Ops LLC | 78.715 | -22,77 | 547 | -16,74 | ||||
| 2025-11-07 | 13F | Murphy & Mullick Capital Management Corp | 0 | -100,00 | 0 | |||||
| 2026-04-23 | 13F | North Star Investment Management Corp. | 335 | 0,00 | 2 | -50,00 | ||||
| 2026-02-04 | 13F | Plato Investment Management Ltd | 2.941 | 0,00 | 21 | 11,11 | ||||
| 2026-02-17 | 13F | Caption Management, LLC | 4.464 | -71,52 | 31 | -69,31 | ||||
| 2026-04-20 | 13F | City State Bank | 100 | 0,00 | 1 | |||||
| 2026-01-29 | 13F | Camelot Portfolios, LLC | 8.500 | 59 | ||||||
| 2026-02-12 | 13F | BlackRock, Inc. | 136.075 | 3,87 | 946 | 11,97 | ||||
| 2026-02-13 | 13F | Aigen Investment Management, Lp | 11.199 | -71,03 | 78 | -69,08 | ||||
| 2026-02-17 | 13F | Schonfeld Strategic Advisors LLC | 147.083 | 902,34 | 1.022 | 987,23 | ||||
| 2026-02-17 | 13F | Toronto Dominion Bank | 147.956 | 702,19 | 1.027 | 770,34 | ||||
| 2026-02-17 | 13F | Millennium Management Llc | 1.836.137 | 290,78 | 12.758 | 321,16 | ||||
| 2026-02-17 | 13F | Toronto Dominion Bank | Call | 600 | -75,00 | 4 | -73,33 | |||
| 2026-02-13 | 13F | Marshall Wace, Llp | 604.481 | 4.201 | ||||||
| 2026-04-08 | 13F | Thompson Investment Management, Inc. | 0 | -100,00 | 0 | |||||
| 2026-02-10 | 13F | Norges Bank | 3.682.488 | 25.592 | ||||||
| 2026-02-17 | 13F | Two Sigma Advisers, Lp | 1.059.939 | 118,62 | 7.367 | 135,56 | ||||
| 2026-01-12 | 13F | Salem Investment Counselors Inc | 0 | -100,00 | 0 | |||||
| 2026-02-17 | 13F | Point72 Asset Management, L.P. | 1.359.740 | 403,61 | 9.450 | 442,79 | ||||
| 2026-02-10 | 13F | Goldman Sachs Group Inc | 5.143.641 | 65,67 | 35.748 | 78,51 | ||||
| 2026-02-12 | 13F | Brown Brothers Harriman & Co | 0 | -100,00 | 0 | |||||
| 2026-02-12 | 13F | Principal Securities, Inc. | 17.030 | 0,00 | 118 | 8,26 |