Grundlæggende statistik
| Institutionelle ejere | 141 total, 138 long only, 2 short only, 1 long/short - change of -6,62% MRQ |
| Del pris | 8,69 |
| Gennemsnitlig porteføljeallokering | 0.0667 % - change of -48,07% MRQ |
| Institutionelle aktier (lange) | 22.671.726 (ex 13D/G) - change of -2,53MM shares -10,03% MRQ |
| Institutionel værdi (lang) | $ 178.367 USD ($1000) |
Institutionelt ejerskab og aktionærer
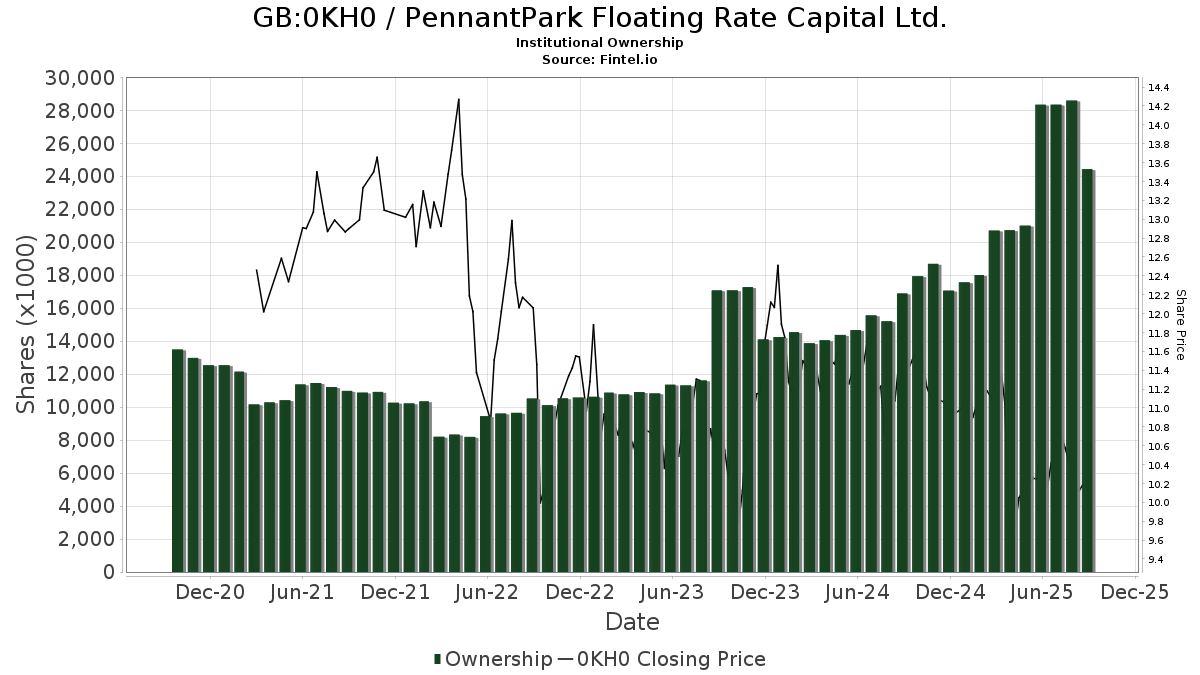
PennantPark Floating Rate Capital Ltd. (GB:0KH0) har 141 institutionelle ejere og aktionærer, der har indsendt 13D/G- eller 13F-formularer til Securities Exchange Commission (SEC). Disse institutioner har i alt 22,671,726 aktier. Største aktionærer omfatter Sound Income Strategies, LLC, Van Eck Associates Corp, UBS Group AG, Altshuler Shaham Ltd, Invesco Ltd., Diameter Capital Partners LP, Marshall Wace, Llp, Millennium Management Llc, Legal & General Group Plc, and BlackRock, Inc. .
PennantPark Floating Rate Capital Ltd. (LSE:0KH0) institutionel ejerskabsstruktur viser aktuelle positioner i virksomheden efter institutioner og fonde, samt seneste ændringer i positionsstørrelse. Større aktionærer kan omfatte individuelle investorer, investeringsforeninger, hedgefonde eller institutioner. Skema 13D angiver, at investoren besidder (eller besidder) mere end 5 % af virksomheden og har til hensigt (eller har til hensigt at) aktivt at forfølge en ændring i forretningsstrategi. Skema 13G indikerer en passiv investering på over 5%.
The share price as of April 24, 2026 is 8,69 / share. Previously, on April 29, 2025, the share price was 10,14 / share. This represents a decline of 14,29% over that period.
Fondens stemningsscore
Fund Sentiment Score (fka Ownership Accumulation Score) finder de aktier, der bliver mest købt af fonde. Det er resultatet af en sofistikeret, multi-faktor kvantitativ model, der identificerer virksomheder med de højeste niveauer af institutionel akkumulering. Scoringsmodellen bruger en kombination af den samlede stigning i oplyste ejere, ændringerne i porteføljeallokeringer i disse ejere og andre målinger. Tallet går fra 0 til 100, hvor højere tal indikerer et højere niveau af akkumulering for sine jævnaldrende, og 50 er gennemsnittet.
Opdateringsfrekvens: Dagligt
Se Ownership Explorer, som giver en liste over højest rangerende virksomheder.
AI+ Ask Fintel’s AI assistant about PennantPark Floating Rate Capital Ltd..
Select a question to share a public post with an AI-crafted answer.
Thinking of good questions…
13F og NPORT arkivering
Detaljer om 13F-arkivering er gratis. Detaljer om NP-ansøgninger kræver et premium-medlemskab. Grønne rækker angiver nye positioner. Røde rækker angiver lukkede positioner. Klik på linket ikon for at se den fulde transaktionshistorik.
Opgrader
for at låse premium-data op og eksportere til Excel ![]() .
.
| Fil dato | Kilde | Investor | Type | Gennemsnitlig pris (Øst) |
Aktier | Δ Aktier (%) |
Rapporteret Værdi ($1000) |
Δ Værdi (%) |
Port Alloc (%) |
|
|---|---|---|---|---|---|---|---|---|---|---|
| 2026-02-13 | 13F | Toroso Investments, LLC | 0 | -100,00 | 0 | |||||
| 2026-02-17 | 13F | Jones Financial Companies Lllp | 200 | -9,09 | 2 | -50,00 | ||||
| 2025-11-21 | 13F | Nebula Research & Development LLC | 0 | -100,00 | 0 | |||||
| 2026-02-10 | 13F | Bnp Paribas Arbitrage, Sa | 59.281 | 164,52 | 550 | 175,88 | ||||
| 2026-02-11 | 13F | LPL Financial LLC | 417.065 | -5,67 | 3.866 | -1,63 | ||||
| 2026-02-12 | 13F | CIBC Private Wealth Group, LLC | 7.122 | 0,00 | 66 | 4,76 | ||||
| 2026-04-23 | 13F | Cornerstone Wealth Management, LLC | 22.612 | -34,31 | 182 | -43,26 | ||||
| 2026-02-03 | 13F | Garner Asset Management Corp | 14.281 | 0,06 | 132 | 4,76 | ||||
| 2026-01-26 | 13F | Private Trust Co Na | 2.530 | 0,00 | 23 | 4,55 | ||||
| 2026-02-09 | 13F | Harbour Investments, Inc. | 0 | -100,00 | 0 | |||||
| 2026-04-17 | 13F | Krilogy Financial LLC | 123.880 | 0,00 | 1.072 | -8,70 | ||||
| 2026-01-29 | 13F | Facet Wealth, Inc. | 19.805 | 186 | ||||||
| 2026-04-14 | 13F | Westend Capital Management LLC | 17.118 | 138 | ||||||
| 2026-01-26 | 13F | Key Capital Management, INC | 9.783 | 91 | ||||||
| 2026-02-17 | 13F | Diameter Capital Partners LP | 1.184.476 | 10.980 | ||||||
| 2026-02-13 | 13F | State Street Corp | 107.263 | 23,92 | 1.005 | 29,18 | ||||
| 2026-02-14 | 13F | Rockefeller Capital Management L.P. | 3.000 | 0,00 | 28 | 3,85 | ||||
| 2026-01-23 | 13F | Sumitomo Mitsui Trust Holdings, Inc. | 147.213 | 0,00 | 1.365 | 4,28 | ||||
| 2026-02-17 | 13F | Mpwm Advisory Solutions, Llc | 0 | -100,00 | 0 | |||||
| 2026-02-23 | 13F | Virtu Financial LLC | 0 | -100,00 | 0 | |||||
| 2026-02-09 | 13F | Glenview Trust Co | 10.650 | 0,00 | 99 | 4,26 | ||||
| 2026-02-09 | 13F | Delta Asset Management Llc/tn | 943 | 0,00 | 9 | 0,00 | ||||
| 2026-02-13 | 13F | Stifel Financial Corp | 50.957 | -7,01 | 472 | -3,08 | ||||
| 2026-02-13 | 13F | Dynamic Technology Lab Private Ltd | 0 | -100,00 | 0 | |||||
| 2026-04-09 | 13F | Teamwork Financial Advisors, LLC | 0 | -100,00 | 0 | |||||
| 2026-02-17 | 13F | Aquatic Capital Management LLC | 19.921 | 185 | ||||||
| 2026-02-02 | 13F | Miracle Mile Advisors, LLC | 0 | -100,00 | 0 | |||||
| 2026-01-14 | 13F | ORG Partners LLC | 1.500 | 0,00 | 14 | 0,00 | ||||
| 2026-02-17 | 13F | Susquehanna International Group, Llp | Put | 35.900 | 333 | |||||
| 2026-02-17 | 13F | Susquehanna International Group, Llp | Call | 36.600 | 339 | |||||
| 2026-04-10 | 13F | Naviter Wealth, LLC | 78.217 | 276,66 | 636 | 227,84 | ||||
| 2026-04-20 | 13F | Hilton Head Capital Partners, LLC | 230 | 2 | ||||||
| 2026-01-30 | 13F | Sigma Planning Corp | 10.495 | 0,00 | 97 | 4,30 | ||||
| 2026-02-10 | 13F | Lido Advisors, LLC | 12.114 | 0,00 | 109 | 0,00 | ||||
| 2026-02-17 | 13F | Susquehanna International Group, Llp | 10.822 | -83,22 | 100 | -82,55 | ||||
| 2026-02-11 | 13F | Cerity Partners LLC | 82.010 | 760 | ||||||
| 2025-11-13 | 13F | Entropy Technologies, LP | 0 | -100,00 | 0 | |||||
| 2026-01-26 | 13F | AE Wealth Management LLC | 22.118 | 1,49 | 205 | 6,22 | ||||
| 2026-01-26 | 13F | Cwm, Llc | 7.382 | 37,44 | 0 | |||||
| 2026-02-04 | 13F | Atlantic Union Bankshares Corp | 1.200 | -55,56 | 11 | -54,17 | ||||
| 2026-01-30 | 13F | Us Bancorp \de\ | 4.000 | 0,00 | 37 | 5,71 | ||||
| 2026-02-11 | 13F | Closed-End Fund Advisors, Inc. | 30.683 | 284 | ||||||
| 2026-04-22 | 13F | Harbor Asset Planning, Inc. | 0 | -100,00 | 0 | |||||
| 2026-02-13 | 13F | Kestra Advisory Services, LLC | 0 | -100,00 | 0 | |||||
| 2026-02-10 | 13F | Goldman Sachs Group Inc | 35.158 | 9,09 | 326 | 13,64 | ||||
| 2026-04-17 | 13F | Vermillion Wealth Management, Inc. | 500 | 0,00 | 4 | 0,00 | ||||
| 2026-04-23 | 13F | GraniteShares Advisors LLC | 262.767 | -10,27 | 2.113 | -22,18 | ||||
| 2026-01-28 | 13F | SP Asset Management LLC | 0 | -100,00 | 0 | |||||
| 2026-02-17 | 13F | Bank Of America Corp /de/ | 67.997 | 152,83 | 630 | 163,60 | ||||
| 2026-04-21 | 13F | PharVision Advisers, LLC | 0 | -100,00 | 0 | |||||
| 2026-02-11 | 13F | Jpmorgan Chase & Co | 4.267 | -53,55 | 40 | -51,85 | ||||
| 2026-04-07 | 13F | Farther Finance Advisors, LLC | 8.087 | 37,39 | 65 | 18,52 | ||||
| 2026-04-16 | 13F | PMV Capital Advisers, LLC | 12 | 0 | ||||||
| 2026-02-13 | 13F | Mariner, LLC | 11.201 | -63,69 | 104 | -62,41 | ||||
| 2026-02-05 | 13F | Allworth Financial LP | 69 | -97,51 | 1 | -100,00 | ||||
| 2026-02-13 | 13F | Resources Investment Advisors, LLC. | 0 | -100,00 | 0 | |||||
| 2026-04-15 | 13F | FNY Investment Advisers, LLC | 1.200 | 0,00 | 0 | |||||
| 2026-02-17 | 13F | XTX Topco Ltd | 180.640 | 1.675 | ||||||
| 2025-11-12 | 13F | Simplex Trading, Llc | 0 | -100,00 | 0 | |||||
| 2026-01-30 | 13F | Camden Capital, LLC | 26.658 | 0,00 | 247 | 4,66 | ||||
| 2026-02-17 | 13F | VARCOV Co. | 100.078 | 928 | ||||||
| 2026-04-09 | 13F | Nelson, Van Denburg & Campbell Wealth Management Group, LLC | 20.751 | 167 | ||||||
| 2026-02-17 | 13F | Tower Research Capital LLC (TRC) | 0 | -100,00 | 0 | |||||
| 2026-02-13 | 13F | Quarry LP | 1.181 | -70,72 | 11 | -71,43 | ||||
| 2026-02-13 | 13F | Marshall Wace, Llp | 771.048 | 7.148 | ||||||
| 2026-02-17 | 13F | Citadel Advisors Llc | Put | 22.200 | -31,69 | 206 | -28,82 | |||
| 2026-04-22 | 13F | Janney Montgomery Scott LLC | 41.802 | 4,14 | 0 | |||||
| 2026-02-13 | 13F | Great West Life Assurance Co /can/ | 125.122 | 3,91 | 1 | 0,00 | ||||
| 2026-04-20 | 13F | Sowell Financial Services LLC | 11.801 | -12,00 | 95 | -24,19 | ||||
| 2026-02-05 | 13F | Cambridge Investment Research Advisors, Inc. | 81.314 | 6,75 | 1 | |||||
| 2026-02-17 | 13F | Advisor Group Holdings, Inc. | 208.639 | 25,93 | 1.934 | 18,65 | ||||
| 2026-02-13 | 13F | Wells Fargo & Company/mn | 151.558 | 160,68 | 1.405 | 172,09 | ||||
| 2026-02-10 | 13F | Envestnet Asset Management Inc | 45.578 | 11,95 | 423 | 16,90 | ||||
| 2026-02-17 | 13F | Northern Trust Corp | 45.286 | -8,87 | 420 | -4,99 | ||||
| 2025-11-14 | 13F | Two Sigma Advisers, Lp | 0 | -100,00 | 0 | |||||
| 2026-04-16 | 13F | BCO Wealth Management LLC | 12.019 | 2,67 | 97 | -11,11 | ||||
| 2025-10-31 | 13F | Y-Intercept (Hong Kong) Ltd | 0 | -100,00 | 0 | |||||
| 2025-11-14 | 13F | ExodusPoint Capital Management, LP | 0 | -100,00 | 0 | |||||
| 2026-02-17 | 13F | Virtus Investment Advisers, Inc. | 79.701 | -14,16 | 739 | -10,55 | ||||
| 2026-02-03 | 13F | Vantage Financial Partners, LLC | 38.499 | 0,00 | 357 | 4,09 | ||||
| 2026-02-06 | 13F | Global Retirement Partners, LLC | 2.576 | -50,35 | 24 | -50,00 | ||||
| 2026-02-10 | 13F/A | Northwestern Mutual Wealth Management Co | 4.000 | 0,00 | 37 | 5,71 | ||||
| 2026-02-13 | 13F | Squarepoint Ops LLC | 0 | -100,00 | 0 | |||||
| 2025-11-12 | 13F | Creekmur Asset Management LLC | 9 | 0,00 | 0 | |||||
| 2026-02-03 | 13F | McIlrath & Eck, LLC | 1.687 | 16 | ||||||
| 2026-02-06 | 13F | Larson Financial Group LLC | 544 | 3,42 | 5 | 25,00 | ||||
| 2026-04-27 | 13F | PFG Investments, LLC | 140.523 | 13,78 | 1.130 | -1,31 | ||||
| 2026-02-18 | 13F/A | Empowered Funds, LLC | 0 | -100,00 | 0 | -100,00 | ||||
| 2026-02-17 | 13F | Beacon Investment Advisors Llc | 20.916 | 14,20 | 194 | 19,14 | ||||
| 2026-02-04 | 13F | First Foundation Advisors | 0 | -100,00 | 0 | |||||
| 2026-02-17 | 13F | Nomura Holdings Inc | 19.887 | 184 | ||||||
| 2026-02-12 | 13F | Jane Street Group, Llc | 217.228 | 28,30 | 2.014 | 33,75 | ||||
| 2026-02-12 | 13F | Jane Street Group, Llc | Call | 46.800 | 434 | |||||
| 2026-02-09 | 13F | Strategic Financial Concepts, LLC | 0 | -100,00 | 0 | |||||
| 2026-04-20 | 13F | Ronald Blue Trust, Inc. | 0 | -100,00 | 0 | |||||
| 2026-02-04 | 13F | Bridgewealth Advisory Group, LLC | 12.035 | 112 | ||||||
| 2026-04-17 | 13F | Murphy & Mullick Capital Management Corp | 1.038 | 3,70 | 8 | -11,11 | ||||
| 2026-01-30 | 13F/A | M&t Bank Corp | 21.899 | 0,00 | 203 | 4,64 | ||||
| 2026-02-10 | 13F | Foundations Investment Advisors, LLC | 21.201 | 7,87 | 197 | 12,64 | ||||
| 2026-04-27 | 13F | Sound Income Strategies, LLC | 4.940.809 | 6,39 | 39.576 | -10,58 | ||||
| 2026-02-17 | 13F | Millennium Management Llc | 690.051 | 1,37 | 6.397 | 5,70 | ||||
| 2026-02-17 | 13F | Royal Bank Of Canada | 22.053 | -12,93 | 204 | -9,33 | ||||
| 2026-02-19 | 13F | CI Private Wealth, LLC | 12.861 | -79,21 | 117 | -78,87 | ||||
| 2026-02-17 | 13F | Brevan Howard Capital Management LP | 29.723 | -77,61 | 276 | -76,69 | ||||
| 2026-02-12 | 13F | Advisors Asset Management, Inc. | 344.109 | -2,24 | 3.190 | 1,92 | ||||
| 2026-02-17 | 13F | Cetera Investment Advisers | 68.278 | -9,64 | 633 | -5,81 | ||||
| 2026-04-20 | 13F | State of Alaska, Department of Revenue | 4.625 | 0,00 | 0 | |||||
| 2026-02-17 | 13F | Trexquant Investment LP | 223.878 | -9,98 | 2.075 | -6,11 | ||||
| 2025-11-14 | 13F | Wolverine Trading, Llc | Call | 15.900 | 142 | |||||
| 2026-02-17 | 13F | Ameriprise Financial Inc | 0 | -100,00 | 0 | |||||
| 2026-04-17 | 13F | Andina Capital Management, LLC | 46.947 | 377 | ||||||
| 2026-01-27 | 13F | PFG Advisors | 98.057 | -10,96 | 909 | -7,25 | ||||
| 2026-02-17 | 13F | Oxford Asset Management Llp | 45.382 | -5,84 | 421 | -1,87 | ||||
| 2026-04-24 | 13F | Root Financial Partners, LLC | 500 | 4 | ||||||
| 2026-02-17 | 13F | Schonfeld Strategic Advisors LLC | 16.088 | 149 | ||||||
| 2026-04-27 | 13F | Fulton Breakefield Broenniman Llc | 11.798 | 0,00 | 95 | -13,76 | ||||
| 2026-02-13 | 13F | Morgan Stanley | 577.124 | -10,20 | 5.350 | -6,37 | ||||
| 2026-01-07 | 13F | Aventura Private Wealth, LLC | 801 | 3,35 | 7 | 16,67 | ||||
| 2026-01-23 | 13F | Freestone Capital Holdings, LLC | 27.045 | 251 | ||||||
| 2026-02-17 | 13F | VestGen Advisors, LLC | 14.500 | -17,14 | 134 | -13,55 | ||||
| 2026-02-18 | 13F | Garton & Associates Financial Advisors LLC | 2.552 | 24 | ||||||
| 2026-02-10 | 13F | Investment Partners, Ltd. | 10.000 | 0,00 | 93 | 4,55 | ||||
| 2026-04-23 | 13F | Muzinich & Co., Inc. | 171.904 | 0,63 | 1.382 | -12,70 | ||||
| 2026-02-13 | 13F | Caitong International Asset Management Co., Ltd | 1 | 0 | ||||||
| 2026-02-04 | 13F | Hallmark Capital Management Inc | 0 | -100,00 | 0 | |||||
| 2025-11-14 | 13F | Balyasny Asset Management Llc | 0 | -100,00 | 0 | |||||
| 2026-02-13 | 13F/A | Virtus ETF Advisers LLC | 0 | -100,00 | 0 | |||||
| 2026-02-12 | 13F | Triumph Capital Management | 1.600 | -23,81 | 15 | -22,22 | ||||
| 2026-04-28 | 13F | Golden State Wealth Management, LLC | 9.852 | 0,98 | 79 | -12,22 | ||||
| 2026-02-03 | 13F | Denali Advisors Llc | 48.547 | -17,01 | 450 | -13,46 | ||||
| 2026-02-17 | 13F | Quadrature Capital Ltd | 0 | -100,00 | 0 | |||||
| 2026-02-17 | 13F | Hbk Investments L P | Put | 292.700 | 2.713 | |||||
| 2026-02-17 | 13F | Qube Research & Technologies Ltd | 518.749 | -52,58 | 4.809 | -50,56 | ||||
| 2026-02-06 | 13F | EverSource Wealth Advisors, LLC | 10.001 | 496,01 | 93 | 557,14 | ||||
| 2026-02-13 | 13F | Strategies Wealth Advisors, LLC | 13.763 | 3,42 | 128 | 7,63 | ||||
| 2026-02-17 | 13F | Raymond James Financial Inc | 18.586 | -28,43 | 172 | -25,22 | ||||
| 2026-04-15 | 13F | PW Nova Financial Services LLC | 21.547 | 90,53 | 173 | 63,21 | ||||
| 2026-02-17 | 13F | Jump Financial, LLC | 34.519 | 320 | ||||||
| 2025-12-02 | 13F | IFP Advisors, Inc | 0 | -100,00 | 0 | |||||
| 2026-02-12 | 13F | BlackRock, Inc. | 681.881 | -0,77 | 6.321 | 3,49 | ||||
| 2026-02-13 | 13F | Truffle Hound Capital, LLC | 600.000 | 5.562 | ||||||
| 2026-01-29 | 13F | UBS Group AG | 1.367.442 | 5,51 | 12.676 | 10,02 | ||||
| 2026-02-06 | 13F | Synergy Investment Management, LLC | 0 | -100,00 | 0 | |||||
| 2026-01-23 | 13F | Sage Mountain Advisors LLC | 10.000 | 0,00 | 93 | 4,55 | ||||
| 2026-02-02 | 13F | Truist Financial Corp | 0 | -100,00 | 0 | |||||
| 2026-04-22 | 13F | Yelin Lapidot Holdings Management Ltd. | 74.427 | 0,00 | 598 | -13,21 | ||||
| 2026-02-17 | 13F | Guggenheim Capital Llc | 59.147 | 7,96 | 548 | 12,53 | ||||
| 2026-02-17 | 13F | Advisory Services Network, LLC | 0 | -100,00 | 0 | |||||
| 2026-02-19 | 13F | Invesco Ltd. | 1.222.697 | -3,18 | 11.334 | 0,95 | ||||
| 2025-11-14 | 13F | DRW Securities, LLC | 0 | -100,00 | 0 | -100,00 | ||||
| 2026-02-13 | 13F | Natixis | 0 | -100,00 | 0 | |||||
| 2026-02-09 | 13F | Legal & General Group Plc | 687.570 | 13,96 | 6.377 | 18,97 | ||||
| 2025-11-13 | 13F | Change Path, LLC | 0 | -100,00 | 0 | |||||
| 2026-02-17 | 13F | Altshuler Shaham Ltd | 1.320.156 | 44,12 | 12.238 | 50,28 | ||||
| 2026-02-18 | 13F | GWM Advisors LLC | 4.714 | 0,00 | 44 | 4,88 | ||||
| 2026-01-12 | 13F | AllSquare Wealth Management LLC | 9.200 | 0,00 | 82 | -14,74 | ||||
| 2026-02-06 | 13F | HighTower Advisors, LLC | 71.205 | -3,71 | 660 | 0,46 | ||||
| 2026-02-17 | 13F | Two Sigma Investments, Lp | 397.063 | -5,09 | 3.681 | -1,05 | ||||
| 2026-02-13 | 13F | Hudson Bay Capital Management LP | 0 | -100,00 | 0 | |||||
| 2026-02-17 | 13F | CastleKnight Management LP | 79.100 | 733 | ||||||
| 2026-01-20 | 13F | Sovran Advisors, LLC | 36.464 | 3,37 | 354 | 10,97 | ||||
| 2026-02-12 | 13F | BRYN MAWR TRUST Co | 3.363 | 0,00 | 31 | 6,90 | ||||
| 2026-04-14 | 13F | Nbc Securities, Inc. | 546 | 70,62 | 4 | 100,00 | ||||
| 2026-02-13 | 13F | Citigroup Inc | 4.663 | -90,42 | 43 | -90,05 | ||||
| 2026-02-11 | 13F | Group One Trading, L.p. | Call | 0 | -100,00 | 0 | ||||
| 2026-02-12 | 13F | Commonwealth Equity Services, Llc | 44.522 | -54,78 | 413 | |||||
| 2026-02-10 | 13F | Quantbot Technologies LP | 40.986 | 71,27 | 380 | 78,77 | ||||
| 2026-02-13 | 13F | Financial Network Wealth Advisors LLC | 1.426 | 0,00 | 13 | 8,33 | ||||
| 2026-02-13 | 13F | Van Eck Associates Corp | 2.331.159 | -7,98 | 22 | -4,55 | ||||
| 2026-02-20 | 13F | Sunbelt Securities, Inc. | 15.729 | 0,48 | 146 | 4,32 | ||||
| 2026-04-02 | 13F | Hilltop National Bank | 191 | 2 | ||||||
| 2026-02-17 | 13F | Citadel Advisors Llc | Call | 0 | -100,00 | 0 | ||||
| 2026-02-25 | 13F | Kw Wealth Management Llc | 13.002 | 1,25 | 121 | 5,26 | ||||
| 2026-02-03 | 13F | NewEdge Wealth, LLC | 171.744 | -36,66 | 1.592 | -35,88 | ||||
| 2026-02-09 | 13F | MQS Management LLC | 0 | -100,00 | 0 | |||||
| 2026-04-21 | 13F | Wedbush Securities Inc | 32.962 | -16,05 | 0 | |||||
| 2026-04-24 | 13F | Private Advisor Group, LLC | 14.204 | 8,48 | 114 | -5,79 | ||||
| 2026-02-11 | 13F | Simplex Trading, Llc | Put | 0 | -100,00 | 0 | ||||
| 2026-02-13 | 13F | Pin Oak Investment Advisors Inc | 1.146 | 0,00 | 0 | -100,00 | ||||
| 2026-02-13 | 13F | MAI Capital Management | 70 | -97,88 | 1 | -100,00 | ||||
| 2026-02-03 | 13F | International Assets Investment Management, Llc | 3.580 | 33 | ||||||
| 2026-01-20 | 13F | Ethos Financial Group, LLC | 21.308 | 7,87 | 198 | 12,57 | ||||
| 2026-02-11 | 13F | Simplex Trading, Llc | Call | 0 | -100,00 | 0 | ||||
| 2026-02-10 | 13F | Calton & Associates, Inc. | 13.501 | 19,30 | 125 | 25,00 | ||||
| 2026-01-22 | 13F | Westbourne Investments, Inc. | 10.500 | -53,76 | 101 | -51,21 | ||||
| 2026-02-18 | 13F | EP Wealth Advisors, Inc. | 14.461 | 134 | ||||||
| 2025-11-12 | 13F | Group One Trading, L.p. | 0 | -100,00 | 0 |
Other Listings
| US:PFLT | 8,78 $ |