Grundlæggende statistik
| Institutionelle aktier (lange) | 158.148.320 - 35,27% (ex 13D/G) - change of -43,60MM shares -21,61% MRQ |
| Institutionel værdi (lang) | $ 3.084.106 USD ($1000) |
Institutionelt ejerskab og aktionærer
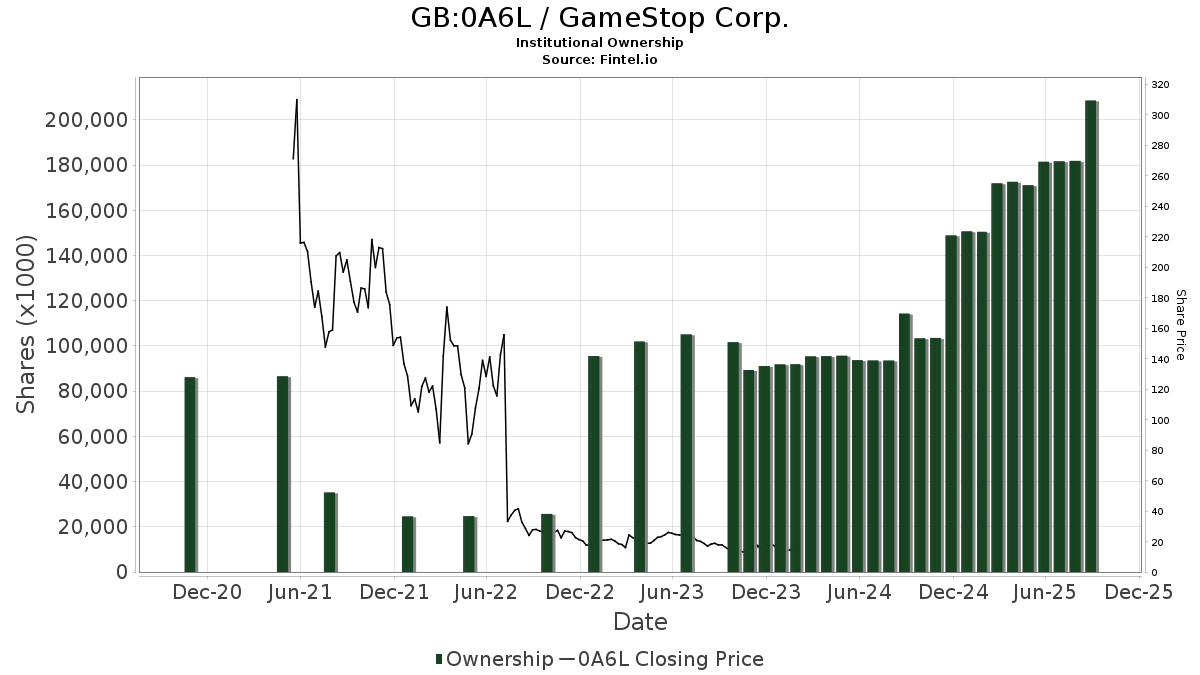
GameStop Corp. (GB:0A6L) har 382 institutionelle ejere og aktionærer, der har indsendt 13D/G- eller 13F-formularer til Securities Exchange Commission (SEC). Disse institutioner har i alt 158,148,320 aktier. Største aktionærer omfatter Vanguard Group Inc, BlackRock, Inc., LMR Partners LLP, Susquehanna International Group, Llp, State Street Corp, Citadel Advisors Llc, Susquehanna International Group, Llp, Jane Street Group, Llc, Geode Capital Management, Llc, and Point72 Asset Management, L.P. .
GameStop Corp. (LSE:0A6L) institutionel ejerskabsstruktur viser aktuelle positioner i virksomheden efter institutioner og fonde, samt seneste ændringer i positionsstørrelse. Større aktionærer kan omfatte individuelle investorer, investeringsforeninger, hedgefonde eller institutioner. Skema 13D angiver, at investoren besidder (eller besidder) mere end 5 % af virksomheden og har til hensigt (eller har til hensigt at) aktivt at forfølge en ændring i forretningsstrategi. Skema 13G indikerer en passiv investering på over 5%.
The share price as of April 16, 2026 is 24,78 / share. Previously, on April 28, 2025, the share price was 26,99 / share. This represents a decline of 8,21% over that period.
Fondens stemningsscore
Fund Sentiment Score (fka Ownership Accumulation Score) finder de aktier, der bliver mest købt af fonde. Det er resultatet af en sofistikeret, multi-faktor kvantitativ model, der identificerer virksomheder med de højeste niveauer af institutionel akkumulering. Scoringsmodellen bruger en kombination af den samlede stigning i oplyste ejere, ændringerne i porteføljeallokeringer i disse ejere og andre målinger. Tallet går fra 0 til 100, hvor højere tal indikerer et højere niveau af akkumulering for sine jævnaldrende, og 50 er gennemsnittet.
Opdateringsfrekvens: Dagligt
Se Ownership Explorer, som giver en liste over højest rangerende virksomheder.
AI+ Ask Fintel’s AI assistant about GameStop Corp..
Select a question to share a public post with an AI-crafted answer.
Thinking of good questions…
13F og NPORT arkivering
Detaljer om 13F-arkivering er gratis. Detaljer om NP-ansøgninger kræver et premium-medlemskab. Grønne rækker angiver nye positioner. Røde rækker angiver lukkede positioner. Klik på linket ikon for at se den fulde transaktionshistorik.
Opgrader
for at låse premium-data op og eksportere til Excel ![]() .
.
| Fil dato | Kilde | Investor | Type | Gennemsnitlig pris (Øst) |
Aktier | Δ Aktier (%) |
Rapporteret Værdi ($1000) |
Δ Værdi (%) |
Port Alloc (%) |
|
|---|---|---|---|---|---|---|---|---|---|---|
| 2026-02-12 | 13F | Jane Street Group, Llc | Call | 7.992.200 | 226,65 | 160.483 | 140,44 | |||
| 2026-02-23 | 13F | Virtu Financial LLC | 86.926 | 2 | ||||||
| 2026-02-12 | 13F | Jane Street Group, Llc | 390.569 | -90,28 | 7.843 | -92,85 | ||||
| 2026-02-12 | 13F | Jane Street Group, Llc | Put | 1.841.400 | 8,25 | 36.975 | -20,32 | |||
| 2026-02-11 | 13F | Simplex Trading, Llc | Put | 1.462.200 | -10,75 | 18.007 | 40.825,00 | |||
| 2025-11-14 | 13F | Mount Yale Investment Advisors, LLC | 0 | -100,00 | 0 | -100,00 | ||||
| 2026-02-11 | 13F | Simplex Trading, Llc | Call | 5.387.500 | 21,11 | 68.667 | 56.648,76 | |||
| 2026-02-11 | 13F | Parallel Advisors, LLC | 255 | -3,77 | 5 | -28,57 | ||||
| 2026-02-10 | 13F | Goldman Sachs Group Inc | Call | 0 | -100,00 | 0 | -100,00 | |||
| 2026-02-11 | 13F | T3 Companies, LLC | Call | 13.600 | 1 | |||||
| 2026-02-10 | 13F | Norges Bank | 3.994.957 | 80.219 | ||||||
| 2026-02-11 | 13F | T3 Companies, LLC | 29.974 | 602 | ||||||
| 2026-02-13 | 13F | Pathstone Holdings, LLC | 0 | -100,00 | 0 | -100,00 | ||||
| 2026-02-17 | 13F | Old Mission Capital Llc | Put | 0 | -100,00 | 0 | -100,00 | |||
| 2026-01-30 | 13F | Bogart Wealth, LLC | 6.000 | 20,00 | 120 | -11,76 | ||||
| 2026-04-17 | 13F | Vermillion Wealth Management, Inc. | 23 | 1 | ||||||
| 2026-02-13 | 13F | Public Employees Retirement Association Of Colorado | 33.879 | 0,00 | 1 | |||||
| 2026-03-12 | 13F/A | Peak6 Llc | Put | 35.400 | -19,55 | 711 | -40,83 | |||
| 2026-03-12 | 13F/A | Peak6 Llc | Call | 396.800 | -43,23 | 7.968 | -58,21 | |||
| 2026-02-17 | 13F | Equitec Proprietary Markets, Llc | 6.225 | -27,83 | 125 | -47,23 | ||||
| 2026-02-17 | 13F | Maryland State Retirement & Pension System | 20.337 | 0,00 | 408 | -26,35 | ||||
| 2026-02-17 | 13F | Bayesian Capital Management, LP | 0 | -100,00 | 0 | -100,00 | ||||
| 2026-02-11 | 13F | Winton Capital Group Ltd | 17.900 | 359 | ||||||
| 2026-02-04 | 13F | Ameritas Advisory Services, LLC | 0 | -100,00 | 0 | -100,00 | ||||
| 2026-02-13 | 13F | BNP Paribas Asset Management Holding S.A. | 5.924 | 41,22 | 0 | |||||
| 2026-02-13 | 13F | Gts Securities Llc | 17.313 | 348 | ||||||
| 2026-02-13 | 13F | Fairbanks Capital Management, Inc. | 73.769 | 0,00 | 1.481 | -26,39 | ||||
| 2026-01-30 | 13F | New York State Teachers Retirement System | 311.964 | -1,46 | 6 | -25,00 | ||||
| 2026-02-19 | 13F | Mcguire Capital Advisors Inc | 6 | 0 | ||||||
| 2026-02-17 | 13F | Amundi | 31.864 | 640 | ||||||
| 2026-02-06 | 13F | Handelsbanken Fonder AB | 123.000 | 6,31 | 2 | -33,33 | ||||
| 2026-02-17 | 13F | Old Mission Capital Llc | Call | 0 | -100,00 | 0 | -100,00 | |||
| 2026-02-17 | 13F | Strive Financial Group ,LLC | 11 | 0 | ||||||
| 2026-02-04 | 13F | Virginia Retirement Systems Et Al | 78.290 | 2,76 | 1.572 | -24,35 | ||||
| 2026-02-11 | 13F | Rise Advisors, LLC | 0 | -100,00 | 0 | -100,00 | ||||
| 2025-11-14 | 13F | Strategic Wealth Partners, Ltd. | 184 | 0,00 | 5 | 25,00 | ||||
| 2026-02-17 | 13F | Blair William & Co/il | 0 | -100,00 | 0 | -100,00 | ||||
| 2026-02-12 | 13F | Cibc World Markets Corp | Put | 265.000 | 5.321 | |||||
| 2026-04-20 | 13F | State of Alaska, Department of Revenue | 41.166 | 0,77 | 1 | |||||
| 2026-02-03 | 13F | Crossmark Global Holdings, Inc. | 21.216 | -2,85 | 426 | -28,40 | ||||
| 2026-04-15 | 13F | Financial Management Professionals, Inc. | 7 | 0 | ||||||
| 2026-04-23 | 13F | Private Wealth Management Group, LLC | 93 | -2,11 | 2 | 100,00 | ||||
| 2026-02-17 | 13F | D. E. Shaw & Co., Inc. | 207.956 | -76,39 | 4.176 | -82,62 | ||||
| 2026-01-13 | 13F | Scratch Capital Llc | 25.153 | 0,00 | 505 | -26,38 | ||||
| 2026-02-13 | 13F | Citigroup Inc | Call | 1.500 | 0,00 | 30 | -25,00 | |||
| 2026-02-18 | 13F | State of Tennessee, Treasury Department | 157.881 | -4,11 | 3.770 | -16,05 | ||||
| 2026-02-13 | 13F | Manufacturers Life Insurance Company, The | 301.958 | -2,09 | 6.063 | -27,93 | ||||
| 2026-02-13 | 13F | Citigroup Inc | 61.060 | -32,57 | 1.226 | -50,36 | ||||
| 2026-02-17 | 13F | Clear Street Markets Llc | Call | 0 | -100,00 | 0 | -100,00 | |||
| 2026-01-29 | 13F | State Of Michigan Retirement System | 97.400 | -0,61 | 1.956 | -26,86 | ||||
| 2026-02-10 | 13F | Sittner & Nelson, Llc | 840 | -5,62 | 21 | -16,67 | ||||
| 2026-02-13 | 13F | DLD Asset Management, LP | Put | 0 | -100,00 | 0 | -100,00 | |||
| 2026-01-15 | 13F | Fifth Third Wealth Advisors LLC | 0 | -100,00 | 0 | -100,00 | ||||
| 2026-04-13 | 13F | Hm Payson & Co | 50 | 0,00 | 1 | 0,00 | ||||
| 2026-02-17 | 13F | Agf Management Ltd | 148.746 | 1,14 | 2.987 | -25,57 | ||||
| 2026-01-28 | 13F | Universal- Beteiligungs- und Servicegesellschaft mbH | 86.122 | 1,82 | 1.729 | -25,05 | ||||
| 2026-02-19 | 13F | Invesco Ltd. | 3.672.741 | -9,73 | 73.749 | -33,55 | ||||
| 2026-02-13 | 13F | Barclays Plc | Call | 850.000 | 1,74 | 17.068 | -25,11 | |||
| 2026-04-02 | 13F | Ares Financial Consulting, LLC | 150 | 0,00 | 3 | 0,00 | ||||
| 2026-02-13 | 13F | Barclays Plc | 264.754 | -29,04 | 5.316 | -47,77 | ||||
| 2026-02-17 | 13F | Dv Equities, Llc | 700 | 14 | ||||||
| 2026-04-23 | 13F | Farmers & Merchants Investments Inc | 335 | 4,69 | 8 | 16,67 | ||||
| 2026-02-10 | 13F | Principia Wealth Advisory, LLC | 12 | 33,33 | 0 | |||||
| 2026-02-17 | 13F | Citadel Advisors Llc | 295.308 | 136,04 | 5.930 | 73,72 | ||||
| 2026-02-12 | 13F | BlackRock, Inc. | 35.280.269 | -0,26 | 708.428 | -26,59 | ||||
| 2026-02-17 | 13F | Citadel Advisors Llc | Call | 12.110.400 | 10,33 | 243.177 | -18,79 | |||
| 2026-04-06 | 13F | GAMMA Investing LLC | 9.469 | 34,75 | 218 | 54,61 | ||||
| 2026-02-17 | 13F | Capstone Investment Advisors, Llc | Put | 0 | -100,00 | 0 | -100,00 | |||
| 2026-02-17 | 13F | Citadel Advisors Llc | Put | 5.526.000 | 44,89 | 110.962 | 6,65 | |||
| 2025-11-14 | 13F | Ilex Capital Partners (UK) LLP | 0 | -100,00 | 0 | -100,00 | ||||
| 2026-02-05 | 13F | Amalgamated Bank | 184.320 | -2,00 | 4 | -40,00 | ||||
| 2025-11-14 | 13F | Balyasny Asset Management Llc | Call | 0 | -100,00 | 0 | -100,00 | |||
| 2026-03-12 | 13F | Nalls Sherbakoff Group, Llc | 0 | 0 | ||||||
| 2025-11-04 | 13F | State of Wyoming | 0 | -100,00 | 0 | -100,00 | ||||
| 2026-04-21 | 13F | SLT Holdings LLC | 34.813 | -4,13 | 802 | 10,01 | ||||
| 2026-02-17 | 13F | Lazard Asset Management Llc | 39.946 | 274,03 | 802 | 175,60 | ||||
| 2026-02-10 | 13F | Rothschild Investment Llc | 27 | 237,50 | 1 | |||||
| 2026-02-10 | 13F | CIBC Asset Management Inc | 13.783 | 43,48 | 277 | 5,34 | ||||
| 2026-02-12 | 13F | Brown Brothers Harriman & Co | 120 | 0,00 | 2 | -33,33 | ||||
| 2026-02-06 | 13F | Leonteq Securities AG | Call | 30.000 | 0,00 | 602 | -26,41 | |||
| 2026-02-17 | 13F | SageView Advisory Group, LLC | 10.040 | -56,42 | 202 | -67,99 | ||||
| 2026-02-06 | 13F | Leonteq Securities AG | 55 | 0,00 | 1 | 0,00 | ||||
| 2026-02-13 | 13F | Centerpoint Advisors, LLC | 1.360 | 0,00 | 0 | |||||
| 2026-02-17 | 13F | Banco Bilbao Vizcaya Argentaria, S.a. | 0 | -100,00 | 0 | -100,00 | ||||
| 2026-01-29 | 13F | Sanctuary Advisors, LLC | 0 | -100,00 | 0 | -100,00 | ||||
| 2026-02-13 | 13F | Great West Life Assurance Co /can/ | 235.714 | -20,85 | 5 | -50,00 | ||||
| 2026-02-06 | 13F | ProShare Advisors LLC | 16.525 | -5,59 | 332 | -30,61 | ||||
| 2025-11-14 | 13F | Point72 Asia (Singapore) Pte. Ltd. | 8.859 | 242 | ||||||
| 2025-11-14 | 13F | Tudor Investment Corp Et Al | 100.255 | |||||||
| 2026-04-15 | 13F | FNY Investment Advisers, LLC | Call | 5 | 0 | |||||
| 2026-02-17 | 13F | Shelton Capital Management | 13.927 | 52,64 | 280 | 12,50 | ||||
| 2026-02-13 | 13F | Kilter Group LLC | 20 | 0,00 | 0 | |||||
| 2026-01-26 | 13F | Cwm, Llc | 2.117 | -7,31 | 0 | |||||
| 2026-02-17 | 13F | Tower Research Capital LLC (TRC) | 18.235 | 10,08 | 366 | -18,85 | ||||
| 2026-02-12 | 13F | Cibc World Markets Corp | Call | 30.000 | 602 | |||||
| 2026-02-17 | 13F | Philosophy Capital Management LLC | 950.000 | 19.076 | ||||||
| 2026-02-17 | 13F | Sig Brokerage, Lp | Call | 25.000 | -37,50 | 502 | -53,99 | |||
| 2026-02-12 | 13F | South Dakota Investment Council | 83.709 | 8,98 | 2 | -50,00 | ||||
| 2025-11-06 | 13F | Warberg Asset Management LLC | Call | 0 | -100,00 | 0 | -100,00 | |||
| 2025-10-28 | 13F | First National Corp /ma/ /adv | 46.650 | 0,05 | 1.292 | 13,54 | ||||
| 2026-04-24 | 13F | Strs Ohio | 9.801 | -0,14 | 226 | 14,21 | ||||
| 2026-02-02 | 13F | Wolverine Asset Management Llc | Put | 2.112.700 | -0,00 | 42.423 | -26,40 | |||
| 2026-02-12 | 13F | State Board Of Administration Of Florida Retirement System | 326.592 | -1,89 | 6.558 | -27,79 | ||||
| 2026-02-12 | 13F | Quadrant Capital Group Llc | 2.126 | 0,38 | 43 | -26,32 | ||||
| 2026-02-17 | 13F | Brevan Howard Capital Management LP | 138.721 | 2.806 | ||||||
| 2026-02-13 | 13F | Truvestments Capital Llc | 16 | 0 | ||||||
| 2026-02-13 | 13F | Sofos Investments, Inc. | 1.600 | -0,93 | 32 | -27,27 | ||||
| 2026-04-23 | 13F | Glass Jacobson Investment Advisors llc | 0 | -100,00 | 0 | |||||
| 2026-01-26 | 13F | KBC Group NV | 11.535 | 0,00 | 0 | |||||
| 2026-01-28 | 13F | Teacher Retirement System Of Texas | 39.729 | -43,73 | 798 | -58,60 | ||||
| 2026-04-01 | 13F | Bangor Savings Bank | 780 | 11,43 | 18 | 21,43 | ||||
| 2026-02-12 | 13F | Bank Of Montreal /can/ | Call | 0 | -100,00 | 0 | -100,00 | |||
| 2026-02-09 | 13F | Hantz Financial Services, Inc. | 7.368 | -9,72 | 0 | |||||
| 2026-02-17 | 13F | Engineers Gate Manager LP | 20.304 | 408 | ||||||
| 2026-04-20 | 13F/A | OP Asset Management Ltd | 0 | 0 | ||||||
| 2026-02-13 | 13F | First Trust Advisors Lp | 40.694 | 323,59 | 817 | 211,83 | ||||
| 2025-11-14 | 13F | Man Group plc | 0 | -100,00 | 0 | |||||
| 2026-02-13 | 13F | American Century Companies Inc | 38.971 | 4,24 | 783 | -23,26 | ||||
| 2026-02-17 | 13F/A | BlueCrest Capital Management Ltd | 0 | -100,00 | 0 | -100,00 | ||||
| 2026-02-09 | 13F | Geode Capital Management, Llc | 7.340.631 | 1,28 | 147.431 | -25,45 | ||||
| 2026-02-09 | 13F | Hartland & Co., LLC | 1.547 | 138,00 | 31 | 82,35 | ||||
| 2026-02-13 | 13F | Bank Of Nova Scotia | 19.907 | 9,95 | 400 | -19,07 | ||||
| 2026-04-21 | 13F | Financial Consulate, Inc | 24 | 0,00 | 1 | |||||
| 2026-02-04 | 13F | Swiss Life Asset Management Ltd | 19.832 | 1,10 | 398 | -25,61 | ||||
| 2026-02-10 | 13F | REAP Financial Group, LLC | 120 | 0,00 | 2 | -33,33 | ||||
| 2026-04-17 | 13F | Signal Advisors Wealth, LLC | 63.056 | 1,16 | 1.453 | 16,07 | ||||
| 2026-02-13 | 13F | Clear Street Group Inc. | 846.457 | -22,96 | 16.997 | -43,29 | ||||
| 2026-02-02 | 13F | Principal Financial Group Inc | 886.407 | -3,02 | 17.799 | -28,61 | ||||
| 2026-02-11 | 13F | Cerity Partners LLC | 48.581 | -59,51 | 976 | -70,21 | ||||
| 2026-04-20 | 13F | Jfs Wealth Advisors, Llc | 23 | 0,00 | 1 | |||||
| 2026-02-13 | 13F | Parkside Financial Bank & Trust | 439 | 92,54 | 9 | 33,33 | ||||
| 2026-02-17 | 13F | Hbk Investments L P | Call | 453.200 | 48,30 | 9.100 | 9,17 | |||
| 2026-02-13 | 13F | Pacific Center for Financial Services | 1 | 0,00 | 0 | |||||
| 2026-02-12 | 13F | Commonwealth Equity Services, Llc | 49.432 | 55,85 | 993 | |||||
| 2026-02-13 | 13F | Marshall Wace, Llp | 3.413.353 | -35,12 | 68.540 | -52,24 | ||||
| 2026-04-15 | 13F | Merit Financial Group, LLC | Call | 90.000 | 0,00 | 45 | 45,16 | |||
| 2025-11-13 | 13F | Jefferies Financial Group Inc. | Put | 0 | -100,00 | 0 | -100,00 | |||
| 2026-02-06 | 13F | Global Retirement Partners, LLC | 10.665 | 5,85 | 214 | -21,90 | ||||
| 2026-02-13 | 13F | Flow Traders U.s. Llc | 0 | -100,00 | 0 | |||||
| 2026-02-17 | 13F | Polymer Capital Management (US) LLC | 0 | -100,00 | 0 | -100,00 | ||||
| 2026-02-17 | 13F | Creek Drive Management Group LLC | 900.000 | 18.072 | ||||||
| 2026-02-17 | 13F | Hbk Investments L P | Put | 1.232.400 | -8,87 | 24.747 | -32,92 | |||
| 2026-02-17 | 13F | Hbk Investments L P | 336.553 | 483,15 | 6.758 | 329,29 | ||||
| 2026-02-13 | 13F | Y-Intercept (Hong Kong) Ltd | 0 | -100,00 | 0 | -100,00 | ||||
| 2026-02-17 | 13F | Creek Drive Management Group LLC | Call | 715.000 | 1.046 | |||||
| 2026-02-18 | 13F | Ctc Llc | 0 | -100,00 | 0 | -100,00 | ||||
| 2026-01-29 | 13F | UBS Group AG | Put | 0 | -100,00 | 0 | -100,00 | |||
| 2026-04-03 | 13F | Global Wealth Strategies & Associates | 2 | 0,00 | 0 | |||||
| 2026-04-20 | 13F | Louisiana State Employees Retirement System | 119.500 | 4,82 | 2.753 | 20,27 | ||||
| 2026-01-23 | 13F | Assetmark, Inc | 64 | -52,24 | 1 | -66,67 | ||||
| 2026-02-06 | 13F | Tortoise Investment Management, LLC | 0 | -100,00 | 0 | |||||
| 2025-11-17 | 13F | Alyeska Investment Group, L.P. | 0 | -100,00 | 0 | -100,00 | ||||
| 2026-01-20 | 13F | Cromwell Holdings LLC | 46 | 0,00 | 1 | -100,00 | ||||
| 2026-02-12 | 13F | SWAN Capital LLC | 22 | 0,00 | 0 | |||||
| 2026-02-13 | 13F | Hurley Capital, LLC | 33 | 1 | ||||||
| 2026-02-13 | 13F | Police & Firemen's Retirement System of New Jersey | 171.739 | -5,31 | 3.449 | -30,30 | ||||
| 2026-02-13 | 13F | Hurley Capital, LLC | Call | 11 | 2 | |||||
| 2026-02-18 | 13F | Ctc Llc | Put | 0 | -100,00 | 0 | -100,00 | |||
| 2026-02-09 | 13F | Sterling Investment Advisors, Ltd. | 13.683 | 2,40 | 275 | -24,73 | ||||
| 2026-02-18 | 13F | Ctc Llc | Call | 0 | -100,00 | 0 | -100,00 | |||
| 2026-02-06 | 13F | Covestor Ltd | 416 | -0,48 | 0 | |||||
| 2026-02-09 | 13F | Keating Financial Advisory Services, Inc. | 30 | 1 | ||||||
| 2026-02-10 | 13F | Belvedere Trading LLC | Call | 151.700 | 58,68 | 3.088 | 18,41 | |||
| 2026-02-10 | 13F | Belvedere Trading LLC | Put | 82.200 | 17,77 | 1.670 | -12,29 | |||
| 2026-02-17 | 13F | Maripau Wealth Management Llc | 62.223 | 0,18 | 1.249 | -26,27 | ||||
| 2026-01-20 | 13F/A | Miller Wealth Advisors, Llc | 600 | 12 | ||||||
| 2026-02-17 | 13F | Jump Financial, LLC | 349.710 | 7.022 | ||||||
| 2026-02-13 | 13F | SRS Capital Advisors, Inc. | 10 | -96,23 | 0 | -100,00 | ||||
| 2026-02-17 | 13F | Cetera Investment Advisers | 34.784 | -0,79 | 698 | -26,99 | ||||
| 2026-02-06 | 13F | CFO4Life Group, LLC | Call | 0 | -100,00 | 0 | -100,00 | |||
| 2026-01-12 | 13F | CVA Family Office, LLC | 4 | 0,00 | 0 | |||||
| 2026-02-13 | 13F | Transamerica Financial Advisors, Inc. | 10 | 400,00 | 0 | |||||
| 2026-04-10 | 13F | Abound Wealth Management | 153 | 0,00 | 4 | 0,00 | ||||
| 2025-11-14 | 13F | Creative Planning | Call | 0 | -100,00 | 0 | ||||
| 2026-02-02 | 13F | Fifth Third Bancorp | 2.817 | -44,43 | 57 | -59,42 | ||||
| 2026-02-13 | 13F | Mariner, LLC | 10.664 | -39,86 | 214 | -55,90 | ||||
| 2026-04-23 | 13F | TFC Financial Management | 16 | 0,00 | 0 | |||||
| 2026-02-05 | 13F | Elyxium Wealth, LLC | 18 | 0 | ||||||
| 2025-11-13 | 13F | Connor, Clark & Lunn Investment Management Ltd. | 0 | -100,00 | 0 | -100,00 | ||||
| 2026-04-13 | 13F | Mather Group, Llc. | 4 | 0 | ||||||
| 2026-04-15 | 13F | Fortitude Family Office, LLC | 72 | 2 | ||||||
| 2026-04-17 | 13F | Robbins Farley Llc | 156 | 0,00 | 4 | 0,00 | ||||
| 2026-04-08 | 13F | DiNuzzo Private Wealth, Inc. | 11 | 0 | ||||||
| 2026-02-17 | 13F | BLKBRD Asset Management, LP | 151.016 | -54,12 | 3.032 | -66,23 | ||||
| 2026-02-13 | 13F | State Street Corp | 12.469.631 | 0,78 | 250.390 | -25,82 | ||||
| 2026-02-18 | 13F | Vident Advisory, LLC | 11.039 | 3,40 | 222 | -24,05 | ||||
| 2026-02-03 | 13F | Everence Capital Management Inc | 11.310 | 0,00 | 0 | |||||
| 2026-02-04 | 13F | Nwam Llc | 28.534 | 0,06 | 574 | -26,25 | ||||
| 2026-02-13 | 13F | OMERS ADMINISTRATION Corp | 66.083 | 63,89 | 1.327 | 20,66 | ||||
| 2025-11-14 | 13F | Raymond James Financial Inc | 0 | -100,00 | 0 | -100,00 | ||||
| 2026-01-30 | 13F | Us Bancorp \de\ | 3.351 | 0,12 | 67 | -26,37 | ||||
| 2026-02-10 | 13F | Bruce G. Allen Investments, LLC | 60 | 0,00 | 1 | 0,00 | ||||
| 2026-02-13 | 13F | Entropy Technologies, LP | 0 | -100,00 | 0 | -100,00 | ||||
| 2026-02-06 | 13F | Tanglewood Legacy Advisors, LLC | 20 | 0,00 | 0 | |||||
| 2026-02-17 | 13F | Bank Of America Corp /de/ | 262.932 | -31,98 | 5.280 | -49,93 | ||||
| 2026-02-10 | 13F | Skaana Management L.P. | Put | 133.400 | -6,58 | 2.679 | -31,25 | |||
| 2026-03-16 | 13F/A | Rockefeller Capital Management L.P. | 2.264 | 805,60 | 45 | 650,00 | ||||
| 2026-02-13 | 13F | Barclays Plc | Put | 0 | -100,00 | 0 | -100,00 | |||
| 2026-02-17 | 13F | Tudor Investment Corp Et Al | Put | 145.600 | 40,95 | 2.924 | 3,73 | |||
| 2026-02-13 | 13F | Squarepoint Ops LLC | 13.731 | -35,83 | 276 | -52,83 | ||||
| 2026-02-17 | 13F | Tudor Investment Corp Et Al | Call | 655.200 | 416,72 | 13.156 | 280,34 | |||
| 2026-02-11 | 13F | Manchester Capital Management LLC | 396 | -6,16 | 8 | -36,36 | ||||
| 2026-02-12 | 13F | Renaissance Technologies Llc | 556.548 | -84,46 | 11.175 | -88,56 | ||||
| 2026-01-15 | 13F | Nisa Investment Advisors, Llc | 37.324 | -0,45 | 749 | -26,71 | ||||
| 2026-02-10 | 13F | Skaana Management L.P. | 20.700 | 416 | ||||||
| 2026-01-23 | 13F | Patten Group, Inc. | 0 | -100,00 | 0 | -100,00 | ||||
| 2025-11-14 | 13F | Texas Permanent School Fund | 0 | -100,00 | 0 | -100,00 | ||||
| 2026-04-24 | 13F | Yousif Capital Management, Llc | 123.862 | -3,49 | 2.854 | 5,35 | ||||
| 2026-02-12 | 13F | Ci Investments Inc. | 0 | -100,00 | 0 | |||||
| 2026-02-02 | 13F | Danske Bank A/s | 3.200 | 0,00 | 64 | -26,44 | ||||
| 2026-02-04 | 13F | Atlantic Union Bankshares Corp | 189 | 0,00 | 4 | -40,00 | ||||
| 2026-01-26 | 13F | Mirae Asset Global Investments Co., Ltd. | 1.185 | 24 | ||||||
| 2026-02-03 | 13F | Cheviot Value Management, LLC | 1 | 0,00 | 0 | |||||
| 2026-02-02 | 13F | Pittenger & Anderson Inc | 625 | 0,00 | 13 | -29,41 | ||||
| 2026-02-17 | 13F | Bank Of America Corp /de/ | Call | 0 | -100,00 | 0 | ||||
| 2025-11-14 | 13F | Soros Fund Management Llc | Call | 0 | -100,00 | 0 | -100,00 | |||
| 2026-04-21 | 13F | Nemes Rush Group LLC | 6 | 0,00 | 0 | |||||
| 2026-02-17 | 13F | LMR Partners LLP | Put | 18.502.800 | 15,48 | 371.536 | -15,00 | |||
| 2026-02-10 | 13F | Rice Partnership, LLC | 0 | -100,00 | 0 | -100,00 | ||||
| 2026-02-17 | 13F | LMR Partners LLP | 77.946 | 0,00 | 1.565 | -26,39 | ||||
| 2026-01-21 | 13F | Sound Income Strategies, LLC | 1 | 0,00 | 0 | |||||
| 2026-02-10 | 13F | Bnp Paribas Arbitrage, Sa | 293.091 | 52,67 | 5.885 | 12,39 | ||||
| 2025-12-18 | 13F | Danske Bank A/s | Put | 0 | -100,00 | 0 | ||||
| 2026-02-06 | 13F | Profund Advisors Llc | 0 | -100,00 | 0 | -100,00 | ||||
| 2026-02-11 | 13F | Jpmorgan Chase & Co | Call | 374.000 | 10,00 | 7.510 | -19,04 | |||
| 2026-02-17 | 13F | Graham Capital Management, L.P. | Put | 1.675.100 | 0,00 | 33.636 | -26,39 | |||
| 2026-02-11 | 13F | Jpmorgan Chase & Co | 765.925 | -9,16 | 15.380 | -33,14 | ||||
| 2026-02-17 | 13F | Graham Capital Management, L.P. | 27.690 | 255,00 | 556 | 162,26 | ||||
| 2026-04-23 | 13F | SJS Investment Consulting Inc. | 13 | 0 | ||||||
| 2026-02-13 | 13F | Toroso Investments, LLC | 977.558 | -6,41 | 19.629 | -31,11 | ||||
| 2026-02-17 | 13F | Northern Trust Corp | 3.159.403 | -2,80 | 63.441 | -28,45 | ||||
| 2026-02-17 | 13F | Aqr Capital Management Llc | 14.814 | -14,84 | 297 | -36,81 | ||||
| 2026-02-13 | 13F | Neuberger Berman Group LLC | 17.317 | 348 | ||||||
| 2026-02-13 | 13F | Toroso Investments, LLC | Call | 1.972.000 | 478,13 | 39.598 | 325,55 | |||
| 2026-02-13 | 13F | Wells Fargo & Company/mn | 85.549 | 17,10 | 1.718 | -13,81 | ||||
| 2026-02-06 | 13F | Meiji Yasuda Asset Management Co Ltd. | 0 | -100,00 | 0 | -100,00 | ||||
| 2026-04-14 | 13F | Bay Harbor Wealth Management, LLC | 11 | 450,00 | 0 | |||||
| 2026-04-16 | 13F | Toth Financial Advisory Corp | 7 | 0,00 | 0 | |||||
| 2026-04-03 | 13F | Adirondack Trust Co | 12 | 0,00 | 0 | |||||
| 2026-02-17 | 13F | LMR Partners LLP | Call | 667.600 | 0,00 | 13.405 | -26,39 | |||
| 2026-04-17 | 13F | Verde Capital Management | 12.363 | -0,16 | 285 | 14,52 | ||||
| 2025-11-14 | 13F | Advisor Group Holdings, Inc. | Call | 0 | -100,00 | 0 | -100,00 | |||
| 2026-01-29 | 13F | Teachers Retirement System Of The State Of Kentucky | 122.484 | 0,00 | 2 | -33,33 | ||||
| 2026-02-17 | 13F | Schonfeld Strategic Advisors LLC | 0 | -100,00 | 0 | -100,00 | ||||
| 2026-02-17 | 13F | Elequin Capital Lp | 1.835 | 37 | ||||||
| 2026-02-17 | 13F | Point72 Asset Management, L.P. | 582.300 | 11.693 | ||||||
| 2026-04-08 | 13F | Wealth Enhancement Trust Services, Inc. | 0 | -100,00 | 0 | |||||
| 2026-02-17 | 13F | Point72 Asset Management, L.P. | Put | 6.332.400 | 18,27 | 127.155 | -12,95 | |||
| 2026-02-17 | 13F | Shay Capital LLC | 44.317 | 890 | ||||||
| 2026-02-17 | 13F | Point72 Asset Management, L.P. | Call | 21.600 | -52,00 | 434 | -64,71 | |||
| 2026-02-17 | 13F | Shay Capital LLC | Call | 10.000 | 201 | |||||
| 2026-02-17 | 13F | Price T Rowe Associates Inc /md/ | 322.836 | 2,13 | 6 | -25,00 | ||||
| 2026-02-17 | 13F | Creative Planning | 15.848 | 40,27 | 318 | 3,25 | ||||
| 2026-04-15 | 13F | Activest Wealth Management | 0 | 0 | ||||||
| 2026-02-13 | 13F | Sei Investments Co | 77.200 | 89,04 | 1.550 | 39,14 | ||||
| 2026-02-17 | 13F | Shaolin Capital Management LLC | Call | 0 | -100,00 | 0 | -100,00 | |||
| 2026-02-03 | 13F | Mitsubishi UFJ Kokusai Asset Management Co., Ltd. | 990 | 0,00 | 20 | -25,93 | ||||
| 2026-02-13 | 13F | FORA Capital, LLC | 0 | -100,00 | 0 | -100,00 | ||||
| 2026-04-13 | 13F | Clayton Financial Group LLC | 100 | 2 | ||||||
| 2026-01-30 | 13F | Wealthfront Advisers Llc | 25.135 | 15,77 | 505 | -14,86 | ||||
| 2026-02-18 | 13F | Garton & Associates Financial Advisors LLC | 100 | 2 | ||||||
| 2026-04-15 | 13F | City Holding Co | 1.118 | 0,00 | 26 | 13,64 | ||||
| 2026-02-12 | 13F | New York State Common Retirement Fund | 205.378 | 0,00 | 4.124 | -26,40 | ||||
| 2026-02-17 | 13F | Two Sigma Investments, Lp | Put | 68.900 | -97,80 | 1.384 | -98,38 | |||
| 2026-02-17 | 13F | Jones Financial Companies Lllp | 2.535 | -16,50 | 51 | -37,50 | ||||
| 2026-02-05 | 13F | Northwestern Mutual Investment Management Company, Llc | 92.197 | 0,50 | 1.851 | -26,02 | ||||
| 2026-02-09 | 13F | Cypress Capital Management LLC (WY) | 0 | -100,00 | 0 | -100,00 | ||||
| 2026-03-12 | 13F/A | Peak6 Llc | 36.516 | 733 | ||||||
| 2026-04-06 | 13F | CX Institutional | 520 | 0 | ||||||
| 2026-04-23 | 13F | Cornerstone Wealth Management, LLC | 29.946 | 1,09 | 690 | 15,99 | ||||
| 2026-02-13 | 13F | Wexford Capital Lp | 4.710 | 95 | ||||||
| 2026-04-10 | 13F | Armstrong Advisory Group, Inc | 160 | 0,00 | 4 | 0,00 | ||||
| 2026-02-13 | 13F | Cynosure Management, Llc | 19.123 | 384 | ||||||
| 2026-02-13 | 13F | Palisade Asset Management, LLC | 0 | -100,00 | 0 | |||||
| 2026-02-13 | 13F | Stifel Financial Corp | 0 | -100,00 | 0 | |||||
| 2026-04-14 | 13F | Nbc Securities, Inc. | 0 | -100,00 | 0 | |||||
| 2026-04-23 | 13F | Cornerstone Wealth Management, LLC | Call | 20.000 | 44 | |||||
| 2026-01-30 | 13F | Caldwell Securities, Inc | 18 | 0,00 | 0 | |||||
| 2026-02-06 | 13F | HighTower Advisors, LLC | 33.549 | 36,57 | 674 | 0,45 | ||||
| 2026-02-09 | 13F | Legal & General Group Plc | 634.985 | -19,91 | 12.750 | -41,05 | ||||
| 2026-02-09 | 13F | Harbour Investments, Inc. | 237 | 19,70 | 5 | -20,00 | ||||
| 2026-02-13 | 13F | Van Eck Associates Corp | 2.805.540 | -9,46 | 56 | -33,33 | ||||
| 2026-02-13 | 13F | K2 Principal Fund, L.p. | Call | 376.500 | 7.560 | |||||
| 2026-02-11 | 13F | Ameritas Investment Partners, Inc. | 75.520 | 1.516 | ||||||
| 2026-02-13 | 13F | K2 Principal Fund, L.p. | Put | 275.000 | 5.522 | |||||
| 2026-02-10 | 13F/A | Northwestern Mutual Wealth Management Co | 813 | -16,10 | 16 | -38,46 | ||||
| 2026-02-10 | 13F | Foundations Investment Advisors, LLC | 36.471 | -19,17 | 732 | -40,49 | ||||
| 2026-01-30 | 13F | American Capital Advisory, LLC | 134 | -2,90 | 3 | -33,33 | ||||
| 2026-02-12 | 13F | Principal Securities, Inc. | 0 | -100,00 | 0 | -100,00 | ||||
| 2026-02-11 | 13F | TCTC Holdings, LLC | 2.400 | 0,00 | 48 | -26,15 | ||||
| 2026-02-17 | 13F | Algert Global Llc | 183.751 | 32,45 | 4 | 0,00 | ||||
| 2026-04-13 | 13F | IFP Advisors, Inc | 2.023 | 31,36 | 47 | 53,33 | ||||
| 2026-02-17 | 13F | Capital Fund Management S.a. | 27.755 | -93,94 | 557 | -95,54 | ||||
| 2026-01-14 | 13F | Game Plan Financial Advisors, LLC | 0 | -100,00 | 0 | -100,00 | ||||
| 2026-02-12 | 13F | Rossby Financial, LCC | 64 | 23,08 | 1 | 0,00 | ||||
| 2026-02-13 | 13F | Ubs Asset Management Americas Inc | 946.029 | 0,66 | 18.996 | -25,90 | ||||
| 2026-02-17 | 13F | DV Trading LLC | 3 | 0 | ||||||
| 2026-02-17 | 13F | Utah Retirement Systems | 21.660 | 0,00 | 435 | -26,44 | ||||
| 2026-02-11 | 13F | Group One Trading, L.p. | Call | 4.526.700 | 43,29 | 90.896 | 5,47 | |||
| 2026-02-12 | 13F | Cloud Capital Management, LLC | 0 | -100,00 | 0 | |||||
| 2026-02-11 | 13F | Group One Trading, L.p. | Put | 1.199.900 | 111,44 | 24.094 | 55,63 | |||
| 2026-04-16 | 13F | Davis Capital Management | 8 | 0,00 | 0 | |||||
| 2026-04-16 | 13F | SG Americas Securities, LLC | 12.427 | 29,26 | 0 | |||||
| 2026-02-13 | 13F | Treasurer of the State of North Carolina | 171.688 | -6,81 | 3 | -40,00 | ||||
| 2026-02-06 | 13F | Larson Financial Group LLC | 1.881 | -15,12 | 38 | -38,33 | ||||
| 2026-02-05 | 13F | Thrivent Financial For Lutherans | 93.575 | -1,85 | 2 | -50,00 | ||||
| 2026-02-13 | 13F | Prudential Financial Inc | 27.394 | -36,14 | 550 | -52,99 | ||||
| 2026-02-03 | 13F | SBI Securities Co., Ltd. | 2.915 | -37,01 | 59 | -53,97 | ||||
| 2025-10-30 | 13F | Twin Peaks Wealth Advisors, LLC | 0 | -100,00 | 0 | -100,00 | ||||
| 2026-02-10 | 13F | Intech Investment Management Llc | 68.026 | -25,54 | 1.366 | -45,22 | ||||
| 2026-04-13 | 13F | Wolff Wiese Magana Llc | 410 | 0,00 | 9 | 12,50 | ||||
| 2026-02-17 | 13F | Ionic Capital Management LLC | Call | 56.900 | 1.143 | |||||
| 2025-11-07 | 13F | Shell Asset Management Co | 3.279 | -58,15 | 0 | |||||
| 2026-04-06 | 13F | Versant Capital Management, Inc | 194 | 74,77 | 4 | 100,00 | ||||
| 2026-04-13 | 13F | Salem Investment Counselors Inc | 4 | 0 | ||||||
| 2025-11-14 | 13F | Cubist Systematic Strategies, LLC | 588.010 | 463,46 | 16.041 | 530,26 | ||||
| 2026-02-13 | 13F | Motiv8 Investments LLC | 4 | 0 | ||||||
| 2026-02-12 | 13F | Bank Of Montreal /can/ | Put | 127.800 | -91,25 | 2.566 | -93,56 | |||
| 2026-02-12 | 13F | Bank Of Montreal /can/ | 566.359 | -58,59 | 11.372 | -69,52 | ||||
| 2026-02-17 | 13F | Soviero Asset Management, LP | 233.000 | 4.679 | ||||||
| 2026-01-29 | 13F | Comerica Bank | 97.820 | -5,04 | 1.964 | -30,11 | ||||
| 2025-11-21 | 13F/A | CIBC Bancorp USA Inc. | Call | 80.000 | 2.182 | |||||
| 2026-02-12 | 13F | Triumph Capital Management | 45.271 | 27,46 | 909 | -6,10 | ||||
| 2026-02-13 | 13F | Seneschal Advisors, LLC | 4 | 0,00 | 0 | |||||
| 2026-02-13 | 13F | Rokos Capital Management LLP | Put | 0 | -100,00 | 0 | -100,00 | |||
| 2026-02-17 | 13F | Jain Global LLC | Put | 275.000 | 0,00 | 5.522 | -26,39 | |||
| 2026-02-17 | 13F | Susquehanna International Group, Llp | Put | 10.388.400 | 29,71 | 208.599 | -4,52 | |||
| 2026-02-17 | 13F | Susquehanna International Group, Llp | Call | 15.396.200 | 53,80 | 309.156 | 13,21 | |||
| 2026-01-29 | 13F | Rakuten Securities, Inc. | 1.045 | 21 | ||||||
| 2026-02-17 | 13F | Susquehanna International Group, Llp | 3.536.711 | -57,27 | 71.017 | -68,55 | ||||
| 2025-11-12 | 13F | HAP Trading, LLC | Call | 213.500 | 1.925 | |||||
| 2025-11-12 | 13F | HAP Trading, LLC | Put | 154.000 | 34 | |||||
| 2025-11-14 | 13F | Walleye Trading LLC | 0 | -100,00 | 0 | -100,00 | ||||
| 2025-11-17 | 13F | LGT Financial Advisors LLC | 0 | -100,00 | 0 | |||||
| 2026-02-03 | 13F | Morse Asset Management, Inc | 20 | 0,00 | 0 | |||||
| 2026-02-17 | 13F | Capital Fund Management S.a. | Call | 215.200 | 4.321 | |||||
| 2026-02-17 | 13F | Capital Fund Management S.a. | Put | 19.200 | 386 | |||||
| 2026-02-12 | 13F | Swiss National Bank | 839.028 | 1,83 | 16.848 | -25,04 | ||||
| 2026-02-17 | 13F | Canada Pension Plan Investment Board | 59.800 | -33,26 | 1.201 | -50,90 | ||||
| 2026-02-17 | 13F | California State Teachers Retirement System | 402.812 | 1,57 | 8.088 | -25,24 | ||||
| 2026-01-29 | 13F | Quent Capital, LLC | 135 | -41,05 | 3 | -66,67 | ||||
| 2026-02-05 | 13F | Bessemer Group Inc | 1.682 | 0,48 | 0 | |||||
| 2026-02-10 | 13F | Commonwealth Of Pennsylvania Public School Empls Retrmt Sys | 103.119 | -2,37 | 2.071 | -28,15 | ||||
| 2026-02-13 | 13F | Rafferty Asset Management, LLC | 23.437 | 10,64 | 471 | -18,54 | ||||
| 2026-01-15 | 13F | Highline Wealth Partners Llc | 0 | -100,00 | 0 | |||||
| 2026-02-09 | 13F | Atlantic Trust, LLC | 22 | 0 | ||||||
| 2026-02-06 | 13F | Pnc Financial Services Group, Inc. | 30.618 | -1,17 | 615 | -27,34 | ||||
| 2026-02-11 | 13F | LPL Financial LLC | Call | 0 | -100,00 | 0 | -100,00 | |||
| 2026-04-08 | 13F | Wealth Enhancement Advisory Services, Llc | 42.723 | -11,93 | 998 | -0,40 | ||||
| 2026-01-27 | 13F | Zurcher Kantonalbank (Zurich Cantonalbank) | 131.301 | 8,28 | 2.637 | -20,29 | ||||
| 2026-02-10 | 13F | Belvedere Trading LLC | 0 | -100,00 | 0 | -100,00 | ||||
| 2026-02-13 | 13F | National Bank Of Canada /fi/ | Put | 11.845 | 4.638,00 | 23.785 | 3.387,39 | |||
| 2025-11-14 | 13F | Point72 (DIFC) Ltd | 5.286 | 69,97 | 144 | 92,00 | ||||
| 2026-04-20 | 13F | Ronald Blue Trust, Inc. | 951 | 0,00 | 22 | 10,53 | ||||
| 2026-02-20 | 13F/A | Prestige Wealth Management Group LLC | 0 | -100,00 | 0 | -100,00 | ||||
| 2026-02-05 | 13F | Plante Moran Financial Advisors, LLC | 800 | 0,00 | 16 | -23,81 | ||||
| 2026-02-12 | 13F | MetLife Investment Management, LLC | 201.315 | -4,82 | 4.042 | -29,94 | ||||
| 2026-02-12 | 13F | Scotia Capital Inc. | 12.116 | -0,27 | 243 | -26,59 | ||||
| 2026-04-07 | 13F | Estate Planners Group, LLC | 16 | 0 | ||||||
| 2026-02-13 | 13F | Golden State Wealth Management, LLC | 100 | -74,23 | 2 | -80,00 | ||||
| 2026-02-17 | 13F | Russell Investments Group, Ltd. | 50.263 | 5,07 | 1.010 | -22,62 | ||||
| 2026-02-17 | 13F | Scarborough Advisors, LLC | 1 | 0,00 | 0 | |||||
| 2026-02-23 | 13F | Mv Capital Management, Inc. | 5 | -50,00 | 0 | |||||
| 2026-02-13 | 13F | Verition Fund Management LLC | 0 | -100,00 | 0 | -100,00 | ||||
| 2025-11-13 | 13F | Kayne Anderson Rudnick Investment Management Llc | 0 | -100,00 | 0 | |||||
| 2026-04-13 | 13F | Massmutual Trust Co Fsb/adv | 357 | -39,08 | 8 | -27,27 | ||||
| 2025-11-21 | 13F/A | CIBC Bancorp USA Inc. | Put | 265.000 | 7.229 | |||||
| 2026-02-10 | 13F | New Mexico Educational Retirement Board | 84.288 | 0,00 | 2 | -50,00 | ||||
| 2026-02-12 | 13F | Xponance, Inc. | 38.438 | -17,60 | 772 | -39,39 | ||||
| 2026-02-17 | 13F | Css Llc/il | Put | 1.457.500 | -8,33 | 29.267 | -32,53 | |||
| 2026-02-17 | 13F | Css Llc/il | Call | 2.500 | 50 | |||||
| 2026-02-17 | 13F | Css Llc/il | 9.360 | 188 | ||||||
| 2026-02-13 | 13F | Pinnacle Wealth Planning Services, Inc. | 3.293 | 66 | ||||||
| 2026-02-13 | 13F | Vontobel Holding Ltd. | 10.085 | 123,02 | 203 | 64,23 | ||||
| 2026-02-13 | 13F | Vontobel Holding Ltd. | Put | 20.000 | -36,71 | 402 | -53,48 | |||
| 2026-02-13 | 13F | Vontobel Holding Ltd. | Call | 458.500 | 4,63 | 9.207 | -22,99 | |||
| 2026-02-17 | 13F/A | North Capital, Inc. | 0 | -100,00 | 0 | |||||
| 2026-04-22 | 13F | Sterling Capital Management LLC | 13.748 | -43,41 | 317 | -35,11 | ||||
| 2026-01-30 | 13F | State of New Jersey Common Pension Fund D | 146.221 | -0,49 | 2.936 | -26,75 | ||||
| 2026-02-17 | 13F | Royal Bank Of Canada | 15.480 | 11,64 | 310 | -17,99 | ||||
| 2026-02-11 | 13F | Capital Analysts, Inc. | 2.099 | 0,00 | 0 | |||||
| 2025-12-16 | 13F | Garde Capital, Inc. | 0 | -100,00 | 0 | -100,00 | ||||
| 2026-02-09 | 13F | Quest Partners LLC | 7.228 | -17,56 | 145 | -39,33 | ||||
| 2025-11-14 | 13F | Squarepoint Ops LLC | Put | 0 | -100,00 | 0 | -100,00 | |||
| 2026-02-04 | 13F | Tsfg, Llc | 0 | -100,00 | 0 | |||||
| 2025-11-14 | 13F | Axa S.a. | 0 | -100,00 | 0 | |||||
| 2026-01-28 | 13F | Geneos Wealth Management Inc. | 200 | 0,00 | 4 | -20,00 | ||||
| 2026-04-24 | 13F | Retirement Systems of Alabama | 505.296 | 2,17 | 11.642 | 17,24 | ||||
| 2026-02-17 | 13F | Advisor Group Holdings, Inc. | 19.210 | -28,86 | 386 | -40,68 | ||||
| 2026-03-04 | 13F | SHP Wealth Management | 25 | 1 | ||||||
| 2025-11-10 | 13F/A | Flaharty Asset Management, LLC | 0 | -100,00 | 0 | -100,00 | ||||
| 2026-04-22 | 13F | Pictet Asset Management Holding SA | 67.822 | 7,65 | 1.563 | 23,48 | ||||
| 2026-02-06 | 13F | Covestor Ltd | Call | 41 | 0 | |||||
| 2026-04-21 | 13F | First United Bank Trust/ | 3.900 | 0,00 | 90 | 14,10 | ||||
| 2026-04-22 | 13F | Stone House Investment Management, LLC | 4 | -89,74 | 0 | |||||
| 2026-02-12 | 13F | Steward Partners Investment Advisory, Llc | 10.981 | -4,44 | 220 | -29,71 | ||||
| 2026-04-20 | 13F | City State Bank | 80 | 0,00 | 2 | 0,00 | ||||
| 2026-02-10 | 13F | Acadian Asset Management Llc | 2.740 | 93,91 | 0 | |||||
| 2026-02-13 | 13F | Marathon Trading Investment Management LLC | Put | 422.300 | 8.480 | |||||
| 2026-02-13 | 13F | Marathon Trading Investment Management LLC | 17.411 | -55,90 | 350 | -67,57 | ||||
| 2026-02-13 | 13F | Marathon Trading Investment Management LLC | Call | 159.000 | 86,84 | 3.193 | 37,53 | |||
| 2026-02-05 | 13F | Cambridge Investment Research Advisors, Inc. | 0 | -100,00 | 0 | |||||
| 2026-02-05 | 13F | North Dakota State Investment Board | 14.559 | 292 | ||||||
| 2026-01-27 | 13F | WealthCollab, LLC | 120 | 0,00 | 2 | -33,33 | ||||
| 2026-02-06 | 13F | EverSource Wealth Advisors, LLC | 802 | -40,37 | 16 | -55,56 | ||||
| 2026-02-11 | 13F | LPL Financial LLC | 110.943 | 23,96 | 2.228 | -8,77 | ||||
| 2026-02-24 | 13F/A | Pacer Advisors, Inc. | 1.112.535 | 19,35 | 22.340 | -12,15 | ||||
| 2026-02-04 | 13F | Securian Asset Management, Inc | 30.031 | -2,57 | 603 | -28,21 | ||||
| 2026-02-17 | 13F | EFG International AG | 22 | 0 | ||||||
| 2026-01-26 | 13F | Main Street Group, LTD | 0 | -100,00 | 0 | -100,00 | ||||
| 2026-02-10 | 13F | Eurizon Capital SGR S.p.A. | 4.557 | 93 | ||||||
| 2026-02-06 | 13F | GPS Wealth Strategies Group, LLC | 0 | -100,00 | 0 | -100,00 | ||||
| 2026-02-17 | 13F | Parallax Volatility Advisers, L.P. | Call | 180.000 | -64,36 | 3.614 | -73,77 | |||
| 2026-02-17 | 13F | Parallax Volatility Advisers, L.P. | Put | 523.300 | 0,96 | 10.508 | -25,69 | |||
| 2026-01-15 | 13F | Bernard Wealth Management Corp. | 600 | 0,00 | 12 | -25,00 | ||||
| 2026-02-02 | 13F | Wolverine Asset Management Llc | Call | 145.000 | 2.912 | |||||
| 2025-11-13 | 13F | Franklin Resources Inc | 0 | -100,00 | 0 | -100,00 | ||||
| 2025-10-27 | 13F | Kiker Wealth Management, LLC | 0 | -100,00 | 0 | -100,00 | ||||
| 2025-11-12 | 13F | Elo Mutual Pension Insurance Co | 0 | -100,00 | 0 | -100,00 | ||||
| 2026-01-28 | 13F | Arizona State Retirement System | 117.508 | -6,56 | 2.360 | -31,22 | ||||
| 2026-02-13 | 13F | Walleye Trading LLC | Put | 167.100 | -12,83 | 3.355 | -30,16 | |||
| 2026-02-17 | 13F | ExodusPoint Capital Management, LP | 0 | -100,00 | 0 | -100,00 | ||||
| 2026-02-17 | 13F | Qube Research & Technologies Ltd | Put | 6.400 | 0,00 | 129 | -26,44 | |||
| 2026-02-13 | 13F | Umb Bank N A/mo | 4.694 | 14,52 | 94 | -15,32 | ||||
| 2026-02-17 | 13F | Qube Research & Technologies Ltd | Call | 203.400 | -31,74 | 4.084 | -49,76 | |||
| 2026-01-12 | 13F | Traynor Capital Management, Inc. | Call | 1.800 | 36 | |||||
| 2026-02-12 | 13F | Great Lakes Advisors, Llc | 217.448 | -4,37 | 4.366 | -29,61 | ||||
| 2026-04-07 | 13F | Farther Finance Advisors, LLC | 5.281 | 103,27 | 120 | 130,77 | ||||
| 2026-04-22 | 13F | Spire Wealth Management | 157 | 5,37 | 4 | 50,00 | ||||
| 2026-01-12 | 13F | Traynor Capital Management, Inc. | 8.230 | 165 | ||||||
| 2025-11-14 | 13F | DRW Securities, LLC | Call | 0 | -100,00 | 0 | -100,00 | |||
| 2026-02-17 | 13F | Ionic Capital Management LLC | Put | 0 | -100,00 | 0 | -100,00 | |||
| 2026-02-19 | 13F | CI Private Wealth, LLC | 11.177 | 34 | ||||||
| 2026-02-20 | 13F | Sunbelt Securities, Inc. | 59 | -10,61 | 1 | 0,00 | ||||
| 2026-02-13 | 13F | Morgan Stanley | 3.406.885 | 22,37 | 68.410 | -9,93 | ||||
| 2026-02-26 | 13F/A | Banque Transatlantique SA | 145 | 0,00 | 3 | -33,33 | ||||
| 2026-02-10 | 13F | Bank of New York Mellon Corp | 2.381.224 | 1,89 | 47.815 | -25,01 | ||||
| 2026-02-13 | 13F | National Bank Of Canada /fi/ | 1.184.500 | 4.600,40 | 23.785 | 3.362,01 | ||||
| 2026-02-12 | 13F | Voya Investment Management Llc | 125.337 | -5,69 | 2.517 | -30,59 | ||||
| 2026-02-11 | 13F | Meeder Asset Management Inc | 102 | -52,34 | 2 | -60,00 | ||||
| 2025-11-13 | 13F | Ws Management Lllp | 0 | -100,00 | 0 | -100,00 | ||||
| 2026-04-07 | 13F | CoreCap Advisors, LLC | 1.460 | 0,00 | 34 | 13,79 | ||||
| 2026-02-04 | 13F | Oregon Public Employees Retirement Fund | 81.918 | -1,21 | 1.645 | -27,32 | ||||
| 2026-02-09 | 13F | Advent Capital Management /de/ | Call | 0 | -100,00 | 0 | -100,00 | |||
| 2026-02-13 | 13F | Caitong International Asset Management Co., Ltd | 2.705 | 54 | ||||||
| 2026-02-17 | 13F | Atom Investors LP | 11.733 | 236 | ||||||
| 2026-02-18 | 13F | GWM Advisors LLC | 500 | -5,48 | 10 | -28,57 | ||||
| 2026-04-15 | 13F | Bayforest Capital Ltd | 12.737 | -14,49 | 293 | -2,01 | ||||
| 2026-01-22 | 13F | Bartlett & Co. Wealth Management Llc | 4 | 0,00 | 0 | |||||
| 2026-02-10 | 13F | Natixis Advisors, L.p. | 16.701 | -35,59 | 0 | |||||
| 2026-04-07 | 13F | Eastern Bank | 3.700 | 0,00 | 85 | 14,86 | ||||
| 2026-02-17 | 13F | Ancora Advisors, LLC | 290 | 6 | ||||||
| 2026-02-17 | 13F | Alphadyne Asset Management, LLC | Call | 37.700 | 757 | |||||
| 2026-02-10 | 13F | Mutual Of America Capital Management Llc | 171.496 | -9,77 | 3.444 | -33,58 | ||||
| 2026-02-13 | 13F | Walleye Trading LLC | Call | 1.433.700 | 13,89 | 28.789 | -7,91 | |||
| 2026-02-17 | 13F | J. Goldman & Co LP | Call | 370.200 | 7.434 | |||||
| 2026-04-21 | 13F | Keystone Financial Group, Inc. | 60 | 0,00 | 1 | 0,00 | ||||
| 2026-02-27 | 13F | Compass Financial Services Inc | 100 | 0,00 | 2 | 0,00 | ||||
| 2026-01-29 | 13F | UBS Group AG | Call | 10.000 | -82,30 | 201 | -87,02 | |||
| 2026-01-29 | 13F | UBS Group AG | 2.415.918 | 4,22 | 48.512 | -23,29 | ||||
| 2026-01-16 | 13F | Trust Co Of Vermont | 533 | 393,52 | 11 | 400,00 | ||||
| 2026-02-11 | 13F | MCF Advisors LLC | 811 | 0,00 | 16 | -27,27 | ||||
| 2026-02-13 | 13F | Victory Capital Management Inc | 61.633 | 0,04 | 1.238 | -26,37 | ||||
| 2026-02-06 | 13F | Bare Financial Services, Inc | 17 | 0 | ||||||
| 2026-02-12 | 13F | Wealthspire Advisors, LLC | 0 | -100,00 | 0 | -100,00 | ||||
| 2026-02-12 | 13F | California Public Employees Retirement System | 450.970 | 48,93 | 9.055 | 9,62 | ||||
| 2026-04-10 | 13F | Quaker Wealth Management, LLC | 3 | 0 | ||||||
| 2026-02-10 | 13F | Goldman Sachs Group Inc | Put | 157.500 | -68,03 | 3.163 | -76,47 | |||
| 2026-02-10 | 13F | Goldman Sachs Group Inc | 950.685 | -40,86 | 19.090 | -56,47 | ||||
| 2026-02-12 | 13F | Federated Hermes, Inc. | 33.137 | -9,87 | 665 | -33,63 | ||||
| 2026-02-17 | 13F | Weiss Asset Management LP | 12.493 | 251 | ||||||
| 2026-02-17 | 13F | Fmr Llc | 22.404 | 43,50 | 450 | 5,65 | ||||
| 2026-01-23 | 13F | Portman Square Capital LLP | Put | 1.664.200 | 33.417 | |||||
| 2026-02-17 | 13F | Alliancebernstein L.p. | 512.099 | -1,94 | 10.283 | -27,82 | ||||
| 2026-02-09 | 13F | Jefferies Financial Group Inc. | 0 | -100,00 | 0 | -100,00 | ||||
| 2026-01-29 | 13F | Vanguard Group Inc | 38.195.010 | -0,80 | 766.956 | -26,98 | ||||
| 2026-02-13 | 13F | Pin Oak Investment Advisors Inc | 16 | 0,00 | 0 | |||||
| 2026-02-12 | 13F | Triumph Capital Management | Call | 0 | -100,00 | 0 | -100,00 | |||
| 2026-02-17 | 13F | CastleKnight Management LP | 0 | -100,00 | 0 | -100,00 | ||||
| 2026-02-12 | 13F | Skopos Labs, Inc. | 11.194 | 20,34 | 230 | -9,49 | ||||
| 2026-02-17 | 13F | CastleKnight Management LP | Call | 0 | -100,00 | 0 | -100,00 | |||
| 2026-02-17 | 13F | Public Employees Retirement System Of Ohio | 126.363 | -3,54 | 2.537 | -29,00 | ||||
| 2026-02-17 | 13F | Two Sigma Advisers, Lp | 105.839 | 5,49 | 2.125 | -22,33 | ||||
| 2026-02-12 | 13F | Nuveen, LLC | 746.331 | 0,94 | 14.986 | -25,70 | ||||
| 2026-01-28 | 13F | Klp Kapitalforvaltning As | 93.367 | 5,30 | 1.875 | -22,50 | ||||
| 2026-02-12 | 13F | Dimensional Fund Advisors Lp | 1.352.205 | 2,34 | 27.166 | -24,62 | ||||
| 2025-11-14 | 13F | Point72 Europe (London) LLP | 969 | -97,48 | 26 | -97,22 | ||||
| 2026-02-13 | 13F | Kestra Advisory Services, LLC | 16.496 | -10,34 | 331 | -33,93 | ||||
| 2026-02-02 | 13F | Cornerstone Planning Group LLC | 4 | -33,33 | 0 | |||||
| 2026-02-17 | 13F | Quantinno Capital Management LP | 29.058 | 77,71 | 583 | 30,72 | ||||
| 2026-02-23 | 13F | Beaird Harris Wealth Management, LLC | 80 | 0,00 | 2 | -50,00 | ||||
| 2026-01-22 | 13F | Bear Mountain Capital, Inc. | 0 | -100,00 | 0 | |||||
| 2026-02-06 | 13F | CFO4Life Group, LLC | 10.300 | 0,97 | 207 | -25,90 | ||||
| 2026-02-17 | 13F | Janus Henderson Group Plc | 187.764 | 3,79 | 3.771 | -23,57 | ||||
| 2026-01-29 | 13F | Dunhill Financial, LLC | 11 | 0 | ||||||
| 2026-02-10 | 13F | MidAtlantic Capital Management, Inc. | 8 | 0 | ||||||
| 2026-02-17 | 13F | Nomura Holdings Inc | 179.733 | 0,92 | 3.609 | -25,71 | ||||
| 2026-02-10 | 13F | Nomura Asset Management Co Ltd | 1.060 | 0,00 | 21 | -25,00 | ||||
| 2026-02-17 | 13F | Nomura Holdings Inc | Call | 99.900 | 66,78 | 2.006 | 22,71 | |||
| 2026-01-27 | 13F | TD Waterhouse Canada Inc. | 6.207 | 26,70 | 125 | -8,15 | ||||
| 2026-02-11 | 13F | Highbridge Capital Management Llc | Put | 0 | -100,00 | 0 | -100,00 | |||
| 2026-04-17 | 13F | AdvisorNet Financial, Inc | 53 | 10,42 | 1 | |||||
| 2026-02-11 | 13F | Los Angeles Capital Management Llc | 1.940 | 44 | ||||||
| 2026-04-13 | 13F | Creative Financial Designs Inc /adv | 1.032 | 0,00 | 24 | 15,00 | ||||
| 2026-01-16 | 13F | FNY Investment Advisers, LLC | 0 | -100,00 | 0 | |||||
| 2026-02-04 | 13F | Independent Advisor Alliance | 0 | -100,00 | 0 | -100,00 | ||||
| 2026-02-13 | 13F | Smartleaf Asset Management LLC | 481 | -23,04 | 10 | -47,06 | ||||
| 2026-02-17 | 13F | Advisory Services Network, LLC | 0 | -100,00 | 0 | -100,00 | ||||
| 2026-04-22 | 13F | Lam Group, Inc. | 12 | 0 | ||||||
| 2026-02-12 | 13F | Hrt Financial Lp | 78.000 | 2 | ||||||
| 2026-02-13 | 13F | Charles Schwab Investment Management Inc | 3.269.442 | -0,36 | 65.650 | -26,66 | ||||
| 2025-11-13 | 13F | Total Investment Management Inc | 0 | -100,00 | 0 | |||||
| 2026-02-17 | 13F | MIRAE ASSET GLOBAL ETFS HOLDINGS Ltd. | 4.467 | 90 | ||||||
| 2026-04-16 | 13F | Capital Advisors, Ltd. LLC | 5 | 150,00 | 0 | |||||
| 2026-02-17 | 13F | Millennium Management Llc | Call | 29.200 | -88,64 | 586 | -91,64 | |||
| 2026-02-13 | 13F | Panagora Asset Management Inc | 13.692 | 4,54 | 275 | -23,25 | ||||
| 2026-02-17 | 13F | Millennium Management Llc | 260.274 | 5.226 | ||||||
| 2025-11-17 | 13F | Sender Co & Partners, Inc. | 0 | -100,00 | 0 | -100,00 | ||||
| 2026-04-24 | 13F | Root Financial Partners, LLC | 405 | 864,29 | 9 | |||||
| 2026-01-28 | 13F | Barrett & Company, Inc. | 80 | 0,00 | 2 | -50,00 | ||||
| 2026-02-02 | 13F | Wolverine Asset Management Llc | 4.263 | -12,14 | 86 | -35,61 | ||||
| 2026-02-06 | 13F | HighTower Advisors, LLC | Put | 0 | -100,00 | 0 | -100,00 | |||
| 2026-02-17 | 13F | Millennium Management Llc | Put | 22.500 | -97,58 | 452 | -98,22 | |||
| 2026-02-11 | 13F | Deutsche Bank Ag\ | 60.443 | 2,63 | 1.214 | -24,47 | ||||
| 2026-02-11 | 13F | Deutsche Bank Ag\ | Call | 105.000 | 0,00 | 2.108 | -26,40 | |||
| 2026-02-13 | 13F | MAI Capital Management | 1.049 | -1,13 | 21 | -25,00 | ||||
| 2026-04-13 | 13F | Loring Wolcott & Coolidge Fiduciary Advisors Llp/ma | 12 | 0,00 | 0 | |||||
| 2026-04-20 | 13F | Christensen, King & Associates Investment Services, Inc. | 33.673 | 8,02 | 776 | 24,00 | ||||
| 2026-02-09 | 13F | Huntington National Bank | 109 | -25,34 | 2 | -33,33 | ||||
| 2026-01-29 | 13F | IMC-Chicago, LLC | Call | 4.462.300 | 32,28 | 89.603 | -2,64 | |||
| 2026-01-28 | 13F | WPG Advisers, LLC | 62 | 1 | ||||||
| 2026-02-12 | 13F | CIBC Private Wealth Group, LLC | 892 | 167,07 | 18 | 88,89 | ||||
| 2026-02-13 | 13F | Rhumbline Advisers | 1.066.684 | -0,09 | 21.419 | -26,46 | ||||
| 2025-11-14 | 13F | Wolverine Trading, Llc | 186.791 | 885,29 | 5.083 | 1.036,91 | ||||
| 2026-04-07 | 13F | Signaturefd, Llc | 1.080 | 0,00 | 25 | 14,29 | ||||
| 2026-02-12 | 13F | Federation des caisses Desjardins du Quebec | 36.602 | 15,84 | 735 | -14,75 | ||||
| 2025-11-14 | 13F | Wolverine Trading, Llc | Call | 2.723.900 | 15,46 | 74.117 | 33,18 | |||
| 2025-11-14 | 13F | Wolverine Trading, Llc | Put | 1.325.400 | -5,97 | 36.064 | 8,46 | |||
| 2026-02-13 | 13F | Sculptor Capital LP | Put | 1.033.800 | 2,00 | 20.759 | -24,92 | |||
| 2026-02-11 | 13F | Group One Trading, L.p. | 0 | -100,00 | 0 | -100,00 | ||||
| 2026-01-21 | 13F | Flagship Harbor Advisors, Llc | 1 | 0 | ||||||
| 2026-02-12 | 13F | Marex Group plc | 1.015.478 | 31,62 | 20.391 | -3,12 | ||||
| 2025-11-04 | 13F | Westside Investment Management, Inc. | 0 | -100,00 | 0 | -100,00 | ||||
| 2025-11-19 | 13F/A | Danske Bank A/s | Call | 0 | -100,00 | 0 | -100,00 | |||
| 2026-02-17 | 13F | Balyasny Asset Management Llc | 140.465 | 81,50 | 2.821 | 33,59 | ||||
| 2026-02-05 | 13F | Allworth Financial LP | 253 | -7,33 | 5 | -28,57 | ||||
| 2026-02-17 | 13F | Ameriprise Financial Inc | 344.791 | -28,31 | 6.923 | -47,23 | ||||
| 2026-02-17 | 13F | State Of Wisconsin Investment Board | 229.492 | -8,17 | 4.608 | -32,40 | ||||
| 2026-01-29 | 13F | IMC-Chicago, LLC | 62.383 | -89,35 | 1.253 | -92,17 | ||||
| 2026-01-29 | 13F | IMC-Chicago, LLC | Put | 2.551.900 | 10,72 | 51.242 | -18,50 | |||
| 2026-02-13 | 13F | Headlands Technologies LLC | 0 | -100,00 | 0 | -100,00 |