Grundlæggende statistik
| Institutionelle aktier (lange) | 146.211.690 - 58,90% (ex 13D/G) - change of -45,94MM shares -23,92% MRQ |
| Institutionel værdi (lang) | $ 1.855.650 USD ($1000) |
Institutionelt ejerskab og aktionærer
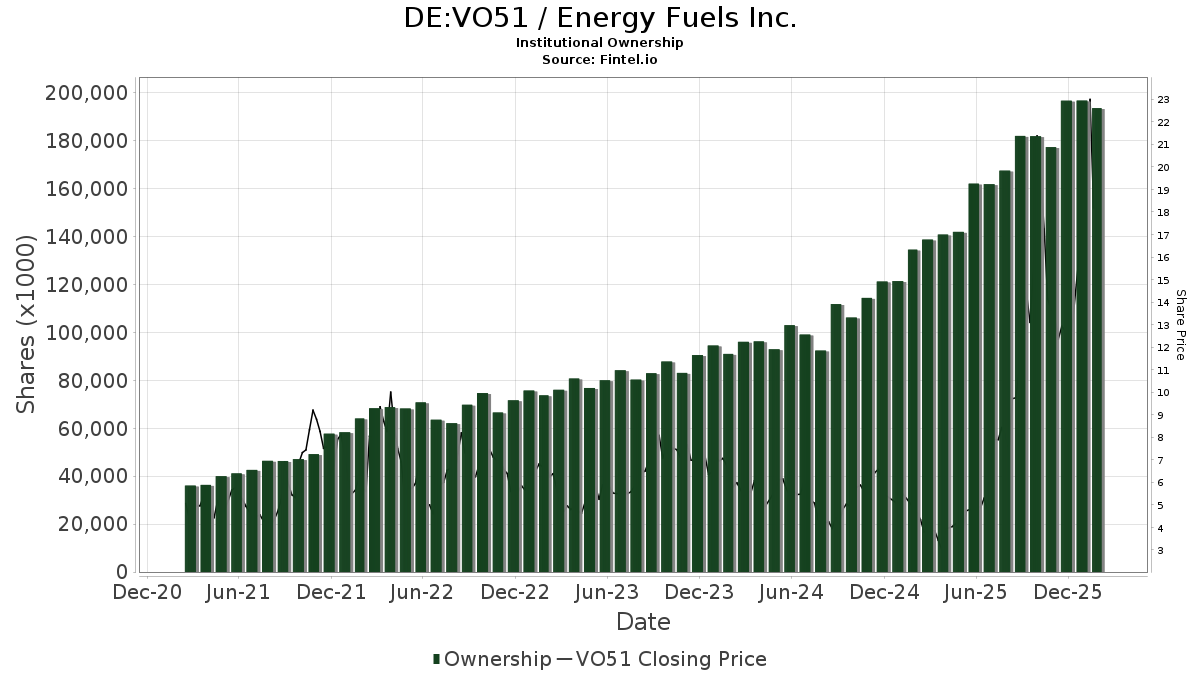
Energy Fuels Inc. (DE:VO51) har 346 institutionelle ejere og aktionærer, der har indsendt 13D/G- eller 13F-formularer til Securities Exchange Commission (SEC). Disse institutioner har i alt 146,211,690 aktier. Største aktionærer omfatter Vanguard Group Inc, BlackRock, Inc., MIRAE ASSET GLOBAL ETFS HOLDINGS Ltd., Van Eck Associates Corp, Susquehanna International Group, Llp, D. E. Shaw & Co., Inc., Alps Advisors Inc, Price T Rowe Associates Inc /md/, Wells Fargo & Company/mn, and Susquehanna International Group, Llp .
Energy Fuels Inc. (DB:VO51) institutionel ejerskabsstruktur viser aktuelle positioner i virksomheden efter institutioner og fonde, samt seneste ændringer i positionsstørrelse. Større aktionærer kan omfatte individuelle investorer, investeringsforeninger, hedgefonde eller institutioner. Skema 13D angiver, at investoren besidder (eller besidder) mere end 5 % af virksomheden og har til hensigt (eller har til hensigt at) aktivt at forfølge en ændring i forretningsstrategi. Skema 13G indikerer en passiv investering på over 5%.
The share price as of April 28, 2026 is 17,54 / share. Previously, on April 29, 2025, the share price was 4,08 / share. This represents an increase of 329,60% over that period.
Fondens stemningsscore
Fund Sentiment Score (fka Ownership Accumulation Score) finder de aktier, der bliver mest købt af fonde. Det er resultatet af en sofistikeret, multi-faktor kvantitativ model, der identificerer virksomheder med de højeste niveauer af institutionel akkumulering. Scoringsmodellen bruger en kombination af den samlede stigning i oplyste ejere, ændringerne i porteføljeallokeringer i disse ejere og andre målinger. Tallet går fra 0 til 100, hvor højere tal indikerer et højere niveau af akkumulering for sine jævnaldrende, og 50 er gennemsnittet.
Opdateringsfrekvens: Dagligt
Se Ownership Explorer, som giver en liste over højest rangerende virksomheder.
AI+ Ask Fintel’s AI assistant about Energy Fuels Inc..
Select a question to share a public post with an AI-crafted answer.
Thinking of good questions…
13F og NPORT arkivering
Detaljer om 13F-arkivering er gratis. Detaljer om NP-ansøgninger kræver et premium-medlemskab. Grønne rækker angiver nye positioner. Røde rækker angiver lukkede positioner. Klik på linket ikon for at se den fulde transaktionshistorik.
Opgrader
for at låse premium-data op og eksportere til Excel ![]() .
.
| Fil dato | Kilde | Investor | Type | Gennemsnitlig pris (Øst) |
Aktier | Δ Aktier (%) |
Rapporteret Værdi ($1000) |
Δ Værdi (%) |
Port Alloc (%) |
|
|---|---|---|---|---|---|---|---|---|---|---|
| 2026-02-17 | 13F | Russell Investments Group, Ltd. | 63.996 | 41,42 | 930 | 33,86 | ||||
| 2026-01-23 | 13F | Avion Wealth | 1.600 | 0 | ||||||
| 2026-01-15 | 13F | Nisa Investment Advisors, Llc | 4.693 | 71,72 | 68 | 65,85 | ||||
| 2026-02-11 | 13F | Los Angeles Capital Management Llc | 22.790 | 497 | ||||||
| 2026-02-11 | 13F | Parallel Advisors, LLC | 3.518 | -1,59 | 51 | -5,56 | ||||
| 2026-02-13 | 13F | Kestra Advisory Services, LLC | 0 | -100,00 | 0 | |||||
| 2026-04-29 | 13F | CVA Family Office, LLC | 66 | 1 | ||||||
| 2026-04-02 | 13F | Hilltop National Bank | 3.080 | -11,49 | 56 | 12,00 | ||||
| 2026-04-22 | 13F | Joel Isaacson & Co., LLC | 0 | -100,00 | 0 | |||||
| 2026-04-13 | 13F | IFP Advisors, Inc | 1.386 | -80,68 | 25 | -75,96 | ||||
| 2025-11-14 | 13F | Ieq Capital, Llc | 0 | -100,00 | 0 | |||||
| 2026-02-12 | 13F | Wealthspire Advisors, LLC | 0 | -100,00 | 0 | -100,00 | ||||
| 2026-02-12 | 13F | Hollencrest Capital Management | 8.680 | 0,00 | 126 | -5,26 | ||||
| 2026-02-17 | 13F | DZ BANK AG Deutsche Zentral Genossenschafts Bank, Frankfurt am Main | 0 | -100,00 | 0 | -100,00 | ||||
| 2026-01-30 | 13F | Wealthfront Advisers Llc | 19.020 | 6,22 | 277 | 0,73 | ||||
| 2026-02-17 | 13F | Citadel Advisors Llc | Call | 3.500.300 | 33,96 | 50.894 | 26,89 | |||
| 2026-02-17 | 13F | Lionstone Capital Management LLC | 6.760 | 0,00 | 98 | -4,85 | ||||
| 2026-02-17 | 13F | Citadel Advisors Llc | 701.966 | -70,77 | 10.207 | -72,31 | ||||
| 2026-02-17 | 13F | Citadel Advisors Llc | Put | 3.250.500 | 81,87 | 47.262 | 72,27 | |||
| 2026-02-13 | 13F | Neuberger Berman Group LLC | 23.831 | 346 | ||||||
| 2025-11-14 | 13F | Two Sigma Securities, Llc | 0 | -100,00 | 0 | |||||
| 2026-04-15 | 13F | Activest Wealth Management | 0 | 0 | ||||||
| 2026-02-17 | 13F | Investment Management Corp of Ontario | 29.078 | 423 | ||||||
| 2026-02-17 | 13F | Scopus Asset Management, L.p. | Call | 375.000 | 50,00 | 5.452 | 42,09 | |||
| 2026-03-13 | 13F | ARP Global Capital Ltd | 68.722 | 999 | ||||||
| 2026-02-12 | 13F | Skopos Labs, Inc. | 0 | -100,00 | 0 | |||||
| 2026-02-17 | 13F | Bank Of America Corp /de/ | Call | 0 | -100,00 | 0 | -100,00 | |||
| 2026-04-15 | 13F | Register Financial Advisors LLC | 13.500 | 0,00 | 246 | 25,51 | ||||
| 2026-04-16 | 13F | Stanley-Laman Group, Ltd. | 315.085 | -3,72 | 5.750 | 20,85 | ||||
| 2026-02-13 | 13F | Verition Fund Management LLC | 85.326 | -9,66 | 1.241 | -14,42 | ||||
| 2026-02-10 | 13F | Rothschild Investment Llc | 338 | 0,90 | 5 | -20,00 | ||||
| 2026-04-23 | 13F | SJS Investment Consulting Inc. | 608 | 11 | ||||||
| 2026-02-13 | 13F | Toroso Investments, LLC | Call | 72.500 | 1.054 | |||||
| 2026-02-13 | 13F | Toroso Investments, LLC | 14.633 | 213 | ||||||
| 2026-02-11 | 13F | Winton Capital Group Ltd | 158.503 | -6,65 | 2.305 | -11,59 | ||||
| 2026-02-17 | 13F | Integrity Wealth Advisors, Inc. | 72.675 | -80,84 | 1.057 | -74,01 | ||||
| 2025-11-07 | 13F | Texas Yale Capital Corp. | 0 | -100,00 | 0 | |||||
| 2026-02-11 | 13F | Cedar Mountain Advisors, LLC | 500 | 0,00 | 7 | 0,00 | ||||
| 2026-02-17 | 13F | Integrity Wealth Advisors, Inc. | Call | 45.500 | 662 | |||||
| 2026-02-23 | 13F | Virtu Financial LLC | 63.965 | -64,32 | 1 | -100,00 | ||||
| 2026-02-03 | 13F | Winch Advisory Services, LLC | 735 | 107,04 | 11 | 100,00 | ||||
| 2026-02-13 | 13F | State Street Corp | 3.688.397 | 5,54 | 53.629 | -0,03 | ||||
| 2026-02-17 | 13F | Man Group plc | 938.799 | 13.650 | ||||||
| 2025-11-06 | 13F | Abich Financial Wealth Management LLC | 0 | -100,00 | 0 | |||||
| 2026-02-27 | 13F | Strategic Investment Solutions, Inc. /IL | 0 | -100,00 | 0 | -100,00 | ||||
| 2026-01-14 | 13F | ORG Partners LLC | 2.865 | 18,88 | 42 | 2,50 | ||||
| 2026-02-09 | 13F | Jefferies Financial Group Inc. | 138.944 | 2.020 | ||||||
| 2026-02-13 | 13F | Landscape Capital Management, L.l.c. | 0 | -100,00 | 0 | |||||
| 2026-02-13 | 13F | Squarepoint Ops LLC | Put | 11.200 | 0,00 | 163 | -5,26 | |||
| 2026-02-06 | 13F | GPS Wealth Strategies Group, LLC | 0 | -100,00 | 0 | |||||
| 2026-02-12 | 13F | Sprott Inc. | 78.331 | -17,63 | 1.139 | -22,00 | ||||
| 2026-02-17 | 13F | Snowden Capital Advisors LLC | 10.546 | 153 | ||||||
| 2026-01-21 | 13F | Prime Capital Investment Advisors, LLC | 68.105 | 990 | ||||||
| 2026-02-17 | 13F | Tudor Investment Corp Et Al | Put | 31.600 | 459 | |||||
| 2026-02-17 | 13F | Tudor Investment Corp Et Al | Call | 23.100 | 336 | |||||
| 2026-02-17 | 13F | Asset One Wealth Management LLC | 27.083 | 569 | ||||||
| 2026-04-24 | 13F | Luminist Capital LLC | 0 | -100,00 | 0 | |||||
| 2026-02-17 | 13F | Tudor Investment Corp Et Al | 764.523 | 183,22 | 11.116 | 168,31 | ||||
| 2026-02-17 | 13F | XTX Topco Ltd | 0 | -100,00 | 0 | -100,00 | ||||
| 2026-01-07 | 13F | Aventura Private Wealth, LLC | 100 | 1 | ||||||
| 2025-11-06 | 13F | CloudAlpha Capital Management Limited/Hong Kong | 0 | -100,00 | 0 | |||||
| 2026-01-29 | 13F | D.a. Davidson & Co. | 30.698 | 5,01 | 446 | -0,45 | ||||
| 2026-02-10 | 13F | Envestnet Asset Management Inc | 0 | -100,00 | 0 | |||||
| 2025-11-14 | 13F | Weiss Asset Management LP | 32.127 | 493 | ||||||
| 2026-02-09 | 13F | Jefferies Financial Group Inc. | Call | 16.500 | 240 | |||||
| 2025-11-14 | 13F | Wolverine Trading, Llc | Call | 754.000 | 195,69 | 12.456 | 780,28 | |||
| 2025-11-14 | 13F | Wolverine Trading, Llc | Put | 457.000 | 103,56 | 7.550 | 506,35 | |||
| 2026-04-21 | 13F | SLT Holdings LLC | 23.400 | 48,10 | 427 | 86,46 | ||||
| 2026-02-11 | 13F | Ameritas Investment Partners, Inc. | 18.870 | 274 | ||||||
| 2026-02-13 | 13F | Marshall Wace, Llp | 0 | -100,00 | 0 | |||||
| 2026-04-28 | 13F | Robertson Stephens Wealth Management, LLC | 942.600 | -43,83 | 17.202 | -29,50 | ||||
| 2025-11-21 | 13F/A | CIBC Bancorp USA Inc. | 22.882 | 351 | ||||||
| 2026-02-13 | 13F | OMERS ADMINISTRATION Corp | 0 | -100,00 | 0 | |||||
| 2026-02-24 | 13F | Bell Investment Advisors, Inc | 0 | -100,00 | 0 | |||||
| 2025-11-13 | 13F | Total Investment Management Inc | 0 | -100,00 | 0 | |||||
| 2026-02-10 | 13F | Savant Capital, LLC | 0 | -100,00 | 0 | |||||
| 2026-02-13 | 13F | Wexford Capital Lp | 5.766 | 11,90 | 84 | 5,06 | ||||
| 2025-11-14 | 13F | Wolverine Trading, Llc | 160.902 | 55,21 | 2.658 | 362,26 | ||||
| 2026-02-06 | 13F | EverSource Wealth Advisors, LLC | 783 | 6,24 | 11 | 0,00 | ||||
| 2026-02-17 | 13F | SIG North Trading, ULC | Put | 85.800 | 98,61 | 1.248 | 88,08 | |||
| 2026-04-24 | 13F | Private Advisor Group, LLC | Call | 0 | -100,00 | 0 | ||||
| 2026-02-17 | 13F | SIG North Trading, ULC | Call | 69.700 | -60,03 | 1.013 | -62,16 | |||
| 2026-02-12 | 13F | New York State Common Retirement Fund | 72.052 | 9,42 | 1.048 | 3,66 | ||||
| 2026-02-13 | 13F | SPX Equities Gestao de Recursos Ltda | 0 | -100,00 | 0 | -100,00 | ||||
| 2026-02-17 | 13F | SIG North Trading, ULC | 92.209 | -54,71 | 1.341 | -57,12 | ||||
| 2026-01-05 | 13F | Foguth Wealth Management, LLC. | 0 | -100,00 | 0 | |||||
| 2026-02-12 | 13F | Quadrant Capital Group Llc | 2.485 | 0,73 | 36 | -2,70 | ||||
| 2026-02-09 | 13F | Kingsview Wealth Management, LLC | 0 | -100,00 | 0 | |||||
| 2026-02-13 | 13F | University Of Texas/texas Am Investment Managment Co | 45 | 1 | ||||||
| 2026-02-12 | 13F | Steward Partners Investment Advisory, Llc | 16.478 | 143,15 | 240 | 129,81 | ||||
| 2026-01-23 | 13F | Assetmark, Inc | 108 | 0,00 | 2 | 0,00 | ||||
| 2026-01-30 | 13F | Us Bancorp \de\ | 236 | -93,54 | 3 | -94,64 | ||||
| 2026-04-27 | 13F | Y-Intercept (Hong Kong) Ltd | 0 | -100,00 | 0 | |||||
| 2026-02-11 | 13F | Empowered Funds, LLC | 12.154 | 177 | ||||||
| 2026-02-11 | 13F | Deltroit Asset Management (UK) LLP | 308.000 | 4.478 | ||||||
| 2026-02-17 | 13F | Agf Management Ltd | 22.750 | 330 | ||||||
| 2026-02-17 | 13F | Pinnacle Financial Partners, Inc. | 33.646 | 489 | ||||||
| 2026-02-13 | 13F | Charles Schwab Investment Management Inc | 568.212 | 6,56 | 8.262 | 0,94 | ||||
| 2026-02-13 | 13F | Stifel Financial Corp | 23.649 | 95,43 | 344 | 85,41 | ||||
| 2026-02-10 | 13F | State of Wyoming | 2.361 | 34 | ||||||
| 2026-04-20 | 13F | Banque Cantonale Vaudoise | 125.795 | 33,91 | 2.296 | 68,08 | ||||
| 2026-01-29 | 13F | UBS Group AG | Call | 585.100 | 8.507 | |||||
| 2026-02-09 | 13F | Hartland & Co., LLC | 0 | -100,00 | 0 | |||||
| 2026-01-29 | 13F | UBS Group AG | 1.447.379 | -2,70 | 21.045 | -7,84 | ||||
| 2026-02-13 | 13F | FORA Capital, LLC | 100.348 | 1.459 | ||||||
| 2026-02-10 | 13F | Exor Capital LLP | 96.900 | 1.409 | ||||||
| 2026-02-17 | 13F | Point72 Asset Management, L.P. | Put | 119.300 | 1.735 | |||||
| 2026-02-06 | 13F | Bare Financial Services, Inc | 260 | 220,99 | 4 | 200,00 | ||||
| 2025-11-14 | 13F | Fort Point Capital Partners LLC | 0 | -100,00 | 0 | |||||
| 2026-04-24 | 13F | Private Advisor Group, LLC | 144.508 | 119,57 | 2.637 | 175,84 | ||||
| 2026-02-17 | 13F | Point72 Asset Management, L.P. | Call | 285.600 | 4.153 | |||||
| 2026-02-17 | 13F | Prelude Capital Management, Llc | 65.900 | 137,07 | 958 | 124,88 | ||||
| 2026-02-17 | 13F | Caption Management, LLC | Call | 1.212.400 | 318,65 | 17.628 | 296,58 | |||
| 2026-01-28 | 13F | Universal- Beteiligungs- und Servicegesellschaft mbH | 140.004 | -55,77 | 2.005 | -58,78 | ||||
| 2026-02-03 | 13F | Legacy Wealth Managment, LLC/ID | 2 | 0 | ||||||
| 2026-02-17 | 13F | Toronto Dominion Bank | 64.897 | 940 | ||||||
| 2026-02-17 | 13F | Caption Management, LLC | 53.550 | -78,77 | 779 | -79,90 | ||||
| 2026-04-27 | 13F | Koshinski Asset Management, Inc. | 29.600 | 0,65 | 540 | 26,46 | ||||
| 2026-02-17 | 13F | Caption Management, LLC | Put | 487.600 | -4,88 | 7.090 | -9,90 | |||
| 2026-02-10 | 13F | CIBC World Markets Inc. | 23.011 | -4,26 | 335 | -9,24 | ||||
| 2026-02-17 | 13F | Royal Bank Of Canada | Put | 657.000 | 0,00 | 9.553 | -5,28 | |||
| 2026-02-17 | 13F | Royal Bank Of Canada | 544.368 | -72,73 | 7.916 | -74,16 | ||||
| 2026-02-17 | 13F | Aqr Capital Management Llc | 270.525 | 1,88 | 3.933 | -3,48 | ||||
| 2026-02-17 | 13F | Northern Trust Corp | 693.051 | -44,66 | 10.077 | -47,58 | ||||
| 2026-02-04 | 13F | LRI Investments, LLC | 42 | 1 | ||||||
| 2026-02-17 | 13F | Orion Resource Partners LP | 0 | -100,00 | 0 | |||||
| 2026-04-24 | 13F | Strs Ohio | 14.300 | 55,43 | 261 | 95,49 | ||||
| 2026-02-11 | 13F | Group One Trading, L.p. | Put | 1.350.500 | -31,76 | 19.636 | -35,36 | |||
| 2026-02-11 | 13F | Group One Trading, L.p. | Call | 2.789.500 | 86,56 | 40.559 | 76,72 | |||
| 2026-04-27 | 13F | Truist Financial Corp | 16.918 | 309 | ||||||
| 2026-04-28 | 13F | SBI Securities Co., Ltd. | 16.169 | 1,72 | 295 | 27,71 | ||||
| 2026-02-20 | 13F | Sunbelt Securities, Inc. | 75 | 0,00 | 1 | 0,00 | ||||
| 2026-02-05 | 13F/A | Fulcrum Asset Management LLP | 10.131 | -16,97 | 147 | -21,93 | ||||
| 2026-02-13 | 13F | BRITISH COLUMBIA INVESTMENT MANAGEMENT Corp | 125.996 | -6,28 | 1.825 | -11,59 | ||||
| 2026-02-17 | 13F | Old Mission Capital Llc | 89.043 | 1.295 | ||||||
| 2026-02-13 | 13F | Ubs Asset Management Americas Inc | 921 | 13 | ||||||
| 2026-02-03 | 13F | Maxi Investments CY Ltd | 15.000 | 0 | ||||||
| 2026-02-13 | 13F | Rhumbline Advisers | 308.535 | -8,54 | 4.486 | -13,36 | ||||
| 2026-01-22 | 13F | Brookwood Investment Group LLC | 17.825 | -1,11 | 259 | -6,16 | ||||
| 2026-02-13 | 13F | Polymer Capital Management (HK) LTD | 0 | -100,00 | 0 | |||||
| 2026-04-17 | 13F | AdvisorNet Financial, Inc | 703 | 40,60 | 13 | 71,43 | ||||
| 2026-02-13 | 13F | Walleye Capital LLC | Call | 67.200 | -13,29 | 977 | -17,83 | |||
| 2026-04-07 | 13F | Financially Speaking Inc | 300 | 0,00 | 5 | 25,00 | ||||
| 2026-02-13 | 13F | Walleye Capital LLC | Put | 129.500 | -32,73 | 1.883 | -36,29 | |||
| 2026-04-16 | 13F | Heck Capital Advisors, LLC | 12.435 | 227 | ||||||
| 2026-01-29 | 13F | Matisse Capital | 0 | -100,00 | 0 | |||||
| 2026-02-13 | 13F | Walleye Capital LLC | 71.865 | 1.447,15 | 1.045 | 1.370,42 | ||||
| 2026-04-22 | 13F | Onyx Bridge Wealth Group LLC | 10.674 | 0,00 | 195 | 25,16 | ||||
| 2026-04-10 | 13F | Shelter Rock Management, LLC | 12.100 | -12,16 | 221 | 10,00 | ||||
| 2026-04-27 | 13F | Tsfg, Llc | 200 | 0,00 | 0 | |||||
| 2026-02-19 | 13F | Mcguire Capital Advisors Inc | 1.858 | 27 | ||||||
| 2026-02-13 | 13F | Vontobel Holding Ltd. | Call | 37.300 | 540 | |||||
| 2026-02-13 | 13F | Vontobel Holding Ltd. | 33.866 | -18,87 | 491 | -23,44 | ||||
| 2026-02-03 | 13F | Strengthening Families & Communities, LLC | 0 | -100,00 | 0 | |||||
| 2026-04-08 | 13F | Sapient Capital Llc | 355.694 | 6.486 | ||||||
| 2025-11-13 | 13F | Glenmede Investment Management, LP | 22.613 | 347 | ||||||
| 2026-02-05 | 13F | Bessemer Group Inc | 3.654 | -67,10 | 0 | |||||
| 2026-02-09 | 13F | Legal & General Group Plc | 276.145 | 0,03 | 4.005 | -5,54 | ||||
| 2026-02-09 | 13F | Huntington National Bank | 251 | 0,00 | 4 | 0,00 | ||||
| 2026-04-07 | 13F | Farther Finance Advisors, LLC | 2.526 | 155,93 | 45 | 221,43 | ||||
| 2026-04-13 | 13F | Massmutual Trust Co Fsb/adv | 294 | 0,00 | 5 | 25,00 | ||||
| 2026-01-27 | 13F | Zurcher Kantonalbank (Zurich Cantonalbank) | 102.706 | -12,28 | 1.490 | -17,19 | ||||
| 2026-01-22 | 13F | Hager Investment Management Services, Llc | 50 | 0,00 | 1 | |||||
| 2026-04-22 | 13F | Stone House Investment Management, LLC | 1.181 | 0,00 | 22 | 23,53 | ||||
| 2026-02-12 | 13F | Jane Street Group, Llc | Call | 844.900 | 22,97 | 12.285 | 16,48 | |||
| 2026-02-12 | 13F | Jane Street Group, Llc | Put | 1.750.300 | 49,14 | 25.449 | 41,27 | |||
| 2026-02-12 | 13F | Jane Street Group, Llc | 3.573.063 | 51,42 | 51.952 | 43,43 | ||||
| 2026-02-12 | 13F | MetLife Investment Management, LLC | 126.176 | 1,49 | 1.835 | -3,88 | ||||
| 2026-02-17 | 13F | Millennium Management Llc | Call | 226.800 | -56,95 | 3.298 | -59,23 | |||
| 2026-02-17 | 13F | Millennium Management Llc | 223.256 | -47,78 | 3.246 | -50,54 | ||||
| 2026-04-29 | 13F | Rye Brook Capital LLC | 35.083 | 1 | ||||||
| 2026-02-17 | 13F | Fmr Llc | 221.966 | 61,47 | 3.222 | 52,70 | ||||
| 2026-02-13 | 13F | Manufacturers Life Insurance Company, The | 0 | -100,00 | 0 | |||||
| 2026-02-13 | 13F | MAI Capital Management | 626 | 8,68 | 9 | 12,50 | ||||
| 2026-02-06 | 13F | HighTower Advisors, LLC | 175.646 | -14,55 | 2.554 | -19,08 | ||||
| 2026-02-09 | 13F | Catalyst Funds Management Pty Ltd | 0 | -100,00 | 0 | -100,00 | ||||
| 2026-02-13 | 13F | Bridgewater Associates, LP | 341.533 | 18,43 | 4.966 | 12,18 | ||||
| 2026-02-13 | 13F | Pinpoint Asset Management (Singapore) Pte. Ltd. | 2.599 | -56,50 | 38 | -59,34 | ||||
| 2026-04-07 | 13F | Park Avenue Securities Llc | 19.683 | 0 | ||||||
| 2026-02-10 | 13F | Goldman Sachs Group Inc | 1.216.817 | -33,42 | 17.693 | -36,93 | ||||
| 2026-02-13 | 13F | Entropy Technologies, LP | 0 | -100,00 | 0 | |||||
| 2026-02-17 | 13F | Scientech Research LLC | 28.415 | -38,52 | 413 | -41,75 | ||||
| 2026-02-13 | 13F | Ausdal Financial Partners, Inc. | 19.623 | 19,89 | 285 | 13,55 | ||||
| 2026-02-17 | 13F | Advisor Group Holdings, Inc. | 41.361 | -53,67 | 601 | -55,18 | ||||
| 2026-02-17 | 13F | Signature Equity Partners, LLC | 7.467 | 109 | ||||||
| 2026-02-17 | 13F | Lombard Odier Asset Management (USA) Corp | 34.764 | 505 | ||||||
| 2026-02-10 | 13F | Once Capital Management, LLC | 60.000 | 809,09 | 872 | 763,37 | ||||
| 2026-04-15 | 13F | Silverlake Wealth Management Llc | 17.196 | 0,00 | 314 | 25,20 | ||||
| 2026-04-22 | 13F | Pictet Asset Management Holding SA | 49.066 | 10,46 | 897 | 39,13 | ||||
| 2026-02-13 | 13F | Sculptor Capital LP | 0 | -100,00 | 0 | -100,00 | ||||
| 2026-02-17 | 13F | Creative Planning | 68.897 | -3,52 | 1.002 | -8,67 | ||||
| 2026-02-12 | 13F | EAM Investors, LLC | 0 | -100,00 | 0 | |||||
| 2026-02-17 | 13F | Ameriprise Financial Inc | 4.297.432 | 75,26 | 62.485 | 66,01 | ||||
| 2026-02-05 | 13F | Peak Asset Management, LLC | 0 | -100,00 | 0 | |||||
| 2026-02-10 | 13F | PCJ Investment Counsel Ltd. | 72.980 | 1.057 | ||||||
| 2026-02-17 | 13F | Farringdon Capital, Ltd. | 0 | -100,00 | 0 | |||||
| 2026-02-11 | 13F | SOUTH STATE Corp | 990 | 14 | ||||||
| 2026-04-29 | 13F | Clare Market Investments LLC | 22.860 | 417 | ||||||
| 2026-02-13 | 13F | SRS Capital Advisors, Inc. | 3.511 | -40,97 | 51 | -43,96 | ||||
| 2026-04-27 | 13F | Sound Income Strategies, LLC | 4.100 | 17,14 | 74 | -3,95 | ||||
| 2026-02-13 | 13F | Pathstone Holdings, LLC | 0 | -100,00 | 0 | |||||
| 2026-02-17 | 13F | Optiver Holding B.V. | 200 | 3 | ||||||
| 2026-02-17 | 13F | Amundi | 0 | -100,00 | 0 | |||||
| 2026-02-11 | 13F | Franklin Resources Inc | 895.306 | 4.548,77 | 13.017 | 4.312,54 | ||||
| 2026-01-30 | 13F | Moody Aldrich Partners Llc | 0 | -100,00 | 0 | |||||
| 2026-04-24 | 13F | Root Financial Partners, LLC | 30 | 1 | ||||||
| 2026-04-10 | 13F | Abound Wealth Management | 450 | 0,00 | 8 | 33,33 | ||||
| 2026-02-18 | 13F | Vident Advisory, LLC | 1.306.288 | -10,97 | 18.993 | -15,67 | ||||
| 2026-02-17 | 13F | Jump Financial, LLC | 566.685 | 15,96 | 8.240 | 9,84 | ||||
| 2026-04-22 | 13F | Sterling Capital Management LLC | 6.173 | -38,50 | 113 | -22,76 | ||||
| 2026-02-05 | 13F | Allworth Financial LP | 10.690 | -4,31 | 155 | -9,36 | ||||
| 2026-02-17 | 13F | Advisory Services Network, LLC | 45.544 | 74,24 | 662 | 65,09 | ||||
| 2026-01-16 | 13F | Crewe Advisors LLC | 0 | -100,00 | 0 | -100,00 | ||||
| 2026-02-18 | 13F | Caitlin John, LLC | 2.701 | -3,54 | 39 | -7,14 | ||||
| 2026-02-06 | 13F | Global Retirement Partners, LLC | 1.082 | 233,95 | 16 | 275,00 | ||||
| 2026-02-12 | 13F | Bank Of Montreal /can/ | 774.803 | 4,54 | 11.222 | -1,35 | ||||
| 2026-02-11 | 13F | LPL Financial LLC | 221.640 | 68,37 | 3.223 | 59,50 | ||||
| 2026-04-29 | 13F | Seelaus Asset Management LLC | 30.690 | -0,32 | 560 | 25,28 | ||||
| 2026-02-04 | 13F | Knuff & Co LLC | 3.750 | 55 | ||||||
| 2026-02-17 | 13F/A | Cantor Fitzgerald, L. P. | 0 | -100,00 | 0 | -100,00 | ||||
| 2026-04-14 | 13F | Nova Wealth Management, Inc. | 185 | 0,00 | 3 | 50,00 | ||||
| 2026-02-06 | 13F | Verde Servicos Internacionais S.A. | 0 | -100,00 | 0 | |||||
| 2026-04-21 | 13F | Nemes Rush Group LLC | 1.600 | 0,00 | 29 | 26,09 | ||||
| 2026-02-17 | 13F | Graham Capital Management, L.P. | 11.080 | 161 | ||||||
| 2026-02-17 | 13F | Elequin Capital Lp | 678 | 10 | ||||||
| 2025-11-13 | 13F | Eisler Capital Management Ltd. | 59.898 | 937 | ||||||
| 2026-02-17 | 13F | Vennlight Capital Management, LP | 0 | -100,00 | 0 | -100,00 | ||||
| 2025-11-13 | 13F | Eisler Capital Management Ltd. | Call | 694.000 | 10.861 | |||||
| 2026-02-12 | 13F | Principal Securities, Inc. | 0 | -100,00 | 0 | |||||
| 2026-02-09 | 13F | Harbour Investments, Inc. | 1.736 | 74,47 | 25 | 66,67 | ||||
| 2026-02-12 | 13F | Hollencrest Capital Management | Call | 0 | -100,00 | 0 | -100,00 | |||
| 2026-02-06 | 13F | Pnc Financial Services Group, Inc. | 5.338 | -44,03 | 78 | -47,26 | ||||
| 2026-04-16 | 13F | SG Americas Securities, LLC | 1.010.166 | 36,63 | 18 | 80,00 | ||||
| 2026-02-10 | 13F/A | Northwestern Mutual Wealth Management Co | 1 | 0 | ||||||
| 2026-02-13 | 13F | National Bank Of Canada /fi/ | 264.207 | 60,28 | 3.819 | 51,33 | ||||
| 2026-04-28 | 13F | Bogart Wealth, LLC | 3.075 | -11,76 | 56 | 12,00 | ||||
| 2026-02-17 | 13F | Guardian Partners Inc. | 0 | -100,00 | 0 | |||||
| 2026-02-10 | 13F | Intech Investment Management Llc | 96.804 | 28,97 | 1.408 | 22,14 | ||||
| 2026-02-17 | 13F | Lazard Asset Management Llc | 0 | -100,00 | 0 | |||||
| 2026-02-06 | 13F | Covestor Ltd | 18 | 0,00 | 0 | |||||
| 2026-02-09 | 13F | White Pine Capital Llc | 77.460 | -27,92 | 1.126 | -31,72 | ||||
| 2026-02-09 | 13F | Keating Financial Advisory Services, Inc. | 149 | 2 | ||||||
| 2026-04-08 | 13F | Wealth Enhancement Advisory Services, Llc | 26.283 | -9,42 | 467 | -12,41 | ||||
| 2026-04-16 | 13F | Fortem Financial Group, Llc | 16.300 | 45,28 | 297 | 82,21 | ||||
| 2025-11-24 | 13F/A | Fulcrum Asset Management LLP | Put | 0 | -100,00 | 0 | -100,00 | |||
| 2026-02-04 | 13F | Bailard, Inc. | 14.309 | -66,55 | 208 | -68,29 | ||||
| 2026-04-13 | 13F | Lauer Wealth, LLC | 10.550 | 194 | ||||||
| 2026-02-04 | 13F | Versor Investments LP | 24.100 | 349 | ||||||
| 2026-02-04 | 13F | Atlantic Union Bankshares Corp | 780 | 11 | ||||||
| 2026-02-02 | 13F | Fifth Third Bancorp | 1.000 | 0,00 | 15 | -6,67 | ||||
| 2025-11-10 | 13F | Jupiter Asset Management Ltd | 0 | -100,00 | 0 | -100,00 | ||||
| 2026-04-16 | 13F | Toth Financial Advisory Corp | 50 | 1 | ||||||
| 2026-02-11 | 13F | Havemeyer Place LP | 29.145 | 424 | ||||||
| 2026-04-22 | 13F | Qp Wealth Management, Llc | 17.246 | 315 | ||||||
| 2026-02-09 | 13F | Geode Capital Management, Llc | 2.998.801 | 10,22 | 44.240 | 5,90 | ||||
| 2026-02-12 | 13F | Summit Financial, LLC | 1.024.428 | 0,16 | 14.895 | -5,12 | ||||
| 2026-02-17 | 13F | Worth Venture Partners, LLC | 13.020 | 189 | ||||||
| 2025-11-12 | 13F | HAP Trading, LLC | Call | 13.600 | 69 | |||||
| 2026-02-17 | 13F | Voloridge Investment Management, Llc | 1.363.923 | 19.831 | ||||||
| 2025-11-12 | 13F | HAP Trading, LLC | Put | 13.600 | 10 | |||||
| 2026-02-11 | 13F | Jpmorgan Chase & Co | 723.307 | -20,70 | 10.517 | -24,89 | ||||
| 2026-02-13 | 13F | Barclays Plc | Call | 75.000 | 0,00 | 1.090 | -5,30 | |||
| 2026-02-13 | 13F | Barclays Plc | 1.613.520 | 124,30 | 23.461 | 112,46 | ||||
| 2026-02-17 | 13F | Driehaus Capital Management Llc | 1.316.473 | -2,35 | 19.142 | -7,50 | ||||
| 2026-02-13 | 13F | Goehring & Rozencwajg Associates, LLC | 1.229.408 | 5,32 | 17.876 | -0,24 | ||||
| 2026-02-17 | 13F | Ancora Advisors, LLC | 800 | -20,00 | 12 | -26,67 | ||||
| 2026-01-30 | 13F | Smart Portfolios, LLC | 10.000 | 0,00 | 145 | -5,23 | ||||
| 2026-01-29 | 13F | Vanguard Group Inc | 14.978.848 | 26,05 | 217.449 | 19,20 | ||||
| 2026-02-10 | 13F | KERR FINANCIAL PLANNING Corp | 0 | -100,00 | 0 | |||||
| 2026-02-12 | 13F | Federated Hermes, Inc. | 96 | -85,28 | 1 | -90,00 | ||||
| 2026-04-08 | 13F | Wealth Enhancement Trust Services, Inc. | 500 | 9 | ||||||
| 2026-02-02 | 13F | Intact Investment Management Inc. | 147.400 | 90,93 | 2.135 | 80,08 | ||||
| 2026-02-12 | 13F/A | Pinebridge Investments Llc | 391.898 | 7.791 | ||||||
| 2025-11-14 | 13F | Hughes Financial Services, LLC | 0 | -100,00 | 0 | |||||
| 2026-04-23 | 13F | J.w. Cole Advisors, Inc. | 0 | -100,00 | 0 | |||||
| 2026-02-12 | 13F | Renaissance Technologies Llc | 0 | -100,00 | 0 | |||||
| 2026-02-17 | 13F | Wellington Management Group Llp | 437.447 | 2.177,30 | 6.360 | 2.063,27 | ||||
| 2026-01-27 | 13F | TD Waterhouse Canada Inc. | 30.574 | 1,66 | 442 | -5,16 | ||||
| 2026-02-17 | 13F | Two Sigma Advisers, Lp | 67.699 | 984 | ||||||
| 2026-02-03 | 13F | Sequoia Financial Advisors, LLC | 22.262 | 1,87 | 324 | -3,58 | ||||
| 2026-02-17 | 13F | Shay Capital LLC | Put | 0 | -100,00 | 0 | -100,00 | |||
| 2026-04-22 | 13F | Mindset Wealth Management, Llc | 300.200 | 2.872,28 | 5.479 | 3.652,05 | ||||
| 2026-02-17 | 13F | Public Employees Retirement System Of Ohio | 51.720 | -4,65 | 750 | -9,96 | ||||
| 2026-02-17 | 13F | Keebeck Alpha, LP | 0 | -100,00 | 0 | -100,00 | ||||
| 2026-04-06 | 13F | Versant Capital Management, Inc | 2.346 | 0,00 | 43 | 23,53 | ||||
| 2026-01-16 | 13F | FNY Investment Advisers, LLC | 0 | -100,00 | 0 | |||||
| 2026-02-12 | 13F | Voya Investment Management Llc | 40.334 | 5,37 | 586 | -0,17 | ||||
| 2026-04-06 | 13F | GAMMA Investing LLC | 1.522 | 36,62 | 28 | 68,75 | ||||
| 2026-02-11 | 13F | Motley Fool Wealth Management, LLC | 0 | -100,00 | 0 | -100,00 | ||||
| 2026-02-10 | 13F | Bank of New York Mellon Corp | 613.080 | 6,95 | 8.914 | 1,31 | ||||
| 2026-02-09 | 13F | Rhl Group, Llc | 263 | 4 | ||||||
| 2026-02-18 | 13F | NFP Retirement, Inc. | 13.500 | 12,50 | 196 | 6,52 | ||||
| 2026-02-13 | 13F | Van Eck Associates Corp | 12.108.694 | 18,77 | 176 | 12,82 | ||||
| 2026-02-13 | 13F | Walleye Trading LLC | Call | 344.100 | 1.515,49 | 5.003 | 1.434,66 | |||
| 2026-02-13 | 13F | Wells Fargo & Company/mn | Put | 2.432.000 | 710,67 | 35.361 | 667,88 | |||
| 2026-02-13 | 13F | Walleye Trading LLC | 162.339 | 381,39 | 2.360 | 356,48 | ||||
| 2026-02-13 | 13F | Wells Fargo & Company/mn | Call | 5.860.000 | 85.204 | |||||
| 2025-11-03 | 13F | Stonehage Fleming Financial Services Holdings Ltd | 0 | -100,00 | 0 | |||||
| 2026-02-13 | 13F | Walleye Trading LLC | Put | 262.400 | 143,19 | 3.815 | 130,37 | |||
| 2026-02-13 | 13F | Wells Fargo & Company/mn | 2.782.543 | 352,42 | 40.458 | 328,58 | ||||
| 2026-02-17 | 13F | Alliancebernstein L.p. | 252.192 | 9,56 | 3.667 | 3,76 | ||||
| 2026-02-17 | 13F | Bank Of America Corp /de/ | Put | 0 | -100,00 | 0 | -100,00 | |||
| 2026-02-17 | 13F | Susquehanna International Group, Llp | 1.260.737 | -81,10 | 18.331 | -82,10 | ||||
| 2026-01-22 | 13F | Harwood Advisory Group, LLC | 10 | 0,00 | 0 | |||||
| 2026-03-12 | 13F/A | Peak6 Llc | Call | 1.156.900 | -64,16 | 16.821 | -66,05 | |||
| 2026-02-17 | 13F | Susquehanna International Group, Llp | Put | 4.491.900 | 61,14 | 65.312 | 52,64 | |||
| 2026-02-17 | 13F | Susquehanna International Group, Llp | Call | 9.324.400 | 493,00 | 135.577 | 461,72 | |||
| 2026-03-12 | 13F/A | Peak6 Llc | Put | 13.400 | 1.240,00 | 195 | 1.193,33 | |||
| 2026-04-22 | 13F | Patriot Financial Group Insurance Agency, LLC | 0 | -100,00 | 0 | |||||
| 2026-03-16 | 13F/A | Rockefeller Capital Management L.P. | 20.916 | -70,30 | 304 | -71,85 | ||||
| 2026-02-17 | 13F | Cetera Investment Advisers | Call | 0 | -100,00 | 0 | ||||
| 2026-02-13 | 13F | Parkside Financial Bank & Trust | 125 | 0,00 | 2 | 0,00 | ||||
| 2026-02-09 | 13F | MMCAP International Inc. SPC | 357.225 | -2,11 | 5.194 | -7,27 | ||||
| 2026-02-13 | 13F | Natixis | 2.147 | -9,75 | 31 | -13,89 | ||||
| 2026-02-17 | 13F | Schonfeld Strategic Advisors LLC | 11.066 | -72,88 | 161 | -74,44 | ||||
| 2026-02-12 | 13F | Dimensional Fund Advisors Lp | 40.913 | -93,58 | 593 | -93,94 | ||||
| 2025-11-07 | 13F | Shell Asset Management Co | 3.400 | -99,55 | 0 | -100,00 | ||||
| 2026-04-06 | 13F | CX Institutional | 0 | -100,00 | 0 | |||||
| 2026-02-17 | 13F | Kemnay Advisory Services Inc. | 449 | 7 | ||||||
| 2026-02-03 | 13F | Pilgrim Partners Asia Pte Ltd | 6.600 | 96 | ||||||
| 2026-02-17 | 13F | Concentric Capital Strategies, LP | 0 | -100,00 | 0 | -100,00 | ||||
| 2026-04-07 | 13F | CoreCap Advisors, LLC | 600 | 20,00 | 11 | 42,86 | ||||
| 2026-02-13 | 13F | Morgan Stanley | 3.952.694 | 108,72 | 57.472 | 97,71 | ||||
| 2026-02-13 | 13F | Sei Investments Co | 24.129 | -60,28 | 351 | -62,45 | ||||
| 2026-02-17 | 13F | State Of Wisconsin Investment Board | 0 | -100,00 | 0 | -100,00 | ||||
| 2026-02-11 | 13F | CenterBook Partners LP | 705.108 | 10.252 | ||||||
| 2026-02-12 | 13F | Monashee Investment Management LLC | 0 | -100,00 | 0 | |||||
| 2026-02-09 | 13F | Themes Management Co LLC | 19.829 | 288 | ||||||
| 2026-04-16 | 13F | Azarias Capital Management, L.P. | 380.528 | -9,19 | 6.945 | 13,99 | ||||
| 2026-02-12 | 13F | Nuveen, LLC | 690.010 | 17,06 | 10.027 | 10,80 | ||||
| 2026-02-10 | 13F | Quantbot Technologies LP | 36.835 | 320,78 | 536 | 299,25 | ||||
| 2026-04-13 | 13F | Wolff Wiese Magana Llc | 2.000 | 0,00 | 36 | 24,14 | ||||
| 2025-11-13 | 13F | Hsbc Holdings Plc | 0 | -100,00 | 0 | -100,00 | ||||
| 2026-04-16 | 13F | SG Americas Securities, LLC | Put | 215.000 | -2,27 | 0 | -100,00 | |||
| 2025-11-14 | 13F | Cubist Systematic Strategies, LLC | Put | 171.900 | 2.639 | |||||
| 2026-04-16 | 13F | SG Americas Securities, LLC | Call | 40.000 | 0,00 | 0 | ||||
| 2026-04-27 | 13F | Counterpoint Mutual Funds LLC | 31.909 | 54,40 | 582 | 94,00 | ||||
| 2025-11-14 | 13F | Cubist Systematic Strategies, LLC | Call | 287.400 | 4.412 | |||||
| 2026-04-27 | 13F | Bulltick Wealth Management, LLC | 31.000 | 566 | ||||||
| 2025-11-10 | 13F | Kovitz Investment Group Partners, LLC | 0 | -100,00 | 0 | |||||
| 2026-02-13 | 13F | Baird Financial Group, Inc. | 549.401 | -15,48 | 7.988 | -19,94 | ||||
| 2026-02-17 | 13F | Capital Fund Management S.a. | Put | 41.600 | 605 | |||||
| 2026-02-17 | 13F | MIRAE ASSET GLOBAL ETFS HOLDINGS Ltd. | 13.768.894 | 12,43 | 199.694 | 6,17 | ||||
| 2026-02-17 | 13F | Capital Fund Management S.a. | Call | 142.100 | 2.066 | |||||
| 2026-04-07 | 13F | G&S Capital LLC | 23.278 | 0,00 | 425 | 25,44 | ||||
| 2026-01-29 | 13F | IMC-Chicago, LLC | 34.689 | -77,82 | 504 | -79,00 | ||||
| 2026-01-09 | 13F | Silvia Mccoll Wealth Management, Llc | 0 | -100,00 | 0 | |||||
| 2026-01-29 | 13F | IMC-Chicago, LLC | Put | 940.400 | 64,52 | 13.673 | 55,84 | |||
| 2026-01-29 | 13F | IMC-Chicago, LLC | Call | 1.464.600 | 127,14 | 21.295 | 115,17 | |||
| 2026-02-12 | 13F | Alps Advisors Inc | 8.381.026 | -37,76 | 121.860 | -41,04 | ||||
| 2026-01-29 | 13F | Concord Wealth Partners | 1.150 | 64,29 | 17 | 60,00 | ||||
| 2026-02-05 | 13F | Western Wealth Management, LLC | 0 | -100,00 | 0 | |||||
| 2026-04-29 | 13F/A | Salem Investment Counselors Inc | 100 | 2 | ||||||
| 2026-02-10 | 13F | Foundations Investment Advisors, LLC | 56.464 | -43,88 | 821 | -46,89 | ||||
| 2026-02-13 | 13F | Prudential Financial Inc | 14.090 | -49,03 | 205 | -51,89 | ||||
| 2026-02-17 | 13F | Balyasny Asset Management Llc | 324.478 | 1.122,32 | 4.715 | 1.058,23 | ||||
| 2026-02-12 | 13F | Marex Group plc | 0 | -100,00 | 0 | -100,00 | ||||
| 2026-02-18 | 13F | Mackenzie Financial Corp | 59.806 | 45,67 | 848 | 34,60 | ||||
| 2026-02-17 | 13F | Quantinno Capital Management LP | 41.294 | 178,32 | 600 | 164,32 | ||||
| 2026-04-14 | 13F | Tradewinds Capital Management, LLC | 130 | 0,00 | 2 | 100,00 | ||||
| 2026-02-17 | 13F | Capstone Investment Advisors, Llc | 0 | -100,00 | 0 | -100,00 | ||||
| 2026-02-17 | 13F | ExodusPoint Capital Management, LP | 0 | -100,00 | 0 | -100,00 | ||||
| 2026-02-11 | 13F | Capital Research Global Investors | 0 | -100,00 | 0 | -100,00 | ||||
| 2026-02-17 | 13F | Quadrature Capital Ltd | 114.768 | 1.669 | ||||||
| 2026-02-13 | 13F | Smartleaf Asset Management LLC | 1.757 | 75,88 | 25 | 50,00 | ||||
| 2026-02-13 | 13F | Mariner, LLC | 29.877 | 113,91 | 437 | 104,21 | ||||
| 2026-02-17 | 13F | Mirabella Financial Services Llp | 75.000 | 1.091 | ||||||
| 2026-02-12 | 13F | Skandinaviska Enskilda Banken AB (publ) | 0 | -100,00 | 0 | -100,00 | ||||
| 2026-02-13 | 13F | Diametric Capital, LP | 0 | -100,00 | 0 | -100,00 | ||||
| 2026-02-13 | 13F | Healthcare Of Ontario Pension Plan Trust Fund | 103.920 | 1.511 | ||||||
| 2026-02-13 | 13F | MYDA Advisors LLC | 0 | -100,00 | 0 | -100,00 | ||||
| 2026-04-21 | 13F | GHP Investment Advisors, Inc. | 288.879 | 5,89 | 5.272 | 32,93 | ||||
| 2026-02-11 | 13F | Deutsche Bank Ag\ | 180.623 | 4,82 | 2.626 | -0,72 | ||||
| 2026-02-12 | 13F | Cibc World Markets Corp | 15.119 | -41,09 | 220 | 48,98 | ||||
| 2026-02-12 | 13F | Xponance, Inc. | 17.752 | 4,71 | 258 | -0,77 | ||||
| 2025-11-14 | 13F | PineBridge Investments, L.P. | 480.123 | 10.260 | ||||||
| 2026-02-17 | 13F | Jain Global LLC | 37.306 | 61,54 | 541 | 52,82 | ||||
| 2026-02-12 | 13F | Swiss National Bank | 456.900 | 3,46 | 6.631 | -2,24 | ||||
| 2026-04-15 | 13F | Compagnie Lombard Odier SCmA | 1.440 | 26 | ||||||
| 2026-04-07 | 13F | Signaturefd, Llc | 11.334 | 2,00 | 207 | 27,95 | ||||
| 2026-04-02 | 13F | Noble Wealth Management PBC | 200 | 0,00 | 4 | 50,00 | ||||
| 2026-04-29 | 13F | Police & Firemen's Retirement System of New Jersey | 63.840 | 3,21 | 1.165 | 29,59 | ||||
| 2026-02-17 | 13F | Raymond James Financial Inc | 227.684 | 114,80 | 3.311 | 103,44 | ||||
| 2026-02-12 | 13F | CIBC Private Wealth Group, LLC | 180.331 | 0,07 | 2.622 | -5,21 | ||||
| 2026-02-11 | 13F | Simplex Trading, Llc | Call | 2.053.800 | 120,74 | 29.862 | 213.200,00 | |||
| 2026-02-11 | 13F | Simplex Trading, Llc | Put | 1.292.000 | 6,90 | 18.786 | 104.261,11 | |||
| 2026-02-11 | 13F | Simplex Trading, Llc | 98.095 | -78,10 | 1.426 | 23.666,67 | ||||
| 2026-02-12 | 13F | Commonwealth Equity Services, Llc | 17.076 | 9,62 | 248 | |||||
| 2026-02-17 | 13F | California State Teachers Retirement System | 14.069 | 7,90 | 205 | 2,00 | ||||
| 2026-02-13 | 13F | Caitong International Asset Management Co., Ltd | 0 | -100,00 | 0 | -100,00 | ||||
| 2026-02-17 | 13F | Hood River Capital Management LLC | 56.000 | 814 | ||||||
| 2026-02-11 | 13F | Group One Trading, L.p. | 0 | -100,00 | 0 | -100,00 | ||||
| 2026-02-06 | 13F | Tortoise Investment Management, LLC | 0 | -100,00 | 0 | |||||
| 2026-04-13 | 13F | True Wealth Design, LLC | 662 | 0,00 | 12 | 33,33 | ||||
| 2026-02-13 | 13F | National Bank Of Canada /fi/ | Call | 0 | -100,00 | 0 | ||||
| 2026-02-17 | 13F | Cape Investment Advisory, Inc. | 470 | 7 | ||||||
| 2025-11-06 | 13F | Wedbush Securities Inc | 0 | -100,00 | 0 | |||||
| 2026-02-17 | 13F | Cresset Asset Management, LLC | 57.645 | -16,76 | 838 | -21,09 | ||||
| 2026-02-18 | 13F | GWM Advisors LLC | 28.898 | -27,67 | 420 | -31,48 | ||||
| 2026-02-09 | 13F | Wcm Investment Management, Llc | 323.002 | 4.590 | ||||||
| 2026-02-12 | 13F | Rossby Financial, LCC | 13.800 | -28,50 | 201 | -33,99 | ||||
| 2025-11-14 | 13F | Squarepoint Ops LLC | 0 | -100,00 | 0 | -100,00 | ||||
| 2026-02-03 | 13F | Ballentine Partners, LLC | 10.793 | -8,47 | 157 | -13,81 | ||||
| 2025-11-07 | 13F | Synovus Financial Corp | 39.711 | 29,93 | 610 | 248,00 | ||||
| 2026-02-04 | 13F | Ameritas Advisory Services, LLC | 0 | -100,00 | 0 | -100,00 | ||||
| 2026-02-06 | 13F | Larson Financial Group LLC | 500 | 0,00 | 7 | 0,00 | ||||
| 2025-11-13 | 13F | Strategic Financial Concepts, LLC | 0 | -100,00 | 0 | |||||
| 2026-01-28 | 13F | Eagle Global Advisors Llc | 13.600 | 0,74 | 198 | -4,83 | ||||
| 2026-01-28 | 13F | N.E.W. Advisory Services LLC | 53 | 1 | ||||||
| 2026-04-28 | 13F | Abel Hall, LLC | 13.737 | 6,65 | 251 | 33,69 | ||||
| 2026-02-17 | 13F | Massar Capital Management, LP | 192.020 | 562,14 | 2.792 | 527,19 | ||||
| 2026-02-10 | 13F | Bnp Paribas Arbitrage, Sa | 1.617.873 | -40,67 | 23.524 | -43,80 | ||||
| 2026-02-12 | 13F | State Board Of Administration Of Florida Retirement System | 44.958 | 0,00 | 654 | -5,36 | ||||
| 2026-04-22 | 13F | Janney Montgomery Scott LLC | 52.300 | 9,98 | 1 | |||||
| 2026-02-17 | 13F | Brevan Howard Capital Management LP | 16.528 | -98,02 | 243 | -98,18 | ||||
| 2026-04-21 | 13F | Financial Consulate, Inc | 1.275 | -7,27 | 23 | 21,05 | ||||
| 2026-02-17 | 13F | Jones Financial Companies Lllp | 15.872 | 78,34 | 231 | 55,41 | ||||
| 2026-02-17 | 13F | Two Sigma Investments, Lp | Put | 28.900 | 19,92 | 420 | 13,82 | |||
| 2026-04-07 | 13F | Signaturefd, Llc | Call | 4.000 | 22 | |||||
| 2026-02-17 | 13F | Two Sigma Investments, Lp | Call | 29.000 | 107,14 | 422 | 96,73 | |||
| 2026-02-10 | 13F | CIBC Asset Management Inc | 220.395 | 12,95 | 3.194 | 6,75 | ||||
| 2026-02-17 | 13F | Two Sigma Investments, Lp | 878.075 | 7.810,59 | 12.767 | 7.410,00 | ||||
| 2026-02-13 | 13F | Marathon Trading Investment Management LLC | 17.500 | 254 | ||||||
| 2026-01-23 | 13F | Optima Capital Llc | 59 | 1 | ||||||
| 2025-11-14 | 13F | Integrated Wealth Concepts LLC | 0 | -100,00 | 0 | |||||
| 2026-02-17 | 13F | Clough Capital Partners L P | 0 | -100,00 | 0 | -100,00 | ||||
| 2025-11-14 | 13F | Peak6 Llc | 0 | -100,00 | 0 | -100,00 | ||||
| 2026-02-06 | 13F | FourThought Financial Partners, LLC | 0 | -100,00 | 0 | -100,00 | ||||
| 2026-02-13 | 13F | Headlands Technologies LLC | 0 | -100,00 | 0 | -100,00 | ||||
| 2026-02-17 | 13F | Engineers Gate Manager LP | 36.901 | 537 | ||||||
| 2026-02-05 | 13F | Tucker Asset Management Llc | 1.240 | 18 | ||||||
| 2026-02-17 | 13F | EFG International AG | 2.500 | 36 | ||||||
| 2026-02-17 | 13F | Strive Financial Group ,LLC | 184 | 3 | ||||||
| 2026-02-17 | 13F | Lighthouse Investment Partners, LLC | 275.000 | 3.998 | ||||||
| 2025-11-14 | 13F | Sherbrooke Park Advisers Llc | 0 | -100,00 | 0 | -100,00 | ||||
| 2026-02-05 | 13F | Amalgamated Bank | 7.180 | 10,56 | 0 | |||||
| 2025-11-10 | 13F | X-Square Capital, LLC | 0 | -100,00 | 0 | |||||
| 2026-01-28 | 13F | Geneos Wealth Management Inc. | 2.459 | -25,46 | 36 | -30,00 | ||||
| 2026-02-05 | 13F | Baader Bank INC | 0 | -100,00 | 0 | |||||
| 2026-03-02 | 13F | Tobam | 6.168 | 0 | ||||||
| 2026-04-08 | 13F | Dynamic Advisor Solutions LLC | 21.029 | 2,17 | 384 | 28,09 | ||||
| 2026-04-28 | 13F | Alberta Investment Management Corp | 63.638 | 1.167 | ||||||
| 2026-02-17 | 13F | Polymer Capital Management (US) LLC | 0 | -100,00 | 0 | -100,00 | ||||
| 2026-02-09 | 13F | Koesten, Hirschmann & Crabtree, INC. | 0 | -100,00 | 0 | |||||
| 2026-02-13 | 13F | JustInvest LLC | 21.569 | 36,08 | 314 | 28,81 | ||||
| 2026-02-17 | 13F | Susquehanna Advisors Group, Inc. | 101.900 | 1.482 | ||||||
| 2026-04-22 | 13F | Matauro, Llc | 0 | -100,00 | 0 | |||||
| 2026-02-04 | 13F | Swiss Life Asset Management Ltd | 11.067 | 0,00 | 160 | -5,88 | ||||
| 2026-02-13 | 13F | Gts Securities Llc | 13.479 | -76,39 | 196 | -77,74 | ||||
| 2025-11-14 | 13F | Adams Wealth Management | 0 | -100,00 | 0 | |||||
| 2025-11-17 | 13F | CacheTech Inc. | 0 | -100,00 | 0 | |||||
| 2026-02-17 | 13F | Cetera Investment Advisers | 132.425 | -21,58 | 1.925 | -25,70 | ||||
| 2026-02-17 | 13F | Parallax Volatility Advisers, L.P. | 29.327 | -82,07 | 426 | -83,03 | ||||
| 2026-02-13 | 13F | Colony Group, LLC | 1.327.928 | 3,63 | 20.335 | 3,37 | ||||
| 2026-02-19 | 13F | Invesco Ltd. | 163.968 | 47,86 | 2.384 | 40,07 | ||||
| 2026-02-05 | 13F | Cambridge Investment Research Advisors, Inc. | 99.444 | -36,39 | 1 | -50,00 | ||||
| 2026-02-17 | 13F | Parallax Volatility Advisers, L.P. | Call | 358.400 | 90,03 | 5.211 | 80,00 | |||
| 2026-02-09 | 13F | Boundless Plain Holdings Ltd | 109.769 | 1.596 | ||||||
| 2026-02-17 | 13F | Parallax Volatility Advisers, L.P. | Put | 53.800 | -27,40 | 782 | -31,22 | |||
| 2026-04-15 | 13F | FNY Investment Advisers, LLC | Call | 0 | -100,00 | 0 | ||||
| 2025-11-14 | 13F | Sig Brokerage, Lp | 0 | -100,00 | 0 | |||||
| 2026-04-15 | 13F | Covea Finance | 77.000 | 1.405 | ||||||
| 2026-02-17 | 13F | D. E. Shaw & Co., Inc. | Put | 300.000 | 0,00 | 4.346 | -5,65 | |||
| 2026-02-17 | 13F | D. E. Shaw & Co., Inc. | 2.430.927 | 1.907,64 | 35.340 | 1.801,99 | ||||
| 2026-01-12 | 13F | Thompson Davis & Co., Inc. | 0 | -100,00 | 0 | |||||
| 2026-02-17 | 13F | Mercer Global Advisors Inc /adv | 15.980 | -10,50 | 232 | -15,33 | ||||
| 2026-02-10 | 13F | Connor, Clark & Lunn Investment Management Ltd. | 2.090.124 | 44,82 | 30.274 | 36,64 | ||||
| 2026-02-13 | 13F | DLD Asset Management, LP | Put | 675.000 | 9.777 | |||||
| 2026-02-13 | 13F | SIR Capital Management, L.P. | 0 | -100,00 | 0 | -100,00 | ||||
| 2026-04-08 | 13F | Accel Wealth Management | 33.953 | 15,01 | 620 | 44,29 | ||||
| 2026-02-04 | 13F | Independent Advisor Alliance | 12.480 | -34,64 | 181 | -38,23 | ||||
| 2026-04-20 | 13F | Kestra Private Wealth Services, Llc | 13.200 | -15,92 | 241 | 5,26 | ||||
| 2026-01-26 | 13F | Private Trust Co Na | 500 | 100,00 | 7 | 133,33 | ||||
| 2026-02-12 | 13F | Hrt Financial Lp | 11.800 | -98,94 | 0 | -100,00 | ||||
| 2026-04-28 | 13F | Golden State Equity Partners | 3.115 | 57 | ||||||
| 2026-02-02 | 13F | Principal Financial Group Inc | 10.813 | -29,67 | 157 | -33,19 | ||||
| 2026-04-14 | 13F | Bayshore Capital Advisors, LLC | 28.900 | 0,00 | 527 | 25,48 | ||||
| 2025-11-21 | 13F | Nebula Research & Development LLC | 0 | -100,00 | 0 | -100,00 | ||||
| 2026-01-26 | 13F | Cwm, Llc | 21.979 | 5,46 | 0 | |||||
| 2026-02-02 | 13F | Montag A & Associates Inc | 0 | -100,00 | 0 | |||||
| 2026-02-06 | 13F/A | Rathbone Brothers plc | 63.645 | -7,22 | 925 | -12,07 | ||||
| 2026-02-17 | 13F | D. E. Shaw & Co., Inc. | Call | 8.794.200 | 1.219,86 | 127.867 | 1.150,29 | |||
| 2026-02-17 | 13F | Magnetar Financial LLC | 0 | -100,00 | 0 | -100,00 | ||||
| 2026-02-11 | 13F | MCF Advisors LLC | 122 | 2 | ||||||
| 2026-02-11 | 13F | Meeder Asset Management Inc | 112 | -5,88 | 2 | 0,00 | ||||
| 2026-04-20 | 13F | Hilton Head Capital Partners, LLC | 45 | 0,00 | 1 | |||||
| 2026-01-29 | 13F | Teachers Retirement System Of The State Of Kentucky | 36.456 | 1 | ||||||
| 2025-11-12 | 13F | 111 Capital | 0 | -100,00 | 0 | -100,00 | ||||
| 2026-02-17 | 13F | Tower Research Capital LLC (TRC) | 25.852 | -46,94 | 376 | -49,80 | ||||
| 2026-04-22 | 13F | Spire Wealth Management | 350 | 133,33 | 6 | 200,00 | ||||
| 2026-04-24 | 13F | ProShare Advisors LLC | 34.075 | -18,42 | 622 | 2,31 | ||||
| 2026-02-12 | 13F | BlackRock, Inc. | 14.082.305 | 10,43 | 204.757 | 4,60 | ||||
| 2026-04-22 | 13F | Louisbourg Investments Inc. | 339.500 | 11,60 | 6.213 | 40,82 | ||||
| 2026-02-13 | 13F | First Trust Advisors Lp | 10.415 | 151 | ||||||
| 2026-02-10 | 13F | Axq Capital, Lp | 0 | -100,00 | 0 | |||||
| 2026-02-17 | 13F | Price T Rowe Associates Inc /md/ | 6.604.349 | -26,41 | 96 | -29,93 | ||||
| 2026-02-19 | 13F | CI Private Wealth, LLC | 48.042 | -26,51 | 684 | -31,90 | ||||
| 2026-04-27 | 13F | Leonteq Securities AG | 54.083 | 9,35 | 1.275 | 77,19 | ||||
| 2026-02-12 | 13F | Federation des caisses Desjardins du Quebec | 167.889 | -40,32 | 2.429 | -43,71 | ||||
| 2026-02-13 | 13F | Citigroup Inc | 652.909 | 500,13 | 9.469 | 467,01 | ||||
| 2026-04-13 | 13F | Gill Capital Partners, Llc | 100 | 2 | ||||||
| 2026-02-10 | 13F | Td Asset Management Inc | 1.733.338 | 7,58 | 25.139 | 1,58 | ||||
| 2026-02-13 | 13F | Quarry LP | 0 | -100,00 | 0 | -100,00 | ||||
| 2026-02-13 | 13F | Citigroup Inc | Call | 3.500.000 | 50.761 | |||||
| 2026-02-17 | 13F | Bank Of America Corp /de/ | 4.177.624 | 35,63 | 60.743 | 28,48 | ||||
| 2026-02-10 | 13F | Fielder Capital Group LLC | 115.847 | -49,83 | 1.684 | -52,48 | ||||
| 2026-04-15 | 13F | Fortitude Family Office, LLC | 72 | 0,00 | 1 | 0,00 |