Grundlæggende statistik
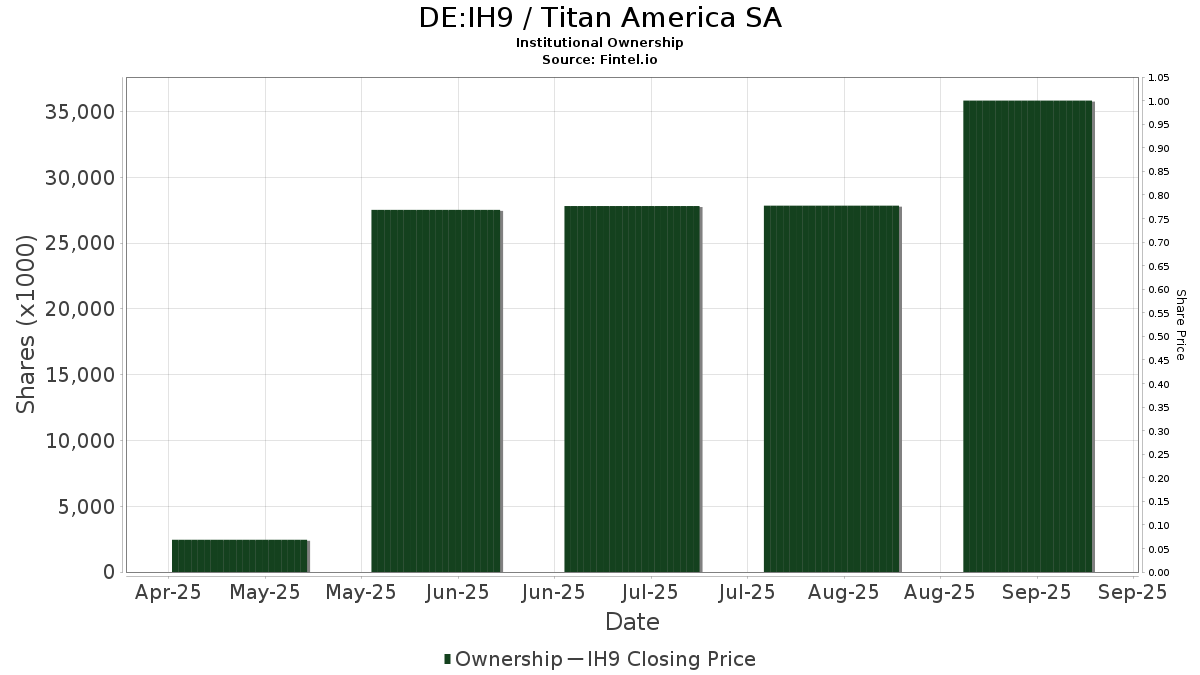
| Institutionelle aktier (lange) | 28.709.436 - 15,57% (ex 13D/G) - change of -4,70MM shares -14,07% MRQ |
| Institutionel værdi (lang) | $ 461.291 USD ($1000) |
Institutionelt ejerskab og aktionærer
Titan America SA (DE:IH9) har 97 institutionelle ejere og aktionærer, der har indsendt 13D/G- eller 13F-formularer til Securities Exchange Commission (SEC). Disse institutioner har i alt 28,709,436 aktier. Største aktionærer omfatter American Century Companies Inc, River Road Asset Management, LLC, Victory Capital Management Inc, Voss Capital, LLC, Allspring Global Investments Holdings, LLC, BlackRock, Inc., CastleKnight Management LP, Zimmer Partners, LP, Van Eck Associates Corp, and Franklin Resources Inc .
Titan America SA (DUSE:IH9) institutionel ejerskabsstruktur viser aktuelle positioner i virksomheden efter institutioner og fonde, samt seneste ændringer i positionsstørrelse. Større aktionærer kan omfatte individuelle investorer, investeringsforeninger, hedgefonde eller institutioner. Skema 13D angiver, at investoren besidder (eller besidder) mere end 5 % af virksomheden og har til hensigt (eller har til hensigt at) aktivt at forfølge en ændring i forretningsstrategi. Skema 13G indikerer en passiv investering på over 5%.
Fondens stemningsscore
Fund Sentiment Score (fka Ownership Accumulation Score) finder de aktier, der bliver mest købt af fonde. Det er resultatet af en sofistikeret, multi-faktor kvantitativ model, der identificerer virksomheder med de højeste niveauer af institutionel akkumulering. Scoringsmodellen bruger en kombination af den samlede stigning i oplyste ejere, ændringerne i porteføljeallokeringer i disse ejere og andre målinger. Tallet går fra 0 til 100, hvor højere tal indikerer et højere niveau af akkumulering for sine jævnaldrende, og 50 er gennemsnittet.
Opdateringsfrekvens: Dagligt
Se Ownership Explorer, som giver en liste over højest rangerende virksomheder.
AI+ Ask Fintel’s AI assistant about Titan America SA.
Select a question to share a public post with an AI-crafted answer.
Thinking of good questions…
13F og NPORT arkivering
Detaljer om 13F-arkivering er gratis. Detaljer om NP-ansøgninger kræver et premium-medlemskab. Grønne rækker angiver nye positioner. Røde rækker angiver lukkede positioner. Klik på linket ikon for at se den fulde transaktionshistorik.
Opgrader
for at låse premium-data op og eksportere til Excel ![]() .
.
| Fil dato | Kilde | Investor | Type | Gennemsnitlig pris (Øst) |
Aktier | Δ Aktier (%) |
Rapporteret Værdi ($1000) |
Δ Værdi (%) |
Port Alloc (%) |
|
|---|---|---|---|---|---|---|---|---|---|---|
| 2026-02-17 | 13F | Ancora Advisors, LLC | 229.170 | 22,21 | 3.777 | 34,81 | ||||
| 2026-02-09 | 13F | Geode Capital Management, Llc | 276.470 | -3,58 | 4.556 | 6,37 | ||||
| 2026-02-03 | 13F | Washington Trust Advisors, Inc. | 0 | -100,00 | 0 | |||||
| 2026-01-05 | 13F | GAMMA Investing LLC | 50 | 1 | ||||||
| 2026-02-17 | 13F | Fmr Llc | 1.850 | 11,65 | 30 | 25,00 | ||||
| 2026-02-17 | 13F | Royal Bank Of Canada | 1.866 | -99,73 | 31 | -99,70 | ||||
| 2025-11-14 | 13F | Soros Fund Management Llc | 0 | -100,00 | 0 | -100,00 | ||||
| 2026-01-23 | 13F | Private Wealth Management Group, LLC | 44 | 0,00 | 1 | |||||
| 2026-02-10 | 13F | Nomura Asset Management Co Ltd | 0 | 0 | ||||||
| 2026-02-13 | 13F | Stifel Financial Corp | 58.359 | -4,07 | 962 | 5,84 | ||||
| 2026-02-11 | 13F | Franklin Resources Inc | 578.584 | -14,94 | 9.535 | -6,17 | ||||
| 2026-02-17 | 13F | Millennium Management Llc | 121.967 | -66,33 | 2.010 | -62,86 | ||||
| 2026-02-19 | 13F | Invesco Ltd. | 515.426 | 3.319,76 | 8.494 | 3.675,11 | ||||
| 2026-02-17 | 13F | Citadel Advisors Llc | Call | 0 | -100,00 | 0 | ||||
| 2026-02-10 | 13F/A | Northwestern Mutual Wealth Management Co | 53 | 0,00 | 1 | |||||
| 2025-10-30 | 13F | Strs Ohio | 0 | -100,00 | 0 | |||||
| 2026-02-12 | 13F | MetLife Investment Management, LLC | 15.283 | 0,00 | 252 | 10,09 | ||||
| 2026-02-17 | 13F | Alliancebernstein L.p. | 18.200 | 12,35 | 300 | 23,55 | ||||
| 2026-02-17 | 13F | Bank Of America Corp /de/ | 327.145 | 3,38 | 5.391 | 14,05 | ||||
| 2026-02-13 | 13F | Barclays Plc | 55.825 | 11,88 | 920 | 23,36 | ||||
| 2026-02-13 | 13F | Police & Firemen's Retirement System of New Jersey | 5.328 | -30,57 | 88 | -23,68 | ||||
| 2026-02-13 | 13F | Heritage Wealth Advisors | 692 | 0,00 | 11 | 10,00 | ||||
| 2026-01-21 | 13F | Delphi Management Inc /ma/ | 27.615 | 31,03 | 0 | |||||
| 2026-02-17 | 13F | Ghisallo Capital Management LLC | 120.000 | -50,00 | 1.978 | -44,85 | ||||
| 2026-02-17 | 13F | Raymond James Financial Inc | 173.629 | -6,53 | 2.861 | 3,10 | ||||
| 2026-02-12 | 13F | Jane Street Group, Llc | 0 | -100,00 | 0 | |||||
| 2026-02-13 | 13F | Charles Schwab Investment Management Inc | 59.818 | 0,10 | 986 | 10,43 | ||||
| 2025-11-14 | 13F | Engineers Gate Manager LP | 0 | -100,00 | 0 | |||||
| 2026-02-17 | 13F | Russell Investments Group, Ltd. | 175.292 | 47,23 | 2.889 | 62,43 | ||||
| 2026-01-08 | 13F | True Wealth Design, LLC | 7 | 0,00 | 0 | |||||
| 2026-02-13 | 13F | Alberta Investment Management Corp | 50.000 | -72,97 | 824 | -70,18 | ||||
| 2025-11-13 | 13F | Portolan Capital Management, LLC | 0 | -100,00 | 0 | |||||
| 2025-11-14 | 13F | Jain Global LLC | 0 | -100,00 | 0 | -100,00 | ||||
| 2026-02-17 | 13F | XTX Topco Ltd | 0 | -100,00 | 0 | |||||
| 2026-02-17 | 13F | SIH Partners, LLLP | 36.873 | 0,00 | 608 | 10,36 | ||||
| 2026-02-17 | 13F | Susquehanna International Group, Llp | 0 | -100,00 | 0 | |||||
| 2026-02-13 | 13F | Van Eck Associates Corp | 647.910 | -28,11 | 11 | -23,08 | ||||
| 2026-02-13 | 13F | Rhumbline Advisers | 20.428 | -15,14 | 337 | -6,41 | ||||
| 2026-02-13 | 13F | Wells Fargo & Company/mn | 35.945 | 61,68 | 592 | 78,31 | ||||
| 2026-02-17 | 13F | Aqr Capital Management Llc | 63.592 | 15,45 | 1.048 | 27,37 | ||||
| 2026-02-05 | 13F | Amalgamated Bank | 764 | -7,95 | 0 | |||||
| 2026-02-13 | 13F | Manufacturers Life Insurance Company, The | 0 | -100,00 | 0 | |||||
| 2026-02-17 | 13F | CastleKnight Management LP | Call | 0 | -100,00 | 0 | ||||
| 2026-02-06 | 13F | Pnc Financial Services Group, Inc. | 26.026 | 3,27 | 429 | 13,83 | ||||
| 2025-11-13 | 13F | Eisler Capital Management Ltd. | 0 | -100,00 | 0 | -100,00 | ||||
| 2026-02-04 | 13F | First Eagle Investment Management, LLC | 384.072 | 8,00 | 6.330 | 19,15 | ||||
| 2026-02-06 | 13F | Larson Financial Group LLC | 227 | 482,05 | 4 | |||||
| 2026-02-13 | 13F | Citigroup Inc | 550 | -47,27 | 9 | -40,00 | ||||
| 2026-02-17 | 13F | Longaeva Partners L.P. | 0 | -100,00 | 0 | |||||
| 2026-02-06 | 13F | IFP Advisors, Inc | 45 | 60,71 | 1 | |||||
| 2026-02-10 | 13F | Intech Investment Management Llc | 15.081 | 10,71 | 249 | 22,17 | ||||
| 2026-02-17 | 13F | Northern Trust Corp | 124.519 | -11,45 | 2.052 | -2,29 | ||||
| 2026-02-10 | 13F | Envestnet Asset Management Inc | 10.041 | 165 | ||||||
| 2026-02-17 | 13F | Price T Rowe Associates Inc /md/ | 14.733 | 13,79 | 0 | |||||
| 2026-02-17 | 13F | Zimmer Partners, LP | 989.829 | -14,39 | 16.312 | -5,57 | ||||
| 2026-02-13 | 13F | American Century Companies Inc | 5.577.157 | -0,89 | 91.912 | 9,32 | ||||
| 2026-02-17 | 13F | Schonfeld Strategic Advisors LLC | 0 | -100,00 | 0 | |||||
| 2025-11-13 | 13F | Marshall Wace, Llp | 0 | -100,00 | 0 | -100,00 | ||||
| 2026-02-14 | 13F | Rockefeller Capital Management L.P. | 400 | 7 | ||||||
| 2026-01-26 | 13F | Cwm, Llc | 4.551 | 11,85 | 0 | |||||
| 2026-02-09 | 13F | Legal & General Group Plc | 2.580 | -4,55 | 43 | 5,00 | ||||
| 2026-02-10 | 13F | Goldman Sachs Group Inc | 57.845 | -3,69 | 953 | 6,24 | ||||
| 2026-02-03 | 13F | SBI Securities Co., Ltd. | 244 | -0,41 | 4 | 33,33 | ||||
| 2026-02-06 | 13F | Diamond Hill Capital Management Inc | 293.928 | 46,02 | 4.844 | 61,06 | ||||
| 2026-02-13 | 13F | Ubs Asset Management Americas Inc | 40 | 1 | ||||||
| 2026-02-13 | 13F | Sterling Capital Management LLC | 158 | 167,80 | 3 | |||||
| 2026-02-13 | 13F | Morgan Stanley | 138.944 | -2,99 | 2.290 | 7,01 | ||||
| 2026-02-12 | 13F | Nuveen, LLC | 565.882 | -5,11 | 9.326 | 4,67 | ||||
| 2026-02-17 | 13F | CastleKnight Management LP | 1.048.531 | -17,35 | 17.280 | -8,83 | ||||
| 2026-02-17 | 13F | Freestone Grove Partners LP | 0 | -100,00 | 0 | |||||
| 2026-02-17 | 13F | Jump Financial, LLC | 0 | -100,00 | 0 | |||||
| 2026-02-17 | 13F | Mill Road Capital Management LLC | 0 | -100,00 | 0 | |||||
| 2026-02-17 | 13F | Kemnay Advisory Services Inc. | 1.815 | 30 | ||||||
| 2026-02-10 | 13F | Quantbot Technologies LP | 0 | -100,00 | 0 | |||||
| 2026-02-13 | 13F | Healthcare Of Ontario Pension Plan Trust Fund | 400.000 | -42,86 | 6.592 | -36,97 | ||||
| 2026-02-13 | 13F | Entropy Technologies, LP | 0 | -100,00 | 0 | |||||
| 2026-02-13 | 13F | De Lisle Partners LLP | 129.429 | 5,49 | 2.132 | 16,31 | ||||
| 2026-02-13 | 13F | Quarry LP | 16 | 0 | ||||||
| 2026-01-15 | 13F | Allspring Global Investments Holdings, LLC | 2.372.783 | -2,14 | 39.649 | 10,49 | ||||
| 2026-01-30 | 13F | Keybank National Association/oh | 21.000 | 17,32 | 346 | 29,59 | ||||
| 2025-11-14 | 13F | Citadel Advisors Llc | 0 | -100,00 | 0 | -100,00 | ||||
| 2026-02-17 | 13F | Aster Capital Management (DIFC) Ltd | 15.239 | 1.902,50 | 251 | 2.181,82 | ||||
| 2026-02-13 | 13F | Verition Fund Management LLC | 11.200 | -7,12 | 185 | 2,22 | ||||
| 2026-02-13 | 13F | Caitong International Asset Management Co., Ltd | 2.170 | 633,11 | 36 | 775,00 | ||||
| 2026-02-17 | 13F | Balyasny Asset Management Llc | 0 | -100,00 | 0 | |||||
| 2026-02-13 | 13F | Voss Capital, LLC | 2.600.000 | 51,60 | 42.848 | 67,23 | ||||
| 2026-01-07 | 13F | Massmutual Trust Co Fsb/adv | 123 | 0,00 | 2 | 100,00 | ||||
| 2026-02-13 | 13F | SRS Capital Advisors, Inc. | 85 | -86,86 | 1 | -88,89 | ||||
| 2026-02-11 | 13F | Deutsche Bank Ag\ | 41.138 | 150,67 | 678 | 176,33 | ||||
| 2026-02-06 | 13F | EverSource Wealth Advisors, LLC | 195 | -3,94 | 3 | 0,00 | ||||
| 2026-02-12 | 13F | New York State Common Retirement Fund | 7.700 | 0,00 | 127 | 9,57 | ||||
| 2026-02-11 | 13F | Ameritas Investment Partners, Inc. | 2.482 | 41 | ||||||
| 2026-02-05 | 13F | Allworth Financial LP | 186 | 151,35 | 3 | 200,00 | ||||
| 2026-02-13 | 13F | Victory Capital Management Inc | 3.417.804 | 7,25 | 56.325 | 18,30 | ||||
| 2026-02-13 | 13F | State Street Corp | 298.358 | -0,83 | 4.917 | 9,39 | ||||
| 2026-02-17 | 13F | Advisory Services Network, LLC | 0 | -100,00 | 0 | |||||
| 2026-02-17 | 13F | Susquehanna International Group, Llp | Call | 16.100 | -3,59 | 265 | 6,43 | |||
| 2026-02-17 | 13F | MIRAE ASSET GLOBAL ETFS HOLDINGS Ltd. | 11.296 | -1,16 | 186 | 9,41 | ||||
| 2026-01-09 | 13F | SG Americas Securities, LLC | 6.305 | 0 | ||||||
| 2026-02-10 | 13F | Bank of New York Mellon Corp | 54.903 | -4,02 | 905 | 5,85 | ||||
| 2026-02-13 | 13F | MAI Capital Management | 176 | 3 | ||||||
| 2026-01-23 | 13F | Farther Finance Advisors, LLC | 9 | -97,49 | 0 | -100,00 | ||||
| 2026-02-12 | 13F | Venator Management LLC | 522.310 | 13,88 | 8.608 | 25,61 | ||||
| 2026-02-24 | 13F | Bell Investment Advisors, Inc | 353 | 0,00 | 6 | 0,00 | ||||
| 2026-02-09 | 13F | Hartland & Co., LLC | 0 | -100,00 | 0 | |||||
| 2026-02-24 | 13F | River Road Asset Management, LLC | 3.856.334 | 3,45 | 63.552 | 14,12 | ||||
| 2026-02-17 | 13F | Beartown Capital Management, LLC | 10.000 | 165 | ||||||
| 2026-02-06 | 13F | FourThought Financial Partners, LLC | 0 | -100,00 | 0 | |||||
| 2026-02-10 | 13F | Acadian Asset Management Llc | 37.563 | 1 | ||||||
| 2026-02-17 | 13F | Sandia Investment Management LP | 5.000 | 0,00 | 82 | 10,81 | ||||
| 2026-02-17 | 13F | California State Teachers Retirement System | 1.497 | -1,38 | 25 | 9,09 | ||||
| 2026-03-06 | 13F | Hsbc Holdings Plc | 0 | -100,00 | 0 | |||||
| 2026-02-13 | 13F | Sei Investments Co | 106.570 | 49,86 | 1.756 | 65,35 | ||||
| 2026-01-29 | 13F | Vanguard Group Inc | 163.944 | 2,08 | 2.702 | 12,59 | ||||
| 2026-02-17 | 13F | Tower Research Capital LLC (TRC) | 966 | -70,14 | 16 | -68,75 | ||||
| 2026-02-12 | 13F | Renaissance Technologies Llc | 0 | -100,00 | 0 | |||||
| 2026-02-12 | 13F | BRYN MAWR TRUST Co | 17 | 0 | ||||||
| 2026-02-17 | 13F | Advisor Group Holdings, Inc. | 63 | -36,36 | 1 | 0,00 | ||||
| 2026-02-11 | 13F | Jpmorgan Chase & Co | 10.204 | -0,31 | 168 | 10,53 | ||||
| 2026-02-17 | 13F | Aquatic Capital Management LLC | 2.973 | -78,79 | 49 | -77,03 | ||||
| 2026-02-10 | 13F | Rothschild Investment Llc | 51 | 155,00 | 1 | |||||
| 2026-02-17 | 13F | Numerai GP LLC | 27.503 | 453 | ||||||
| 2026-01-29 | 13F | UBS Group AG | 338.910 | -25,98 | 5.585 | -18,35 | ||||
| 2025-11-13 | 13F | Macquarie Group Ltd | 0 | -100,00 | 0 | -100,00 | ||||
| 2025-11-14 | 13F | Capstone Investment Advisors, Llc | 0 | -100,00 | 0 | |||||
| 2026-02-11 | 13F | Los Angeles Capital Management Llc | 94.162 | 98,07 | 1.388 | 95,35 | ||||
| 2026-02-10 | 13F | Bnp Paribas Arbitrage, Sa | 7.873 | -40,83 | 130 | -34,85 | ||||
| 2026-02-12 | 13F | BlackRock, Inc. | 1.255.163 | 2,66 | 20.685 | 13,24 | ||||
| 2026-02-17 | 13F | Burkehill Global Management, LP | 0 | -100,00 | 0 |
Other Listings
| US:TTAM | 14,98 $ |