Grundlæggende statistik
| Institutionelle ejere | 146 total, 141 long only, 0 short only, 5 long/short - change of -16,09% MRQ |
| Del pris | 12,20 |
| Gennemsnitlig porteføljeallokering | 0.1084 % - change of 7,66% MRQ |
| Institutionelle aktier (lange) | 23.030.421 (ex 13D/G) - change of 0,28MM shares 1,21% MRQ |
| Institutionel værdi (lang) | $ 231.441 USD ($1000) |
Institutionelt ejerskab og aktionærer
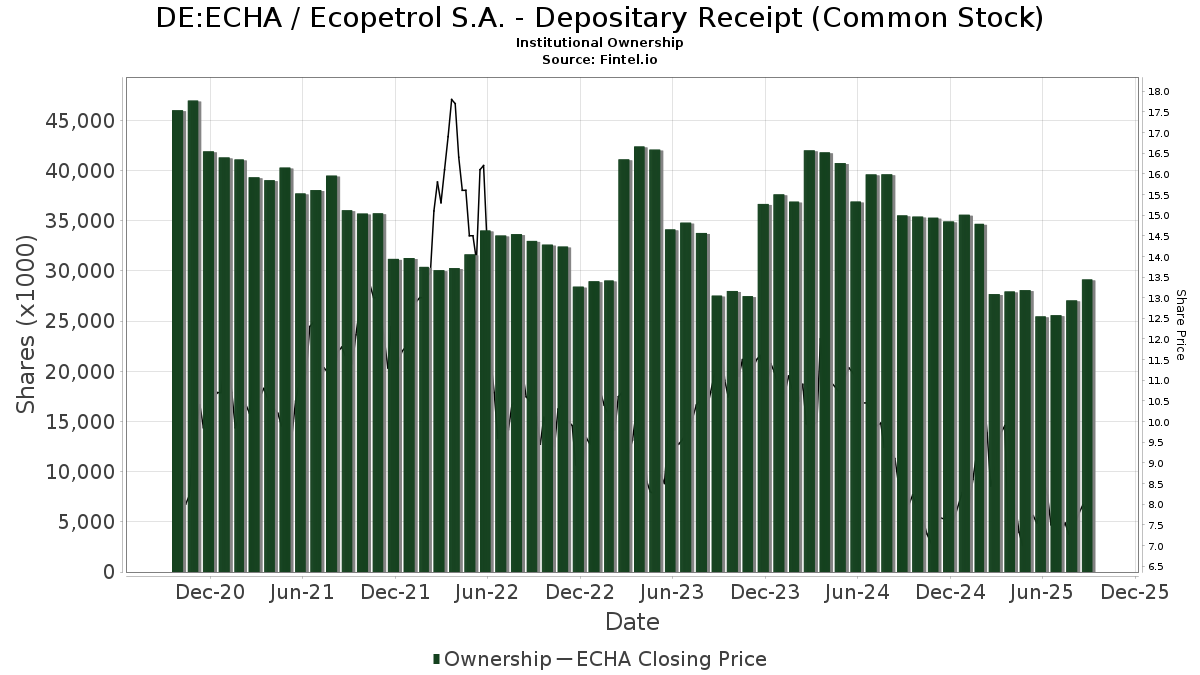
Ecopetrol S.A. - Depositary Receipt (Common Stock) (DE:ECHA) har 146 institutionelle ejere og aktionærer, der har indsendt 13D/G- eller 13F-formularer til Securities Exchange Commission (SEC). Disse institutioner har i alt 23,030,421 aktier. Største aktionærer omfatter Vanguard Group Inc, Millennium Management Llc, Fundamenta Capital S.A., BlackRock, Inc., Charles Schwab Investment Management Inc, Two Sigma Investments, Lp, Goldman Sachs Group Inc, D. E. Shaw & Co., Inc., Morgan Stanley, and American Century Companies Inc .
Ecopetrol S.A. - Depositary Receipt (Common Stock) (DB:ECHA) institutionel ejerskabsstruktur viser aktuelle positioner i virksomheden efter institutioner og fonde, samt seneste ændringer i positionsstørrelse. Større aktionærer kan omfatte individuelle investorer, investeringsforeninger, hedgefonde eller institutioner. Skema 13D angiver, at investoren besidder (eller besidder) mere end 5 % af virksomheden og har til hensigt (eller har til hensigt at) aktivt at forfølge en ændring i forretningsstrategi. Skema 13G indikerer en passiv investering på over 5%.
The share price as of April 24, 2026 is 12,20 / share. Previously, on April 28, 2025, the share price was 7,52 / share. This represents an increase of 62,23% over that period.
Fondens stemningsscore
Fund Sentiment Score (fka Ownership Accumulation Score) finder de aktier, der bliver mest købt af fonde. Det er resultatet af en sofistikeret, multi-faktor kvantitativ model, der identificerer virksomheder med de højeste niveauer af institutionel akkumulering. Scoringsmodellen bruger en kombination af den samlede stigning i oplyste ejere, ændringerne i porteføljeallokeringer i disse ejere og andre målinger. Tallet går fra 0 til 100, hvor højere tal indikerer et højere niveau af akkumulering for sine jævnaldrende, og 50 er gennemsnittet.
Opdateringsfrekvens: Dagligt
Se Ownership Explorer, som giver en liste over højest rangerende virksomheder.
AI+ Ask Fintel’s AI assistant about Ecopetrol S.A. - Depositary Receipt (Common Stock).
Select a question to share a public post with an AI-crafted answer.
Thinking of good questions…
13F og NPORT arkivering
Detaljer om 13F-arkivering er gratis. Detaljer om NP-ansøgninger kræver et premium-medlemskab. Grønne rækker angiver nye positioner. Røde rækker angiver lukkede positioner. Klik på linket ikon for at se den fulde transaktionshistorik.
Opgrader
for at låse premium-data op og eksportere til Excel ![]() .
.
| Fil dato | Kilde | Investor | Type | Gennemsnitlig pris (Øst) |
Aktier | Δ Aktier (%) |
Rapporteret Værdi ($1000) |
Δ Værdi (%) |
Port Alloc (%) |
|
|---|---|---|---|---|---|---|---|---|---|---|
| 2026-02-09 | 13F | Strategic Financial Concepts, LLC | 0 | -100,00 | 0 | |||||
| 2026-02-12 | 13F | BlackRock, Inc. | 1.527.623 | 12,76 | 15.307 | 22,68 | ||||
| 2026-01-30 | 13F | Carrera Capital Advisors | 0 | -100,00 | 0 | -100,00 | ||||
| 2026-01-28 | 13F | DekaBank Deutsche Girozentrale | 20.000 | 0,00 | 0 | |||||
| 2026-02-02 | 13F | Ping Capital Management, Inc. | 41.000 | 5,13 | 411 | 14,21 | ||||
| 2026-02-13 | 13F | Marshall Wace, Llp | 0 | -100,00 | 0 | |||||
| 2026-02-13 | 13F | Platinum Investment Management Ltd | 3.107 | -78,88 | 31 | -77,04 | ||||
| 2026-02-03 | 13F | Manning & Napier Advisors Llc | 186.771 | -4,85 | 1.871 | 3,54 | ||||
| 2025-10-30 | 13F | Ridgewood Investments LLC | 0 | -100,00 | 0 | |||||
| 2026-02-17 | 13F | Tower Research Capital LLC (TRC) | 4.833 | 71,57 | 48 | 92,00 | ||||
| 2026-01-23 | 13F | Westside Investment Management, Inc. | 1.272 | 0,00 | 13 | 9,09 | ||||
| 2026-02-13 | 13F | Barclays Plc | 98.919 | 24.629,75 | 991 | 32.933,33 | ||||
| 2026-02-17 | 13F | Bank Of America Corp /de/ | 46.002 | -9,75 | 461 | -1,92 | ||||
| 2026-02-06 | 13F | EverSource Wealth Advisors, LLC | 1.734 | 13,41 | 17 | 21,43 | ||||
| 2025-10-30 | 13F | Parkside Financial Bank & Trust | 0 | -100,00 | 0 | -100,00 | ||||
| 2026-01-30 | 13F | Glenorchy Capital Ltd | 62.487 | 4,94 | 626 | 14,23 | ||||
| 2026-02-17 | 13F | Voloridge Investment Management, Llc | 236.586 | 91,36 | 2.371 | 108,26 | ||||
| 2026-02-17 | 13F | Nomura Holdings Inc | 10.100 | 101 | ||||||
| 2026-02-13 | 13F | Citigroup Inc | 3.218 | -98,56 | 32 | -98,45 | ||||
| 2026-02-13 | 13F | Toroso Investments, LLC | 35.541 | 14,14 | 356 | 24,48 | ||||
| 2026-04-01 | 13F | Confluence Investment Management Llc | 13.438 | 24,10 | 201 | 86,11 | ||||
| 2026-02-13 | 13F | Atlas Capital Advisors Llc | 15.503 | 24,85 | 155 | 42,20 | ||||
| 2026-04-20 | 13F | Ronald Blue Trust, Inc. | 9.940 | -32,63 | 149 | 1,36 | ||||
| 2026-02-17 | 13F | Two Sigma Advisers, Lp | 477.900 | 75,76 | 4.789 | 91,21 | ||||
| 2026-02-17 | 13F | Advisor Group Holdings, Inc. | 135.611 | -3,98 | 1.359 | 4,22 | ||||
| 2026-02-12 | 13F | Hrt Financial Lp | 19.511 | -60,45 | 0 | |||||
| 2025-11-14 | 13F | Virtu Financial LLC | 0 | -100,00 | 0 | |||||
| 2026-04-20 | 13F | Longview Financial Advisors, Inc. | 1.340 | 20 | ||||||
| 2026-02-11 | 13F | Jpmorgan Chase & Co | 106.545 | 41,71 | 1.068 | 54,19 | ||||
| 2026-02-11 | 13F | Parallel Advisors, LLC | 5.852 | 4,39 | 59 | 13,73 | ||||
| 2026-02-17 | 13F | Guggenheim Capital Llc | 12.853 | -2,64 | 129 | 5,79 | ||||
| 2026-02-13 | 13F | Mariner, LLC | 35.151 | 20,91 | 352 | 31,84 | ||||
| 2026-02-13 | 13F | Verition Fund Management LLC | 253.376 | -11,44 | 2.539 | -3,64 | ||||
| 2026-02-11 | 13F | Metis Global Partners, LLC | 14.554 | 0,00 | 146 | 8,21 | ||||
| 2026-02-03 | 13F | SBI Securities Co., Ltd. | 192.239 | -20,41 | 1.926 | -13,40 | ||||
| 2026-02-17 | 13F | Kerrisdale Advisers, LLC | 67.555 | 0,00 | 677 | 8,68 | ||||
| 2026-01-15 | 13F | Nisa Investment Advisors, Llc | 500 | 0,00 | 5 | 25,00 | ||||
| 2026-02-05 | 13F | Baader Bank INC | 18.158 | 112 | ||||||
| 2025-11-06 | 13F | MQS Management LLC | 0 | -100,00 | 0 | -100,00 | ||||
| 2026-02-13 | 13F | Walleye Trading LLC | Put | 100 | -94,74 | 1 | -94,12 | |||
| 2026-02-13 | 13F | Walleye Trading LLC | Call | 30.900 | 272,29 | 310 | 306,58 | |||
| 2026-02-13 | 13F | Pathstone Holdings, LLC | 11.689 | 15,39 | 117 | 25,81 | ||||
| 2026-04-22 | 13F | Patriot Financial Group Insurance Agency, LLC | 42.960 | 97,70 | 644 | 196,31 | ||||
| 2026-02-17 | 13F | Russell Investments Group, Ltd. | 45.891 | -26,86 | 460 | -20,45 | ||||
| 2026-02-12 | 13F | Skopos Labs, Inc. | 108.759 | 212,54 | 1.070 | 245,16 | ||||
| 2025-11-13 | 13F | BW Gestao de Investimentos Ltda. | 0 | -100,00 | 0 | |||||
| 2026-02-17 | 13F | Grantham, Mayo, Van Otterloo & Co. LLC | 79.400 | 83,80 | 796 | 100,25 | ||||
| 2026-04-22 | 13F | Larry Mathis Financial Planning, LLC | 12.693 | -2,60 | 190 | 46,15 | ||||
| 2025-11-24 | 13F | CIBC Private Wealth Group, LLC | 0 | -100,00 | 0 | -100,00 | ||||
| 2026-02-12 | 13F | Rossby Financial, LCC | 3 | 0,00 | 0 | |||||
| 2026-01-27 | 13F | Fundamenta Capital S.A. | 2.009.495 | 20.135 | ||||||
| 2026-02-17 | 13F | Schonfeld Strategic Advisors LLC | 22.844 | 229 | ||||||
| 2026-02-11 | 13F | Empowered Funds, LLC | 0 | -100,00 | 0 | |||||
| 2026-02-13 | 13F | Morgan Stanley | 645.378 | -7,03 | 6.467 | 1,14 | ||||
| 2026-04-15 | 13F | Journey Strategic Wealth Llc | 11.500 | 172 | ||||||
| 2026-01-23 | 13F | Assetmark, Inc | 817 | -26,73 | 8 | -20,00 | ||||
| 2026-01-30 | 13F | Us Bancorp \de\ | 1.781 | -13,92 | 18 | -10,53 | ||||
| 2026-02-13 | 13F | Wells Fargo & Company/mn | 11.297 | 0,00 | 113 | 8,65 | ||||
| 2026-01-30 | 13F | Pekin Hardy Strauss, Inc. | 120.697 | -0,52 | 1.209 | 8,24 | ||||
| 2026-04-23 | 13F | CWM Advisors, LLC | 8.546 | -2,51 | 128 | 47,13 | ||||
| 2026-02-17 | 13F | Sona Asset Management (us) Llc | 100.000 | -50,00 | 1.002 | -45,60 | ||||
| 2026-01-09 | 13F | SG Americas Securities, LLC | 0 | -100,00 | 0 | |||||
| 2026-02-10 | 13F | KERR FINANCIAL PLANNING Corp | 17 | 0 | ||||||
| 2025-11-14 | 13F | Gotham Asset Management, LLC | 0 | -100,00 | 0 | |||||
| 2026-02-06 | 13F | Global Retirement Partners, LLC | 330 | 0,00 | 3 | 0,00 | ||||
| 2026-02-17 | 13F | Susquehanna International Group, Llp | Call | 125.500 | -0,71 | 1.258 | 7,99 | |||
| 2026-02-17 | 13F | Susquehanna International Group, Llp | Put | 133.000 | -12,38 | 1.333 | -4,72 | |||
| 2026-04-06 | 13F | GAMMA Investing LLC | 32.338 | 8,02 | 485 | 61,87 | ||||
| 2026-02-17 | 13F | XTX Topco Ltd | 127.910 | 1.083,80 | 1.282 | 1.193,94 | ||||
| 2026-02-17 | 13F | Citadel Advisors Llc | 483.906 | 89,23 | 4.849 | 105,86 | ||||
| 2026-02-17 | 13F | Citadel Advisors Llc | Call | 276.000 | 21,96 | 2.766 | 32,68 | |||
| 2026-02-13 | 13F | State Street Corp | 322.887 | 3,81 | 3.235 | 12,95 | ||||
| 2026-02-17 | 13F | Citadel Advisors Llc | Put | 194.300 | 112,35 | 1.947 | 131,12 | |||
| 2026-02-13 | 13F | Squarepoint Ops LLC | 40.588 | 68,60 | 407 | 83,71 | ||||
| 2025-11-13 | 13F | Wealth High Governance Capital Ltda | 0 | -100,00 | 0 | -100,00 | ||||
| 2026-04-23 | 13F | North Star Investment Management Corp. | 56 | 0,00 | 1 | |||||
| 2025-11-14 | 13F | Oaktree Fund Advisors, LLC | 0 | -100,00 | 0 | -100,00 | ||||
| 2026-02-12 | 13F | Quadrant Capital Group Llc | 4.777 | 16,94 | 48 | 27,03 | ||||
| 2026-02-17 | 13F | Jain Global LLC | 21.268 | -29,73 | 213 | -23,38 | ||||
| 2026-02-17 | 13F | Virtus Investment Advisers, Inc. | 0 | -100,00 | 0 | |||||
| 2026-02-05 | 13F | Leuthold Group, Llc | 26.244 | 0,66 | 263 | 9,17 | ||||
| 2026-02-13 | 13F | MAI Capital Management | 0 | -100,00 | 0 | |||||
| 2025-11-13 | 13F | Capital Fund Management S.a. | 0 | -100,00 | 0 | -100,00 | ||||
| 2026-02-17 | 13F | Royal Bank Of Canada | 11.609 | -95,82 | 116 | -95,46 | ||||
| 2026-02-12 | 13F | EntryPoint Capital, LLC | 20.207 | 202 | ||||||
| 2026-02-12 | 13F | Triumph Capital Management | 300 | 0,00 | 3 | 50,00 | ||||
| 2026-02-10 | 13F | Quantbot Technologies LP | 38.079 | 604,25 | 382 | 677,55 | ||||
| 2026-02-11 | 13F | O'shaughnessy Asset Management, Llc | 59.079 | -1,97 | 592 | 6,49 | ||||
| 2026-02-17 | 13F | Susquehanna International Group, Llp | 0 | -100,00 | 0 | |||||
| 2025-11-13 | 13F | Oaktree Capital Management Lp | 0 | -100,00 | 0 | -100,00 | ||||
| 2026-02-12 | 13F | Barometer Capital Management Inc. | 3.900 | -94,95 | 562 | -20,96 | ||||
| 2026-02-13 | 13F | Y-Intercept (Hong Kong) Ltd | 0 | -100,00 | 0 | |||||
| 2026-02-13 | 13F | Smartleaf Asset Management LLC | 154 | -94,47 | 2 | -96,00 | ||||
| 2026-02-13 | 13F | Stifel Financial Corp | 33.602 | -3,40 | 337 | 5,00 | ||||
| 2025-11-14 | 13F | AXA Investment Managers S.A. | 79.554 | 733 | ||||||
| 2026-02-17 | 13F | Private Advisor Group, LLC | 16.146 | -34,22 | 162 | -28,76 | ||||
| 2026-01-14 | 13F | ORG Partners LLC | 2.568 | 301,25 | 26 | 400,00 | ||||
| 2026-02-13 | 13F | BNP Paribas Asset Management Holding S.A. | 49.554 | 1 | ||||||
| 2026-04-15 | 13F | Brady Martz Wealth Solutions, LLC | 12.788 | 192 | ||||||
| 2025-11-14 | 13F | Wetherby Asset Management Inc | 10.635 | -16,71 | 98 | -14,16 | ||||
| 2026-04-07 | 13F | Signaturefd, Llc | 8.231 | 10,08 | 123 | 66,22 | ||||
| 2026-02-05 | 13F | Bessemer Group Inc | 288 | 0 | ||||||
| 2026-02-13 | 13F/A | Virtus ETF Advisers LLC | 0 | -100,00 | 0 | |||||
| 2026-01-30 | 13F | R Squared Ltd | 35.907 | 21,87 | 360 | 32,47 | ||||
| 2026-02-17 | 13F | Northern Trust Corp | 127.251 | 1,89 | 1.275 | 10,87 | ||||
| 2025-11-14 | 13F | Axa S.a. | 0 | -100,00 | 0 | -100,00 | ||||
| 2026-02-17 | 13F | Massar Capital Management, LP | 40.000 | -83,33 | 401 | -81,90 | ||||
| 2026-02-05 | 13F | O'Brien Greene & Co. Inc | 10.000 | 100 | ||||||
| 2026-02-13 | 13F | Charles Schwab Investment Management Inc | 1.407.890 | 3,01 | 14.107 | 12,07 | ||||
| 2026-01-07 | 13F | St. Louis Financial Planners Asset Management, LLC | 0 | -100,00 | 0 | |||||
| 2025-11-12 | 13F | Group One Trading, L.p. | 0 | -100,00 | 0 | -100,00 | ||||
| 2026-02-11 | 13F | Group One Trading, L.p. | Put | 15.800 | 75,56 | 158 | 92,68 | |||
| 2026-02-03 | 13F | Ballentine Partners, LLC | 13.676 | 17,93 | 137 | 29,25 | ||||
| 2026-02-11 | 13F | Group One Trading, L.p. | Call | 320.500 | 130,41 | 3.211 | 150,66 | |||
| 2026-02-17 | 13F | Aquatic Capital Management LLC | 8.455 | -95,55 | 85 | -95,20 | ||||
| 2025-11-13 | 13F | Banco BTG Pactual S.A. | 0 | -100,00 | 0 | -100,00 | ||||
| 2026-04-22 | 13F | Janney Montgomery Scott LLC | 16.496 | 0 | ||||||
| 2026-04-02 | 13F | Marex Group plc | 0 | -100,00 | 0 | -100,00 | ||||
| 2026-02-13 | 13F | Great West Life Assurance Co /can/ | 6.874 | 0,00 | 0 | |||||
| 2026-02-06 | 13F | Leonteq Securities AG | 53 | 0,00 | 1 | |||||
| 2026-02-13 | 13F | National Bank Of Canada /fi/ | 5 | 0,00 | 0 | |||||
| 2026-02-13 | 13F | Bridgefront Capital, LLC | 0 | -100,00 | 0 | |||||
| 2026-02-12 | 13F | JBF Capital, Inc. | 20.000 | 0,00 | 200 | 8,70 | ||||
| 2026-02-17 | 13F | Stokes Family Office, LLC | 170.308 | -19,97 | 1.706 | -12,91 | ||||
| 2026-02-11 | 13F | Simplex Trading, Llc | Put | 53.900 | -34,59 | 540 | ||||
| 2026-02-11 | 13F | Simplex Trading, Llc | Call | 38.100 | -51,89 | 382 | ||||
| 2026-02-11 | 13F | Allianz Asset Management GmbH | 264.665 | -49,18 | 2.652 | -44,72 | ||||
| 2026-02-09 | 13F | Hantz Financial Services, Inc. | 92.148 | -5,89 | 1 | |||||
| 2026-02-17 | 13F | Jones Financial Companies Lllp | 215 | 0,00 | 2 | 0,00 | ||||
| 2026-02-13 | 13F | Rhumbline Advisers | 3.585 | -2,71 | 36 | 6,06 | ||||
| 2026-01-29 | 13F | UBS Group AG | 469.130 | -23,82 | 4.701 | -17,12 | ||||
| 2026-02-17 | 13F | Engineers Gate Manager LP | 124.309 | 43,93 | 1.246 | 56,60 | ||||
| 2026-04-20 | 13F | CWA Asset Management Group, LLC | 248.429 | 151,18 | 3.724 | 275,68 | ||||
| 2026-04-20 | 13F | Sowell Financial Services LLC | 11.265 | -19,55 | 169 | 20,00 | ||||
| 2026-04-24 | 13F | Sage Investment Counsel LLC | 0 | -100,00 | 0 | |||||
| 2026-02-12 | 13F | Advisors Asset Management, Inc. | 59.765 | -24,09 | 599 | -17,52 | ||||
| 2026-02-17 | 13F/A | Militia Capital Partners, LP | 0 | -100,00 | 0 | -100,00 | ||||
| 2026-04-21 | 13F | Vise Technologies, Inc. | 11.556 | 0,00 | 116 | 0,00 | ||||
| 2026-02-10 | 13F | Bnp Paribas Arbitrage, Sa | 82.345 | 238,99 | 825 | 269,96 | ||||
| 2026-01-29 | 13F | Vanguard Group Inc | 3.108.070 | -1,70 | 31.143 | 6,94 | ||||
| 2026-02-13 | 13F | Schroder Investment Management Group | 42.874 | -65,43 | 423 | -62,83 | ||||
| 2026-02-12 | 13F | Earnest Partners Llc | 22.416 | -24,63 | 225 | -17,95 | ||||
| 2026-04-07 | 13F | Farther Finance Advisors, LLC | 5.350 | 37,25 | 78 | 97,44 | ||||
| 2026-02-09 | 13F | Legal & General Group Plc | 141.239 | -5,51 | 1.416 | 2,76 | ||||
| 2026-02-09 | 13F | Fisher Asset Management, LLC | 445.260 | -2,40 | 4.462 | 6,19 | ||||
| 2025-11-12 | 13F | Fox Run Management, L.l.c. | 0 | -100,00 | 0 | -100,00 | ||||
| 2025-11-14 | 13F | MIRAE ASSET GLOBAL ETFS HOLDINGS Ltd. | 0 | -100,00 | 0 | |||||
| 2026-02-06 | 13F | Larson Financial Group LLC | 1 | -99,93 | 0 | -100,00 | ||||
| 2026-02-13 | 13F | Integrated Wealth Concepts LLC | 35.836 | 11,65 | 359 | 21,69 | ||||
| 2026-02-06 | 13F | Pnc Financial Services Group, Inc. | 72 | -14,29 | 1 | |||||
| 2026-02-13 | 13F | JustInvest LLC | 19.324 | 6,90 | 194 | 16,27 | ||||
| 2026-02-17 | 13F | Two Sigma Investments, Lp | 1.328.004 | 184,82 | 13.307 | 209,87 | ||||
| 2026-02-12 | 13F | Philadelphia Trust Co | 14.200 | 0,00 | 0 | |||||
| 2026-02-13 | 13F | Aigen Investment Management, Lp | 0 | -100,00 | 0 | -100,00 | ||||
| 2026-02-06 | 13F/A | Rathbone Brothers plc | 32.650 | 0,00 | 327 | 9,00 | ||||
| 2026-02-13 | 13F | Dynamic Technology Lab Private Ltd | 14.247 | 143 | ||||||
| 2026-02-02 | 13F | Principal Financial Group Inc | 18.259 | 17,90 | 183 | 28,17 | ||||
| 2026-04-22 | 13F | Straight Path Wealth Management | 10.000 | 0,00 | 150 | 49,00 | ||||
| 2026-02-19 | 13F | Invesco Ltd. | 70.020 | -1,19 | 702 | 7,52 | ||||
| 2026-02-17 | 13F | Creative Planning | 53.704 | 14,63 | 538 | 24,83 | ||||
| 2025-11-06 | 13F | Candriam Luxembourg S.C.A. | 0 | -100,00 | 0 | |||||
| 2025-11-14 | 13F | Two Sigma Securities, Llc | 0 | -100,00 | 0 | -100,00 | ||||
| 2026-02-12 | 13F | Jane Street Group, Llc | 194.787 | 61,14 | 1.952 | 75,29 | ||||
| 2026-02-10 | 13F | Goldman Sachs Group Inc | 935.639 | 7,42 | 9.375 | 16,87 | ||||
| 2026-02-17 | 13F | Brevan Howard Capital Management LP | 0 | -100,00 | 0 | |||||
| 2026-02-17 | 13F | Jump Financial, LLC | 217.902 | -36,26 | 2.183 | -30,65 | ||||
| 2026-02-17 | 13F | Millennium Management Llc | 2.591.458 | 1.157,01 | 25.966 | 1.268,07 | ||||
| 2026-02-10 | 13F | Eurizon Capital SGR S.p.A. | 76 | 1 | ||||||
| 2026-02-17 | 13F | Millennium Management Llc | Call | 44.400 | 0,00 | 445 | 8,82 | |||
| 2025-11-14 | 13F | Lazard Asset Management Llc | 0 | -100,00 | 0 | -100,00 | ||||
| 2026-02-17 | 13F | Hilltop Holdings Inc. | 51.186 | -0,08 | 513 | 8,70 | ||||
| 2026-02-17 | 13F | Advisory Services Network, LLC | 13.395 | 210,43 | 134 | 243,59 | ||||
| 2026-02-17 | 13F | Balyasny Asset Management Llc | 0 | -100,00 | 0 | |||||
| 2026-02-13 | 13F | American Century Companies Inc | 583.350 | 13,57 | 5.845 | 23,57 | ||||
| 2026-02-04 | 13F | LRI Investments, LLC | 64 | 0,00 | 1 | |||||
| 2026-02-12 | 13F | Empirical Finance, LLC | 0 | -100,00 | 0 | -100,00 | ||||
| 2026-02-18 | 13F | Vident Advisory, LLC | 47.240 | 0,46 | 473 | 9,24 | ||||
| 2026-02-17 | 13F | D. E. Shaw & Co., Inc. | 690.567 | 37,71 | 6.919 | 49,83 | ||||
| 2026-02-10 | 13F/A | Northwestern Mutual Wealth Management Co | 40 | 0 | ||||||
| 2026-02-19 | 13F | Mcguire Capital Advisors Inc | 500 | 5 | ||||||
| 2026-02-03 | 13F | Anfield Capital Management, LLC | 8.988 | 0,00 | 90 | 9,76 | ||||
| 2026-02-13 | 13F | SRS Capital Advisors, Inc. | 2.266 | 51,07 | 23 | 69,23 | ||||
| 2026-02-13 | 13F | Cornerstone Financial Management LLC | 116 | 1 | ||||||
| 2025-11-07 | 13F | Sierra Ocean, Llc | 0 | -100,00 | 0 | |||||
| 2026-02-10 | 13F | Envestnet Asset Management Inc | 24.473 | 77,80 | 245 | 94,44 | ||||
| 2026-02-05 | 13F | Allworth Financial LP | 1.564 | 5,82 | 16 | 15,38 | ||||
| 2026-02-12 | 13F | Jane Street Group, Llc | Put | 0 | -100,00 | 0 | -100,00 | |||
| 2026-02-12 | 13F | Jane Street Group, Llc | Call | 0 | -100,00 | 0 | -100,00 | |||
| 2026-02-11 | 13F | LPL Financial LLC | 119.784 | 1,73 | 1.200 | 10,70 | ||||
| 2026-02-13 | 13F | Truffle Hound Capital, LLC | 550.000 | 0,00 | 5.511 | 8,81 | ||||
| 2026-04-21 | 13F | Robeco Institutional Asset Management B.V. | 90.622 | -9,19 | 1.358 | 35,94 | ||||
| 2026-02-13 | 13F | Caitong International Asset Management Co., Ltd | 860 | 7.066,67 | 9 | |||||
| 2025-11-14 | 13F | Raymond James Financial Inc | 0 | -100,00 | 0 | |||||
| 2026-01-26 | 13F | Mirae Asset Global Investments Co., Ltd. | 4.648 | 5,52 | 47 | 15,00 | ||||
| 2026-02-13 | 13F | Inspire Advisors, LLC | 15.059 | -0,12 | 151 | 8,70 |
Other Listings
| US:EC | 13,80 $ |