Grundlæggende statistik
| Institutionelle ejere | 101 total, 94 long only, 0 short only, 7 long/short - change of 1,00% MRQ |
| Del pris | 56,50 |
| Gennemsnitlig porteføljeallokering | 0.4821 % - change of 58,01% MRQ |
| Institutionelle aktier (lange) | 9.281.970 (ex 13D/G) - change of 1,03MM shares 12,51% MRQ |
| Institutionel værdi (lang) | $ 653.415 USD ($1000) |
Institutionelt ejerskab og aktionærer
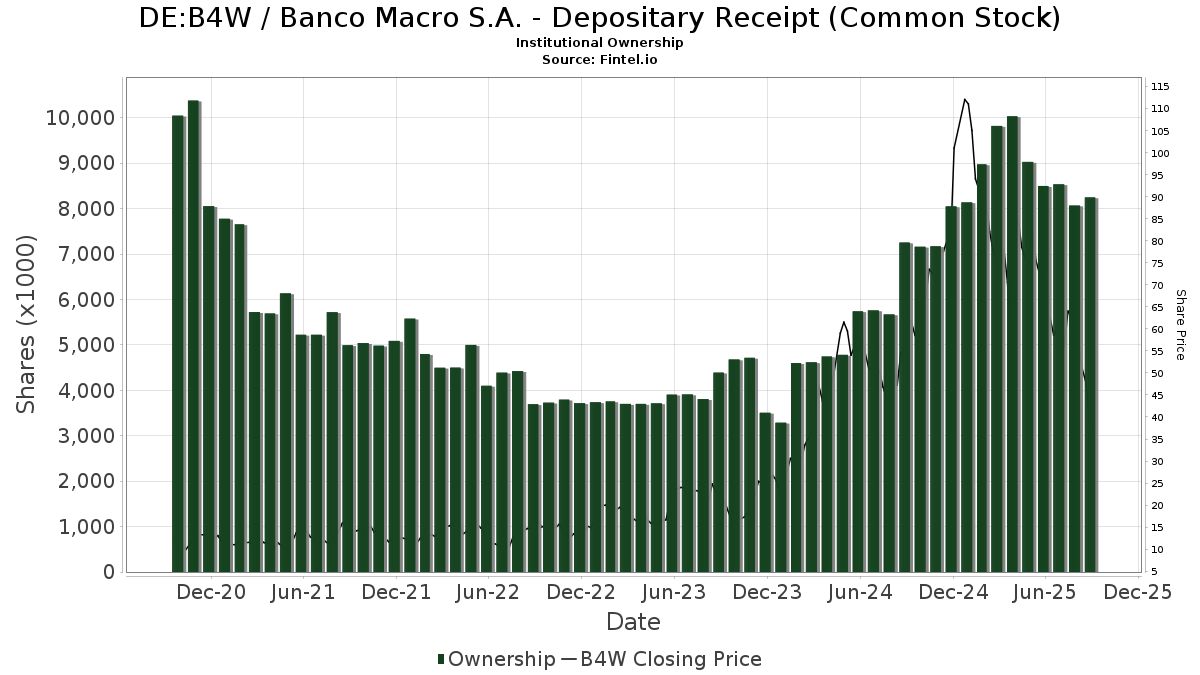
Banco Macro S.A. - Depositary Receipt (Common Stock) (DE:B4W) har 101 institutionelle ejere og aktionærer, der har indsendt 13D/G- eller 13F-formularer til Securities Exchange Commission (SEC). Disse institutioner har i alt 9,281,970 aktier. Største aktionærer omfatter AIM INVESTMENT FUNDS (INVESCO INVESTMENT FUNDS) - Invesco Oppenheimer International Bond Fund Class R6, PointState Capital LP, Samlyn Capital, Llc, BlackRock, Inc., Aquamarine Financial (Cayman) Ltd, AIM INVESTMENT FUNDS (INVESCO INVESTMENT FUNDS) - Invesco Oppenheimer Global Strategic Income Fund Class R6, ARGT - Global X MSCI Argentina ETF, Cape Ann Asset Management Ltd, TT International Asset Management LTD, and Morgan Stanley .
Banco Macro S.A. - Depositary Receipt (Common Stock) (DB:B4W) institutionel ejerskabsstruktur viser aktuelle positioner i virksomheden efter institutioner og fonde, samt seneste ændringer i positionsstørrelse. Større aktionærer kan omfatte individuelle investorer, investeringsforeninger, hedgefonde eller institutioner. Skema 13D angiver, at investoren besidder (eller besidder) mere end 5 % af virksomheden og har til hensigt (eller har til hensigt at) aktivt at forfølge en ændring i forretningsstrategi. Skema 13G indikerer en passiv investering på over 5%.
The share price as of March 17, 2026 is 56,50 / share. Previously, on March 19, 2025, the share price was 71,00 / share. This represents a decline of 20,42% over that period.
Fondens stemningsscore
Fund Sentiment Score (fka Ownership Accumulation Score) finder de aktier, der bliver mest købt af fonde. Det er resultatet af en sofistikeret, multi-faktor kvantitativ model, der identificerer virksomheder med de højeste niveauer af institutionel akkumulering. Scoringsmodellen bruger en kombination af den samlede stigning i oplyste ejere, ændringerne i porteføljeallokeringer i disse ejere og andre målinger. Tallet går fra 0 til 100, hvor højere tal indikerer et højere niveau af akkumulering for sine jævnaldrende, og 50 er gennemsnittet.
Opdateringsfrekvens: Dagligt
Se Ownership Explorer, som giver en liste over højest rangerende virksomheder.
AI+ Ask Fintel’s AI assistant about Banco Macro S.A. - Depositary Receipt (Common Stock).
Select a question to share a public post with an AI-crafted answer.
Thinking of good questions…
13F og NPORT arkivering
Detaljer om 13F-arkivering er gratis. Detaljer om NP-ansøgninger kræver et premium-medlemskab. Grønne rækker angiver nye positioner. Røde rækker angiver lukkede positioner. Klik på linket ikon for at se den fulde transaktionshistorik.
Opgrader
for at låse premium-data op og eksportere til Excel ![]() .
.
| Fil dato | Kilde | Investor | Type | Gennemsnitlig pris (Øst) |
Aktier | Δ Aktier (%) |
Rapporteret Værdi ($1000) |
Δ Værdi (%) |
Port Alloc (%) |
|
|---|---|---|---|---|---|---|---|---|---|---|
| 2026-01-15 | 13F | Scharf Investments, Llc | 0 | -100,00 | 0 | |||||
| 2026-02-17 | 13F | State Of Wisconsin Investment Board | 12.940 | 1.167 | ||||||
| 2025-11-14 | 13F | Duquesne Family Office LLC | 0 | -100,00 | 0 | -100,00 | ||||
| 2026-02-02 | 13F | Ping Capital Management, Inc. | 119.604 | -2,84 | 10.783 | 107,13 | ||||
| 2025-11-14 | 13F | D. E. Shaw & Co., Inc. | Call | 0 | -100,00 | 0 | ||||
| 2025-11-12 | 13F | LPL Financial LLC | 0 | -100,00 | 0 | -100,00 | ||||
| 2026-02-12 | 13F | Lansforsakringar Fondforvaltning AB (publ) | 3.384 | 305 | ||||||
| 2025-11-10 | 13F | Beverly Hills Private Wealth, LLC | 0 | -100,00 | 0 | |||||
| 2026-02-17 | 13F | Bank Of America Corp /de/ | 1.574 | -87,98 | 142 | -74,50 | ||||
| 2026-02-12 | 13F | Marex Group plc | 8.906 | -44,09 | 803 | 19,17 | ||||
| 2026-02-17 | 13F | Advisor Group Holdings, Inc. | 571 | -68,44 | 52 | -46,87 | ||||
| 2026-02-13 | 13F | Mariner, LLC | 2.369 | 214 | ||||||
| 2026-02-17 | 13F | Susquehanna International Group, Llp | 19.752 | -94,06 | 1.781 | -87,34 | ||||
| 2026-02-17 | 13F | Two Sigma Investments, Lp | 0 | -100,00 | 0 | |||||
| 2026-01-30 | 13F | Glenorchy Capital Ltd | 46.101 | -4,31 | 4.157 | 104,03 | ||||
| 2026-02-13 | 13F | Marshall Wace, Llp | 0 | -100,00 | 0 | |||||
| 2026-02-13 | 13F | Van Eck Associates Corp | 3.438 | 103,19 | 0 | |||||
| 2026-02-11 | 13F | Fox Run Management, L.l.c. | 6.696 | 604 | ||||||
| 2025-09-29 | NP | ARGT - Global X MSCI Argentina ETF This fund is a listed as child fund of Mirae Asset Global Investments Co., Ltd. and if that institution has disclosed ownership in this security, then these positions will not be double counted when calculating total shares and total value | 495.353 | -12,66 | 34.625 | -31,03 | ||||
| 2026-02-13 | 13F | Itau Unibanco Holding S.A. | 6.030 | 541 | ||||||
| 2026-02-17 | 13F | Susquehanna International Group, Llp | Put | 384.100 | -30,10 | 34.630 | 49,02 | |||
| 2025-12-09 | 13F/A | Tudor Investment Corp Et Al | Call | 0 | -100,00 | 0 | -100,00 | |||
| 2026-02-17 | 13F | Susquehanna International Group, Llp | Call | 156.300 | 435,27 | 14.092 | 1.041,98 | |||
| 2025-09-25 | NP | VMMSX - Vanguard Emerging Markets Select Stock Fund Investor Shares | 2.275 | -81,95 | 159 | -44,79 | ||||
| 2026-01-30 | 13F | Us Bancorp \de\ | 4.350 | 0,00 | 392 | 114,21 | ||||
| 2025-11-13 | 13F/A | Peak6 Llc | Put | 0 | -100,00 | 0 | ||||
| 2025-11-12 | 13F | Stifel Financial Corp | 0 | -100,00 | 0 | -100,00 | ||||
| 2026-02-17 | 13F | Graham Capital Management, L.P. | 0 | -100,00 | 0 | |||||
| 2025-11-14 | 13F | Northwestern Mutual Wealth Management Co | 0 | -100,00 | 0 | |||||
| 2025-09-29 | NP | AIM INVESTMENT FUNDS (INVESCO INVESTMENT FUNDS) - Invesco Oppenheimer International Bond Fund Class R6 | 950.000 | 0,00 | 6.525 | -23,28 | ||||
| 2026-02-02 | 13F | Advisors Preferred, LLC | 2.770 | -4,61 | 246 | 109,40 | ||||
| 2026-02-19 | 13F | Invesco Ltd. | 10.327 | -0,48 | 931 | 112,56 | ||||
| 2026-02-13 | 13F | Morgan Stanley | 425.316 | 17,81 | 38.346 | 151,19 | ||||
| 2026-02-10 | 13F | Goldman Sachs Group Inc | 164.217 | 19,41 | 14.806 | 154,60 | ||||
| 2026-02-17 | 13F | MIRAE ASSET GLOBAL ETFS HOLDINGS Ltd. | 392.224 | -19,13 | 35.363 | 72,40 | ||||
| 2026-02-09 | 13F | Hantz Financial Services, Inc. | 63 | -87,65 | 0 | |||||
| 2026-02-17 | 13F | Amundi | 9.740 | 878 | ||||||
| 2026-02-13 | 13F | Cape Ann Asset Management Ltd | 465.016 | 0,82 | 41.926 | 114,96 | ||||
| 2026-02-17 | 13F | Millennium Management Llc | 275.421 | -52,12 | 24.832 | 2,08 | ||||
| 2026-02-17 | 13F | Point72 Asset Management, L.P. | 0 | -100,00 | 0 | |||||
| 2026-02-17 | 13F | Tower Research Capital LLC (TRC) | 8 | -88,41 | 1 | -100,00 | ||||
| 2025-11-14 | 13F | Integrated Wealth Concepts LLC | 0 | -100,00 | 0 | -100,00 | ||||
| 2025-11-14 | 13F | Caption Management, LLC | Put | 0 | -100,00 | 0 | -100,00 | |||
| 2026-02-11 | 13F | Capital Wealth Planning, LLC | 116.905 | 10.378 | ||||||
| 2026-02-17 | 13F | Samlyn Capital, Llc | 646.741 | 58.310 | ||||||
| 2025-11-13 | 13F/A | Peak6 Llc | 0 | -100,00 | 0 | |||||
| 2025-11-12 | 13F | Gemsstock Ltd. | 0 | -100,00 | 0 | -100,00 | ||||
| 2025-11-14 | 13F | Jane Street Group, Llc | 0 | -100,00 | 0 | -100,00 | ||||
| 2025-11-14 | 13F | Caption Management, LLC | 0 | -100,00 | 0 | -100,00 | ||||
| 2026-01-15 | 13F | Allspring Global Investments Holdings, LLC | 43.958 | -22,29 | 3.963 | 65,68 | ||||
| 2025-11-10 | 13F | Wrapmanager Inc | 0 | -100,00 | 0 | -100,00 | ||||
| 2025-09-26 | NP | Global Macro Capital Opportunities Portfolio - Global Macro Capital Opportunities Portfolio | 159.490 | 105,12 | 11.148 | 61,99 | ||||
| 2026-01-29 | 13F | UBS Group AG | 85.556 | 59,94 | 7.714 | 240,98 | ||||
| 2025-11-12 | 13F | Erste Asset Management GmbH | 0 | -100,00 | 0 | -100,00 | ||||
| 2026-02-11 | 13F | Group One Trading, L.p. | Call | 34.700 | 2,66 | 3.129 | 118,89 | |||
| 2026-02-17 | 13F | Citadel Advisors Llc | Call | 91.700 | -11,23 | 8.268 | 89,26 | |||
| 2026-02-17 | 13F | Alphadyne Asset Management, LLC | 10.100 | 1,00 | 911 | 115,64 | ||||
| 2026-02-11 | 13F | Group One Trading, L.p. | 26.134 | -67,35 | 2.356 | -30,38 | ||||
| 2026-02-17 | 13F | Citadel Advisors Llc | 28.151 | 2.538 | ||||||
| 2025-11-12 | 13F | Headlands Technologies LLC | 0 | -100,00 | 0 | -100,00 | ||||
| 2026-02-17 | 13F | Citadel Advisors Llc | Put | 80.700 | 27,09 | 7.276 | 170,95 | |||
| 2026-02-13 | 13F | Toroso Investments, LLC | 0 | -100,00 | 0 | |||||
| 2026-02-10 | 13F | Bnp Paribas Arbitrage, Sa | 7.544 | -65,94 | 680 | -27,35 | ||||
| 2026-02-17 | 13F | Aquatic Capital Management LLC | 0 | -100,00 | 0 | |||||
| 2026-01-29 | 13F | Deltec Asset Management Llc | 8.300 | 27,69 | 748 | 172,99 | ||||
| 2025-11-14 | 13F | Walleye Trading LLC | 0 | -100,00 | 0 | -100,00 | ||||
| 2026-02-13 | 13F | Verition Fund Management LLC | 138.760 | 1.060,59 | 12.511 | 2.377,23 | ||||
| 2026-02-13 | 13F | Wells Fargo & Company/mn | 1.865 | -65,14 | 168 | -25,66 | ||||
| 2026-02-17 | 13F | Mirabella Financial Services Llp | 8.389 | 756 | ||||||
| 2026-01-30 | 13F | Sigma Planning Corp | 6.289 | 1,27 | 567 | 116,41 | ||||
| 2026-02-13 | 13F | Candriam Luxembourg S.C.A. | 283.920 | -11,99 | 25.599 | 87,65 | ||||
| 2026-02-03 | 13F | Diversify Wealth Management, Llc | 0 | -100,00 | 0 | |||||
| 2026-02-17 | 13F | Raymond James Financial Inc | 3.359 | 303 | ||||||
| 2026-02-17 | 13F | Advisory Services Network, LLC | 0 | -100,00 | 0 | |||||
| 2025-11-12 | 13F | Ci Investments Inc. | 0 | -100,00 | 0 | -100,00 | ||||
| 2025-10-09 | 13F | Harbour Capital Advisors, LLC | 0 | -100,00 | 0 | -100,00 | ||||
| 2026-01-26 | 13F | JGP Global Gestao de Recursos Ltda. | 3.700 | 334 | ||||||
| 2025-11-07 | 13F | Fiera Capital Corp | 0 | -100,00 | 0 | -100,00 | ||||
| 2025-11-12 | 13F | SPX Equities Gestao de Recursos Ltda | 0 | -100,00 | 0 | |||||
| 2026-01-30 | 13F | Activest Wealth Management | 4.440 | -45,75 | 400 | 15,61 | ||||
| 2026-02-17 | 13F | Royal Bank Of Canada | 550 | -56,07 | 49 | -7,55 | ||||
| 2025-11-14 | 13F | Cetera Investment Advisers | 0 | -100,00 | 0 | |||||
| 2025-10-20 | 13F | Shilanski & Associates, Inc. | 0 | -100,00 | 0 | -100,00 | ||||
| 2025-09-26 | NP | UBPIX - Ultralatin America Profund Investor Class | 0 | -100,00 | 0 | -100,00 | ||||
| 2026-01-28 | 13F | Kapitalo Investimentos Ltda | 0 | -100,00 | 0 | |||||
| 2025-11-14 | 13F | Turim 21 Investimentos Ltda. | 0 | -100,00 | 0 | -100,00 | ||||
| 2026-02-12 | 13F | Jane Street Group, Llc | Call | 17.000 | 1.533 | |||||
| 2025-10-29 | 13F | Yorktown Management & Research Co Inc | 0 | -100,00 | 0 | -100,00 | ||||
| 2026-02-12 | 13F | Jane Street Group, Llc | Put | 8.000 | 45,45 | 721 | 210,78 | |||
| 2026-01-28 | 13F | CAPROCK Group, Inc. | 20.000 | 1.803 | ||||||
| 2026-02-12 | 13F | Barometer Capital Management Inc. | 0 | -100,00 | 0 | |||||
| 2026-02-11 | 13F | Group One Trading, L.p. | Put | 42.100 | -49,46 | 3.796 | 7,75 | |||
| 2026-01-27 | 13F | Fundamenta Capital S.A. | 190.000 | 17.130 | ||||||
| 2026-02-17 | 13F | PointState Capital LP | 857.488 | 266,87 | 77.311 | 682,18 | ||||
| 2026-02-13 | 13F | Y-Intercept (Hong Kong) Ltd | 0 | -100,00 | 0 | |||||
| 2026-02-12 | 13F | Banco BTG Pactual S.A. | 47.477 | 58,60 | 4.281 | 238,34 | ||||
| 2025-10-24 | 13F | Bayforest Capital Ltd | 0 | -100,00 | 0 | |||||
| 2026-01-23 | 13F | TT International Asset Management LTD | 456.718 | -38,31 | 41 | -99,87 | ||||
| 2025-11-05 | 13F | AdvisorShares Investments LLC | 0 | -100,00 | 0 | -100,00 | ||||
| 2026-02-17 | 13F | Engineers Gate Manager LP | 0 | -100,00 | 0 | |||||
| 2025-11-06 | 13F | Atria Investments Llc | 0 | -100,00 | 0 | -100,00 | ||||
| 2026-02-17 | 13F | Brevan Howard Capital Management LP | 67.300 | 318,79 | 6.045 | 790,13 | ||||
| 2025-10-24 | 13F | ORG Partners LLC | 0 | -100,00 | 0 | -100,00 | ||||
| 2025-11-14 | 13F | Wolverine Trading, Llc | Put | 0 | -100,00 | 0 | -100,00 | |||
| 2026-03-06 | 13F | Hsbc Holdings Plc | 37.228 | 85,74 | 3.315 | 292,65 | ||||
| 2025-11-14 | 13F/A | Skopos Labs, Inc. | 0 | -100,00 | 0 | -100,00 | ||||
| 2026-02-14 | 13F | Militia Capital Partners, LP | 33.400 | -20,48 | 3.011 | 69,54 | ||||
| 2026-02-13 | 13F | Arrowstreet Capital, Limited Partnership | 78.326 | 7.062 | ||||||
| 2026-02-11 | 13F | Simplex Trading, Llc | Put | 32.100 | -10,08 | 2.894 | 289.300,00 | |||
| 2026-02-10 | 13F | Eurizon Capital SGR S.p.A. | 42.715 | 3.851 | ||||||
| 2026-02-11 | 13F | Simplex Trading, Llc | 13.731 | -60,33 | 1.238 | 123.600,00 | ||||
| 2026-02-11 | 13F | Jpmorgan Chase & Co | 6.431 | -94,36 | 580 | -87,99 | ||||
| 2026-02-06 | 13F | EverSource Wealth Advisors, LLC | 429 | -45,97 | 39 | 15,15 | ||||
| 2026-02-11 | 13F | X-Square Capital, LLC | 11.556 | -83,85 | 1 | -66,67 | ||||
| 2026-02-11 | 13F | Simplex Trading, Llc | Call | 12.500 | 204,88 | 1.127 | ||||
| 2025-09-26 | NP | Global Macro Portfolio - Global Macro Portfolio | 24.000 | 151,23 | 1.678 | 98,46 | ||||
| 2026-02-02 | 13F | Benjamin Edwards Inc | 5.389 | -10,12 | 486 | 92,09 | ||||
| 2026-02-10 | 13F | Titan Global Capital Management Usa Llc | 12.586 | 56,56 | 1.135 | 234,51 | ||||
| 2026-02-12 | 13F | Insigneo Advisory Services, Llc | 4.741 | -54,73 | 427 | -3,39 | ||||
| 2025-11-12 | 13F | TCG Advisory Services, LLC | 0 | -100,00 | 0 | -100,00 | ||||
| 2026-02-17 | 13F | Wellington Management Group Llp | 24.764 | -7,53 | 2.233 | 97,17 | ||||
| 2026-02-13 | 13F | Walleye Trading LLC | Put | 1.500 | 135 | |||||
| 2025-10-24 | 13F | ORG Wealth Partners, LLC | 0 | -100,00 | 0 | -100,00 | ||||
| 2026-01-27 | 13F | TD Waterhouse Canada Inc. | 1 | 0,00 | 0 | |||||
| 2025-09-29 | NP | AIM INVESTMENT FUNDS (INVESCO INVESTMENT FUNDS) - Invesco Oppenheimer Global Strategic Income Fund Class R6 | 530.000 | 0,00 | 3.640 | -23,29 | ||||
| 2026-02-11 | 13F | Compass Rose Asset Management, LP | 71.390 | 6.437 | ||||||
| 2026-01-09 | 13F | Crocodile Capital Partners GmbH | 0 | -100,00 | 0 | |||||
| 2026-02-05 | 13F | Baader Bank INC | 25.000 | 149,18 | 2.254 | 432,86 | ||||
| 2026-02-13 | 13F | Walleye Trading LLC | Call | 2.000 | 180 | |||||
| 2026-02-03 | 13F | Credit Industriel Et Commercial | 355 | 32 | ||||||
| 2026-02-03 | 13F | Credit Industriel Et Commercial | Put | 1.000 | 90 | |||||
| 2026-02-13 | 13F | Laurion Capital Management LP | 3.000 | 270 | ||||||
| 2026-02-17 | 13F | NorthRock Partners, LLC | 6.000 | 0,00 | 541 | 113,44 | ||||
| 2026-02-17 | 13F | GAM Holding AG | 4.292 | -71,44 | 387 | -39,21 | ||||
| 2025-11-14 | 13F | Walleye Capital LLC | 0 | -100,00 | 0 | |||||
| 2025-11-05 | 13F | Envestnet Asset Management Inc | 0 | -100,00 | 0 | |||||
| 2026-02-17 | 13F | Alpine Global Management, LLC | 75.000 | 6.762 | ||||||
| 2026-01-28 | 13F | Aquamarine Financial (Cayman) Ltd | 564.501 | 23,80 | 50.895 | 163,95 | ||||
| 2025-10-21 | 13F | Global Retirement Partners, LLC | 0 | -100,00 | 0 | -100,00 | ||||
| 2026-01-05 | 13F | GAMMA Investing LLC | 271 | -4,24 | 24 | 118,18 | ||||
| 2026-02-12 | 13F | BlackRock, Inc. | 584.763 | -33,17 | 52.722 | 42,48 | ||||
| 2026-02-17 | 13F | Discovery Capital Management, Llc / Ct | 49.000 | 4.418 | ||||||
| 2025-10-23 | 13F | SG Americas Securities, LLC | 0 | -100,00 | 0 | |||||
| 2026-02-13 | 13F | Caitong International Asset Management Co., Ltd | 0 | -100,00 | 0 | |||||
| 2026-02-10 | 13F | Measured Wealth Private Client Group, LLC | 742 | -54,87 | 67 | -4,35 | ||||
| 2026-02-17 | 13F | XTX Topco Ltd | 6.556 | 591 | ||||||
| 2025-11-13 | 13F | Oaktree Capital Management Lp | 0 | -100,00 | 0 | |||||
| 2026-01-08 | 13F | Chesapeake Asset Management Llc | 15.916 | 34,84 | 1.435 | 187,37 | ||||
| 2025-11-17 | 13F | GWM Advisors LLC | 0 | -100,00 | 0 | |||||
| 2026-02-17 | 13F | Voleon Capital Management Lp | 0 | -100,00 | 0 | |||||
| 2025-11-14 | 13F | Rokos Capital Management LLP | 0 | -100,00 | 0 | -100,00 | ||||
| 2026-01-23 | 13F | Deprince Race & Zollo Inc | 42.526 | 3.834 | ||||||
| 2026-02-10 | 13F | CIBC World Markets Inc. | 2.789 | 251 | ||||||
| 2025-09-26 | NP | Global Macro Absolute Return Advantage Portfolio - Global Macro Absolute Return Advantage Portfolio | 84.400 | 124,05 | 5.900 | 76,93 | ||||
| 2025-11-14 | 13F | Cubist Systematic Strategies, LLC | 34.622 | -70,60 | 1.464 | -82,29 | ||||
| 2026-02-11 | 13F | Ramirez Asset Management, Inc. | 56.746 | 5.116 | ||||||
| 2026-02-12 | 13F | Hrt Financial Lp | 2.631 | 0 | ||||||
| 2026-01-23 | 13F | Farther Finance Advisors, LLC | 328 | -8,38 | 30 | 93,33 | ||||
| 2026-02-13 | 13F | Citigroup Inc | 68.592 | 6.184 | ||||||
| 2025-11-14 | 13F | Point72 Asia (Singapore) Pte. Ltd. | 0 | -100,00 | 0 | |||||
| 2026-02-13 | 13F | Atlas Capital Advisors Llc | 1.802 | -62,51 | 162 | -51,93 | ||||
| 2026-02-17 | 13F | Voloridge Investment Management, Llc | 17.600 | -86,71 | 1.587 | -71,67 | ||||
| 2025-11-13 | 13F/A | Peak6 Llc | Call | 0 | -100,00 | 0 | ||||
| 2025-10-20 | 13F | Legal Advantage Investments, Inc. | 0 | -100,00 | 0 | -100,00 | ||||
| 2026-02-17 | 13F | Northern Trust Corp | 2.584 | 233 | ||||||
| 2026-01-16 | 13F | Ronald Blue Trust, Inc. | 490 | 0,00 | 44 | 120,00 | ||||
| 2026-02-17 | 13F | PharVision Advisers, LLC | 2.870 | 259 | ||||||
| 2026-01-30 | 13F | ABS Direct Equity Fund LLC | 16.300 | -46,64 | 1.470 | 13,79 | ||||
| 2025-10-16 | 13F | Burns Matteson Capital Management, LLC | 0 | -100,00 | 0 | -100,00 | ||||
| 2025-11-18 | 13F | Dorsey Wright & Associates | 0 | -100,00 | 0 | -100,00 | ||||
| 2025-11-14 | 13F | Larson Financial Group LLC | 0 | -100,00 | 0 | -100,00 | ||||
| 2025-11-06 | 13F | Ameritas Advisory Services, LLC | 0 | -100,00 | 0 | |||||
| 2026-02-10 | 13F | Monaco Asset Management SAM | 5.900 | -92,87 | 532 | -84,82 | ||||
| 2026-01-23 | 13F | Assetmark, Inc | 11 | 1 | ||||||
| 2026-02-17 | 13F | Balyasny Asset Management Llc | 0 | -100,00 | 0 | |||||
| 2026-02-13 | 13F | Barclays Plc | 5.006 | -71,76 | 451 | -39,79 | ||||
| 2026-01-29 | 13F | Pictet Asset Management Holding SA | 52.408 | -57,43 | 4.725 | -9,24 | ||||
| 2026-02-03 | 13F | SBI Securities Co., Ltd. | 703 | 43,76 | 63 | 215,00 | ||||
| 2026-02-17 | 13F | Qube Research & Technologies Ltd | 0 | -100,00 | 0 | |||||
| 2026-02-10 | 13F | Quantbot Technologies LP | 0 | -100,00 | 0 | |||||
| 2025-11-13 | 13F | Sagil Capital Llp | 0 | -100,00 | 0 | -100,00 |
Other Listings
| US:BMA | 66,31 $ |