Grundlæggende statistik
| Institutionelle aktier (lange) | 518.890.129 - 67,50% (ex 13D/G) - change of -47,26MM shares -8,35% MRQ |
| Institutionel værdi (lang) | $ 3.152.221 USD ($1000) |
Institutionelt ejerskab og aktionærer
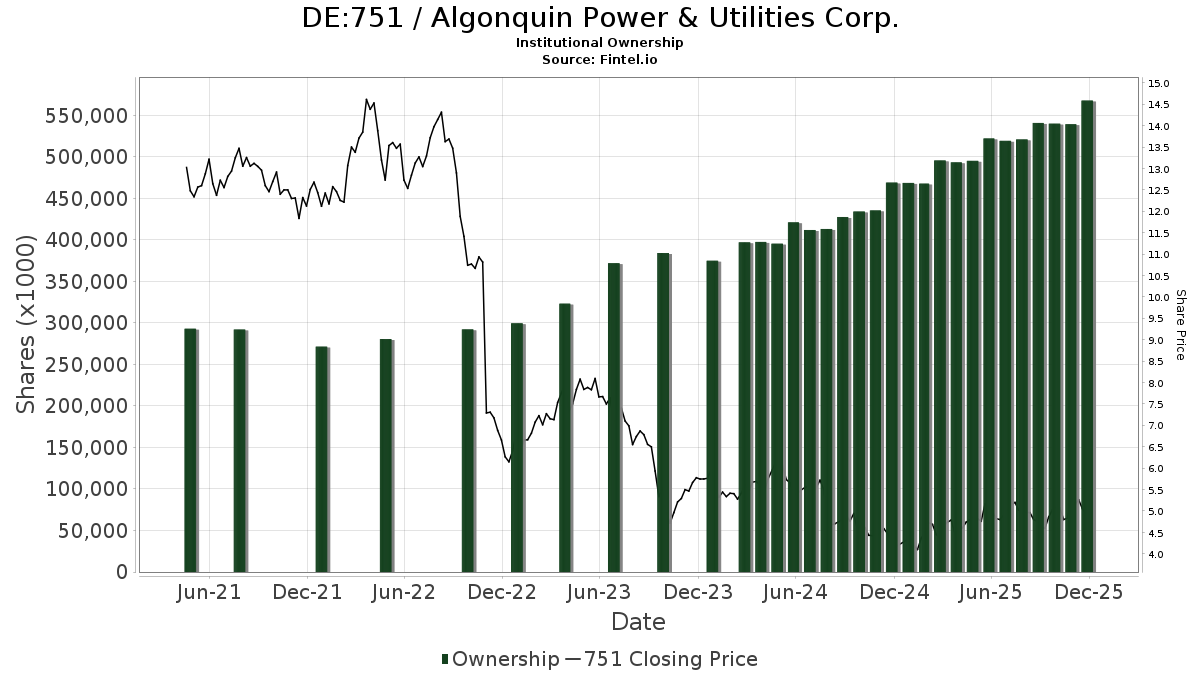
Algonquin Power & Utilities Corp. (DE:751) har 241 institutionelle ejere og aktionærer, der har indsendt 13D/G- eller 13F-formularer til Securities Exchange Commission (SEC). Disse institutioner har i alt 518,890,129 aktier. Største aktionærer omfatter EdgePoint Investment Group Inc., Starboard Value LP, FIL Ltd, Vanguard Group Inc, Bank Of Montreal /can/, Royal Bank Of Canada, Ariel Investments, Llc, BRITISH COLUMBIA INVESTMENT MANAGEMENT Corp, Principal Financial Group Inc, and Norges Bank .
Algonquin Power & Utilities Corp. (DB:751) institutionel ejerskabsstruktur viser aktuelle positioner i virksomheden efter institutioner og fonde, samt seneste ændringer i positionsstørrelse. Større aktionærer kan omfatte individuelle investorer, investeringsforeninger, hedgefonde eller institutioner. Skema 13D angiver, at investoren besidder (eller besidder) mere end 5 % af virksomheden og har til hensigt (eller har til hensigt at) aktivt at forfølge en ændring i forretningsstrategi. Skema 13G indikerer en passiv investering på over 5%.
The share price as of April 27, 2026 is 5,34 / share. Previously, on April 28, 2025, the share price was 4,65 / share. This represents an increase of 14,81% over that period.
Fondens stemningsscore
Fund Sentiment Score (fka Ownership Accumulation Score) finder de aktier, der bliver mest købt af fonde. Det er resultatet af en sofistikeret, multi-faktor kvantitativ model, der identificerer virksomheder med de højeste niveauer af institutionel akkumulering. Scoringsmodellen bruger en kombination af den samlede stigning i oplyste ejere, ændringerne i porteføljeallokeringer i disse ejere og andre målinger. Tallet går fra 0 til 100, hvor højere tal indikerer et højere niveau af akkumulering for sine jævnaldrende, og 50 er gennemsnittet.
Opdateringsfrekvens: Dagligt
Se Ownership Explorer, som giver en liste over højest rangerende virksomheder.
AI+ Ask Fintel’s AI assistant about Algonquin Power & Utilities Corp..
Select a question to share a public post with an AI-crafted answer.
Thinking of good questions…
13F og NPORT arkivering
Detaljer om 13F-arkivering er gratis. Detaljer om NP-ansøgninger kræver et premium-medlemskab. Grønne rækker angiver nye positioner. Røde rækker angiver lukkede positioner. Klik på linket ikon for at se den fulde transaktionshistorik.
Opgrader
for at låse premium-data op og eksportere til Excel ![]() .
.
| Fil dato | Kilde | Investor | Type | Gennemsnitlig pris (Øst) |
Aktier | Δ Aktier (%) |
Rapporteret Værdi ($1000) |
Δ Værdi (%) |
Port Alloc (%) |
|
|---|---|---|---|---|---|---|---|---|---|---|
| 2026-02-13 | 13F | Mariner, LLC | 76.599 | -0,96 | 471 | 13,49 | ||||
| 2026-02-17 | 13F | Balyasny Asset Management Llc | 640.354 | -0,25 | 3.938 | 14,24 | ||||
| 2026-02-11 | 13F | Tacita Capital Inc | 24.111 | 257,20 | 148 | 311,11 | ||||
| 2025-11-14 | 13F | Ubs Asset Management Americas Inc | 0 | -100,00 | 0 | |||||
| 2025-11-14 | 13F | Susquehanna International Group, Llp | Call | 0 | -100,00 | 0 | -100,00 | |||
| 2026-02-03 | 13F | Crossmark Global Holdings, Inc. | 36.792 | -29,60 | 226 | -19,29 | ||||
| 2026-02-13 | 13F | Arrowstreet Capital, Limited Partnership | 3.944.942 | 6,12 | 24.259 | 21,46 | ||||
| 2026-02-10 | 13F | Quantbot Technologies LP | 48.996 | -87,70 | 301 | -85,92 | ||||
| 2026-01-30 | 13F | Us Bancorp \de\ | 36.626 | -1,26 | 225 | 13,07 | ||||
| 2026-02-03 | 13F | Ballentine Partners, LLC | 17.880 | -24,27 | 110 | -13,49 | ||||
| 2026-02-17 | 13F | Royal Bank Of Canada | Put | 407.700 | 0,00 | 2.507 | 14,53 | |||
| 2026-04-27 | 13F | Y-Intercept (Hong Kong) Ltd | 0 | -100,00 | 0 | |||||
| 2026-02-17 | 13F | Massar Capital Management, LP | 0 | -100,00 | 0 | |||||
| 2026-02-17 | 13F | Quadrature Capital Ltd | 223.700 | 29,61 | 1.377 | 48,70 | ||||
| 2026-02-17 | 13F | Qube Research & Technologies Ltd | 2.618.838 | 155,52 | 16.106 | 192,61 | ||||
| 2026-02-12 | 13F | Nuveen, LLC | 549.708 | 0,00 | 3.385 | 14,52 | ||||
| 2025-11-14 | 13F | Strategic Wealth Partners, Ltd. | 315 | 0,00 | 2 | 0,00 | ||||
| 2026-01-22 | 13F | Bfsg, Llc | 47.310 | 0,00 | 291 | 14,17 | ||||
| 2026-02-13 | 13F | BRITISH COLUMBIA INVESTMENT MANAGEMENT Corp | 13.084.592 | -0,23 | 80.461 | 14,17 | ||||
| 2025-11-20 | 13F | First Affirmative Financial Network | 0 | -100,00 | 0 | |||||
| 2026-02-17 | 13F | Jain Global LLC | 41.181 | -84,91 | 253 | -82,73 | ||||
| 2026-02-17 | 13F | Royal Bank Of Canada | Call | 2.100 | 0,00 | 13 | 18,18 | |||
| 2026-02-11 | 13F | Group One Trading, L.p. | Call | 0 | -100,00 | 0 | -100,00 | |||
| 2026-02-12 | 13F | Quadrant Capital Group Llc | 26.450 | 2,17 | 163 | 16,55 | ||||
| 2026-01-27 | 13F | TD Waterhouse Canada Inc. | 1.258.625 | -4,15 | 7.730 | 3,16 | ||||
| 2025-10-30 | 13F | Twin Peaks Wealth Advisors, LLC | 0 | -100,00 | 0 | |||||
| 2026-02-12 | 13F | Steward Partners Investment Advisory, Llc | 1.765 | 10,45 | 11 | 25,00 | ||||
| 2026-04-09 | 13F | Pacifica Partners Inc. | 5.950 | 36 | ||||||
| 2026-04-13 | 13F | Wedge Capital Management L L P/nc | 419.781 | -11,25 | 2.577 | -11,38 | ||||
| 2026-02-05 | 13F | Phoenix Holdings Ltd. | 27.516 | -6,08 | 169 | 7,64 | ||||
| 2026-01-21 | 13F/A | Euro Pacific Asset Management, LLC | 354.050 | -0,17 | 2 | 100,00 | ||||
| 2026-02-13 | 13F | Neuberger Berman Group LLC | 4.540.036 | 8,63 | 27.921 | 24,41 | ||||
| 2026-02-14 | 13F | Rockefeller Capital Management L.P. | 467 | -51,15 | 3 | -60,00 | ||||
| 2026-04-07 | 13F | Signaturefd, Llc | 43.151 | -2,02 | 265 | -2,22 | ||||
| 2026-02-02 | 13F | Millstone Evans Group, LLC | 0 | -100,00 | 0 | |||||
| 2026-02-17 | 13F | Graham Capital Management, L.P. | 0 | -100,00 | 0 | |||||
| 2026-02-17 | 13F | Equitable Holdings, Inc. | 17.069 | 0,01 | 105 | 14,29 | ||||
| 2025-11-13 | 13F | Marshall Wace, Llp | 0 | -100,00 | 0 | -100,00 | ||||
| 2026-02-17 | 13F | Optiver Holding B.V. | 3 | 0 | ||||||
| 2026-02-17 | 13F | Tower Research Capital LLC (TRC) | 11.900 | 76,32 | 73 | 102,78 | ||||
| 2026-02-17 | 13F | Fmr Llc | 3.963 | 10,82 | 24 | 26,32 | ||||
| 2026-02-12 | 13F | Jane Street Group, Llc | 2.360.297 | -31,01 | 14.517 | -21,03 | ||||
| 2026-02-17 | 13F | Lazard Asset Management Llc | 0 | -100,00 | 0 | |||||
| 2026-02-11 | 13F | Group One Trading, L.p. | 7.479 | 74,78 | 46 | 104,55 | ||||
| 2026-02-12 | 13F | Bank Of Nova Scotia Trust Co | 22.500 | -8,16 | 138 | 5,34 | ||||
| 2026-02-17 | 13F | Guardian Partners Inc. | 0 | -100,00 | 0 | |||||
| 2026-01-27 | 13F | WealthCollab, LLC | 719 | 0,00 | 4 | 33,33 | ||||
| 2026-02-17 | 13F | Toronto Dominion Bank | Put | 11.200 | -2,61 | 69 | 11,48 | |||
| 2026-02-17 | 13F | Credit Agricole S A | 256.873 | -37,91 | 1.580 | -28,91 | ||||
| 2026-04-24 | 13F | Triasima Portfolio Management inc. | 622.325 | 208,49 | 3.799 | 205,88 | ||||
| 2026-02-13 | 13F | First Trust Advisors Lp | 6.858.330 | 1,29 | 42.179 | 16,01 | ||||
| 2026-02-17 | 13F | Toronto Dominion Bank | Call | 6.300 | 0,00 | 39 | 15,15 | |||
| 2026-02-13 | 13F | Aviso Financial Inc. | 1.040 | 6 | ||||||
| 2026-02-17 | 13F | Two Sigma Securities, Llc | 56.626 | 46,52 | 348 | 68,12 | ||||
| 2026-04-14 | 13F | Nbc Securities, Inc. | 2.634 | 0,50 | 16 | 0,00 | ||||
| 2026-02-13 | 13F | Bank Of Nova Scotia | 10.276.178 | 1,04 | 63.187 | 15,59 | ||||
| 2026-01-28 | 13F | Kingswood Wealth Advisors, Llc | 13.760 | -11,85 | 85 | 1,20 | ||||
| 2026-02-17 | 13F | EdgePoint Investment Group Inc. | 81.727.385 | 32,56 | 502.563 | 51,70 | ||||
| 2026-02-17 | 13F | Susquehanna International Group, Llp | 140.886 | 34,77 | 866 | 54,37 | ||||
| 2026-02-17 | 13F | State Of Wisconsin Investment Board | 18.579 | 114 | ||||||
| 2026-02-17 | 13F | Russell Investments Group, Ltd. | 183.915 | 15,55 | 1.132 | 32,44 | ||||
| 2025-11-14 | 13F | AXA Investment Managers S.A. | 578.910 | 3.109 | ||||||
| 2026-02-11 | 13F | Cerity Partners LLC | 53.392 | 1,45 | 328 | 16,31 | ||||
| 2026-02-13 | 13F | Callodine Capital Management, LP | 5.749.636 | 3,01 | 35.360 | 17,97 | ||||
| 2026-04-23 | 13F | North Star Investment Management Corp. | 1.800 | 0,00 | 11 | 0,00 | ||||
| 2026-01-15 | 13F | Founders Capital Management | 0 | -100,00 | 0 | -100,00 | ||||
| 2026-02-17 | 13F | Tudor Investment Corp Et Al | 10.056 | 62 | ||||||
| 2026-04-17 | 13F | Cidel Asset Management Inc | 3.535.918 | 42,13 | 21.587 | 40,93 | ||||
| 2026-02-17 | 13F | Aquatic Capital Management LLC | 325.064 | -30,10 | 1.999 | -19,94 | ||||
| 2026-02-13 | 13F | Stifel Financial Corp | 85.641 | -3,47 | 527 | 10,50 | ||||
| 2025-11-14 | 13F | ExodusPoint Capital Management, LP | 0 | -100,00 | 0 | |||||
| 2026-01-23 | 13F | Natural Investments, Llc | 20.207 | 0,00 | 0 | |||||
| 2026-01-27 | 13F | Evergreen Capital Management Llc | 14.296 | -8,14 | 89 | 4,76 | ||||
| 2026-02-05 | 13F | Cambridge Investment Research Advisors, Inc. | 15.416 | -1,93 | 0 | |||||
| 2026-02-12 | 13F | Commonwealth Equity Services, Llc | 248.893 | 7,22 | 1.531 | 152.900,00 | ||||
| 2026-02-17 | 13F | D. E. Shaw & Co., Inc. | 5.349.003 | 52,66 | 32.896 | 74,80 | ||||
| 2026-01-27 | 13F | Zurcher Kantonalbank (Zurich Cantonalbank) | 233.481 | 16,73 | 1.438 | 33,67 | ||||
| 2026-02-17 | 13F | Toronto Dominion Bank | 8.470.658 | 27,58 | 52.088 | 45,99 | ||||
| 2026-02-13 | 13F | BNP Paribas Asset Management Holding S.A. | 578.910 | 5 | ||||||
| 2026-02-10 | 13F | CIBC World Markets Inc. | 3.700.005 | -42,83 | 22.755 | -34,57 | ||||
| 2026-02-17 | 13F | Aqr Capital Management Llc | 11.252 | -63,71 | 69 | -58,43 | ||||
| 2026-01-23 | 13F | Westside Investment Management, Inc. | 1.355 | 0,00 | 8 | 14,29 | ||||
| 2026-02-10 | 13F | Norges Bank | 10.906.124 | 67.065 | ||||||
| 2026-02-11 | 13F | Franklin Resources Inc | 607.652 | 1.315,45 | 3.737 | 1.412,96 | ||||
| 2026-01-26 | 13F | Cwm, Llc | 2.433 | 2,49 | 0 | |||||
| 2026-04-07 | 13F | Farther Finance Advisors, LLC | 4.906 | 27,36 | 31 | 30,43 | ||||
| 2026-02-12 | 13F | Hrt Financial Lp | 41.894 | -58,37 | 0 | |||||
| 2026-03-20 | 13F | Purpose Unlimited Inc. | 75.578 | 465 | ||||||
| 2026-02-13 | 13F | Focused Alpha, Llc | 34.721 | 214 | ||||||
| 2026-02-13 | 13F | Toroso Investments, LLC | 106.624 | -41,96 | 656 | -33,57 | ||||
| 2026-02-11 | 13F | Simplex Trading, Llc | 157.355 | 39,71 | 968 | |||||
| 2026-02-17 | 13F | Greenland Capital Management LP | 531.730 | -42,66 | 3.274 | -34,33 | ||||
| 2026-02-03 | 13F | Credit Industriel Et Commercial | 130.000 | 0,00 | 800 | 14,47 | ||||
| 2026-02-18 | 13F | GWM Advisors LLC | 7.627 | 47 | ||||||
| 2026-02-11 | 13F | Simplex Trading, Llc | Call | 200 | -96,83 | 1 | ||||
| 2026-02-17 | 13F | Royal Bank Of Canada | 18.169.106 | -38,16 | 111.742 | -29,17 | ||||
| 2026-04-17 | 13F | Krilogy Financial LLC | 1.387.165 | -13,15 | 8.892 | -13,55 | ||||
| 2026-02-06 | 13F | HighTower Advisors, LLC | 12.260 | -88,04 | 75 | -86,36 | ||||
| 2026-02-17 | 13F | Amundi | 82.747 | 509 | ||||||
| 2026-02-17 | 13F | Two Sigma Advisers, Lp | 92.400 | 43,48 | 568 | 64,64 | ||||
| 2025-10-29 | 13F | Formidable Asset Management, LLC | 0 | -100,00 | 0 | |||||
| 2025-11-21 | 13F | Nebula Research & Development LLC | 0 | -100,00 | 0 | |||||
| 2026-02-10 | 13F | Bank of New York Mellon Corp | 15.324 | -0,46 | 94 | 14,63 | ||||
| 2026-02-13 | 13F | Maven Securities LTD | 120.890 | 743 | ||||||
| 2026-02-13 | 13F | Ariel Investments, Llc | 15.920.654 | -2,60 | 97.912 | 11,55 | ||||
| 2026-02-10 | 13F | CIBC Asset Management Inc | 753.293 | 12,14 | 4.635 | 28,51 | ||||
| 2026-02-11 | 13F | Fiera Capital Corp | 0 | -100,00 | 0 | |||||
| 2026-02-13 | 13F | Manufacturers Life Insurance Company, The | 0 | -100,00 | 0 | |||||
| 2026-02-02 | 13F | Intact Investment Management Inc. | 4.066.619 | -12,59 | 25.005 | 0,00 | ||||
| 2026-02-05 | 13F | John G Ullman & Associates Inc | 86.250 | 16,01 | 530 | 32,83 | ||||
| 2026-04-24 | 13F | Private Advisor Group, LLC | 0 | -100,00 | 0 | |||||
| 2026-02-17 | 13F | Infrastructure Capital Advisors, Llc | 26.642 | 9,43 | 164 | 20,74 | ||||
| 2026-02-13 | 13F | Charles Schwab Investment Management Inc | 2.744.967 | 0,92 | 16.901 | 15,59 | ||||
| 2026-01-22 | 13F | Massachusetts Financial Services Co /ma/ | 25.812 | 107,66 | 159 | 139,39 | ||||
| 2026-02-13 | 13F | K2 Principal Fund, L.p. | 200.000 | 1.230 | ||||||
| 2025-11-14 | 13F | Sagard Holdings Management Inc. | 118 | -41,58 | 1 | -100,00 | ||||
| 2026-02-12 | 13F | Northwest & Ethical Investments L.P. | 935.263 | -20,10 | 5.757 | -8,39 | ||||
| 2026-02-17 | 13F | CastleKnight Management LP | 37.000 | 0,00 | 228 | 14,65 | ||||
| 2026-02-12 | 13F | Bank Of Montreal /can/ | 20.717.144 | 23,09 | 127.395 | 40,86 | ||||
| 2026-02-18 | 13F | Mackenzie Financial Corp | 885.632 | 40,56 | 5.479 | 61,83 | ||||
| 2026-02-13 | 13F | Ingalls & Snyder Llc | 0 | -100,00 | 0 | |||||
| 2026-02-17 | 13F | Citadel Advisors Llc | 2.310.227 | -48,03 | 14.208 | -40,48 | ||||
| 2026-02-04 | 13F | Swiss Life Asset Management Ltd | 34.797 | 0,00 | 214 | 13,90 | ||||
| 2025-11-14 | 13F | Centiva Capital, LP | 0 | -100,00 | 0 | -100,00 | ||||
| 2026-02-17 | 13F | Bank Of America Corp /de/ | 2.706.849 | -34,33 | 16.647 | -24,79 | ||||
| 2026-01-12 | 13F | Salem Investment Counselors Inc | 0 | -100,00 | 0 | |||||
| 2026-01-20 | 13F | Savvy Advisors, Inc. | 13.642 | -15,27 | 84 | -3,49 | ||||
| 2026-02-13 | 13F | Public Sector Pension Investment Board | 0 | -100,00 | 0 | |||||
| 2026-02-17 | 13F | Man Group plc | 1.832.026 | 70,99 | 11.267 | 95,83 | ||||
| 2026-02-17 | 13F | Canada Pension Plan Investment Board | 361.300 | 2.222 | ||||||
| 2026-02-17 | 13F | Schonfeld Strategic Advisors LLC | 39.931 | -76,00 | 246 | -72,56 | ||||
| 2025-11-14 | 13F | Caption Management, LLC | Call | 0 | -100,00 | 0 | ||||
| 2026-02-10 | 13F | State of Wyoming | 12.356 | 11,64 | 76 | 27,12 | ||||
| 2026-02-12 | 13F | Brown Brothers Harriman & Co | 580 | 4 | ||||||
| 2025-11-14 | 13F | Cubist Systematic Strategies, LLC | 1.719.208 | 9.235 | ||||||
| 2026-04-02 | 13F | Hilltop National Bank | 4.000 | 0,00 | 25 | 0,00 | ||||
| 2026-04-23 | 13F | SJS Investment Consulting Inc. | 400 | 0,00 | 2 | 0,00 | ||||
| 2026-02-17 | 13F | PDT Partners, LLC | 867.937 | -13,92 | 5.338 | -1,42 | ||||
| 2026-02-13 | 13F | State Street Corp | 2.551.100 | 15,57 | 15.855 | 32,16 | ||||
| 2026-02-03 | 13F | Manning & Napier Advisors Llc | 1.375.000 | 0,00 | 8.456 | 14,53 | ||||
| 2026-02-11 | 13F | 111 Capital | 0 | -100,00 | 0 | -100,00 | ||||
| 2026-02-17 | 13F | Leonteq Securities AG | 0 | -100,00 | 0 | |||||
| 2026-02-17 | 13F | Creative Planning | 71.555 | -7,55 | 440 | 6,02 | ||||
| 2026-01-29 | 13F | UBS Group AG | 2.168.586 | -26,77 | 13.337 | -16,14 | ||||
| 2026-02-11 | 13F | Janney Montgomery Scott LLC | 0 | -100,00 | 0 | |||||
| 2026-02-09 | 13F | Legal & General Group Plc | 6.939.528 | -9,22 | 42.728 | 3,98 | ||||
| 2026-02-12 | 13F | Principal Securities, Inc. | 0 | -100,00 | 0 | -100,00 | ||||
| 2026-04-21 | 13F | Value Partners Investments Inc. | 99.759 | 14,14 | 610 | 13,20 | ||||
| 2026-02-11 | 13F | LPL Financial LLC | 37.364 | 5,73 | 230 | 21,16 | ||||
| 2026-04-22 | 13F | Samalin Investment Counsel, LLC | 95.933 | -13,21 | 589 | -13,25 | ||||
| 2026-02-17 | 13F | SIG North Trading, ULC | 260.663 | 95,45 | 1.603 | 123,88 | ||||
| 2025-11-14 | 13F | Capstone Investment Advisors, Llc | 0 | -100,00 | 0 | |||||
| 2026-02-17 | 13F | SIG North Trading, ULC | Put | 138.600 | -21,87 | 852 | -10,50 | |||
| 2026-02-11 | 13F | Deutsche Bank Ag\ | 77.852 | -0,83 | 479 | 13,54 | ||||
| 2026-02-17 | 13F | SIG North Trading, ULC | Call | 66.400 | -66,90 | 408 | -62,12 | |||
| 2026-02-13 | 13F | Morgan Stanley | 4.093.676 | -1,00 | 25.176 | 13,38 | ||||
| 2026-02-13 | 13F | American Century Companies Inc | 172.630 | -27,94 | 1.062 | -17,56 | ||||
| 2026-02-13 | 13F | National Bank Of Canada /fi/ | Put | 373 | -23,57 | 229 | -12,60 | |||
| 2026-01-29 | 13F | Vanguard Group Inc | 34.456.155 | 2,11 | 211.871 | 16,81 | ||||
| 2026-02-13 | 13F | Cornerstone Financial Management LLC | 81 | 0 | ||||||
| 2026-02-13 | 13F | Great West Life Assurance Co /can/ | 226.608 | -55,26 | 1 | -50,00 | ||||
| 2026-02-13 | 13F | Squarepoint Ops LLC | 26.936 | -82,89 | 166 | -80,47 | ||||
| 2026-02-13 | 13F | Wells Fargo & Company/mn | 35.902 | -32,45 | 221 | -22,81 | ||||
| 2026-04-21 | 13F | Wedbush Securities Inc | 10.200 | 0,00 | 0 | |||||
| 2026-02-05 | 13F | Gamco Investors, Inc. Et Al | 3.286.322 | 8,46 | 20.211 | 24,22 | ||||
| 2026-02-13 | 13F | Southeast Asset Advisors Inc. | 0 | -100,00 | 0 | |||||
| 2026-02-13 | 13F | Dynamic Technology Lab Private Ltd | 35.424 | -83,78 | 218 | -81,42 | ||||
| 2025-11-14 | 13F | Skopos Labs, Inc. | 0 | -100,00 | 0 | |||||
| 2026-02-17 | 13F | Investment Management Corp of Ontario | 85.690 | 231,53 | 527 | 281,16 | ||||
| 2026-04-16 | 13F | ARS Investment Partners, LLC | 0 | -100,00 | 0 | |||||
| 2026-02-13 | 13F | HITE Hedge Asset Management LLC | 200.000 | 1.230 | ||||||
| 2026-02-10 | 13F | Td Asset Management Inc | 2.433.309 | 4,56 | 14.982 | 19,76 | ||||
| 2026-02-17 | 13F | Point72 Asset Management, L.P. | 1.859.307 | 555,33 | 11.435 | 650,26 | ||||
| 2026-02-06 | 13F | Larson Financial Group LLC | 163 | 87,36 | 1 | |||||
| 2026-02-13 | 13F | Caitong International Asset Management Co., Ltd | 2 | -75,00 | 0 | |||||
| 2026-02-09 | 13F | Geode Capital Management, Llc | 1.919.900 | 8,52 | 14.529 | 23,10 | ||||
| 2026-02-13 | 13F | C M Bidwell & Associates Ltd | 13.490 | 83 | ||||||
| 2026-02-17 | 13F | Cetera Investment Advisers | 230.833 | 6,69 | 1.421 | 22,18 | ||||
| 2026-02-17 | 13F | Anson Funds Management LP | 0 | -100,00 | 0 | |||||
| 2026-02-17 | 13F | Northern Trust Corp | 452.349 | -14,98 | 2.782 | -2,66 | ||||
| 2026-02-17 | 13F | PharVision Advisers, LLC | 0 | -100,00 | 0 | |||||
| 2026-02-12 | 13F | Federation des caisses Desjardins du Quebec | 3.028.957 | -52,38 | 18.614 | -45,37 | ||||
| 2026-02-13 | 13F | National Bank Of Canada /fi/ | 5.423.404 | -45,28 | 33.313 | -37,40 | ||||
| 2026-02-17 | 13F | Magnetar Financial LLC | 43.781 | -83,90 | 269 | -81,56 | ||||
| 2026-04-07 | 13F | Central Pacific Bank - Trust Division | 5.000 | 0,00 | 31 | 0,00 | ||||
| 2026-02-19 | 13F | Invesco Ltd. | 3.053.534 | 0,45 | 18.779 | 15,04 | ||||
| 2026-02-13 | 13F | SRS Capital Advisors, Inc. | 1.032 | 6.780,00 | 6 | |||||
| 2026-02-11 | 13F | Vise Technologies, Inc. | 0 | -100,00 | 0 | |||||
| 2026-02-13 | 13F | Kayne Anderson Capital Advisors Lp | 770.878 | -1,18 | 4.741 | 13,15 | ||||
| 2026-01-21 | 13F | Crews Bank & Trust | 367 | 0,00 | 2 | 100,00 | ||||
| 2026-02-05 | 13F | Center for Financial Planning, Inc. | 2 | 0,00 | 0 | |||||
| 2026-04-24 | 13F | UMA Financial Services, Inc. | 619 | 0,00 | 4 | 0,00 | ||||
| 2026-02-13 | 13F | Barclays Plc | 435.026 | -5,12 | 2.675 | 8,65 | ||||
| 2026-04-20 | 13F | Ronald Blue Trust, Inc. | 0 | -100,00 | 0 | |||||
| 2026-04-08 | 13F | Post Resch Tallon Group Inc. | 43.000 | 59,26 | 271 | 63,25 | ||||
| 2026-02-17 | 13F | Alliancebernstein L.p. | 106.021 | 0,00 | 652 | 14,59 | ||||
| 2026-02-17 | 13F | Public Employees Retirement System Of Ohio | 2.936.911 | 2,03 | 18.066 | 16,86 | ||||
| 2026-02-11 | 13F | Jpmorgan Chase & Co | 261.344 | -3,69 | 1.607 | 10,30 | ||||
| 2026-02-12 | 13F | BlackRock, Inc. | 4.630.028 | 2,76 | 28.475 | 17,68 | ||||
| 2026-02-13 | 13F | Van Eck Associates Corp | 287.813 | 6,77 | 2 | 0,00 | ||||
| 2026-02-10 | 13F | Connor, Clark & Lunn Investment Management Ltd. | 4.943.308 | 48,61 | 30.398 | 70,06 | ||||
| 2026-02-13 | 13F | National Bank Of Canada /fi/ | Call | 1.387 | 8,61 | 853 | 24,20 | |||
| 2026-01-30 | 13F | R Squared Ltd | 11.059 | 68 | ||||||
| 2025-11-07 | 13F | Sierra Ocean, Llc | 0 | -100,00 | 0 | |||||
| 2026-04-22 | 13F | Apollon Wealth Management, LLC | 0 | -100,00 | 0 | |||||
| 2026-02-11 | 13F | Heartland Advisors Inc | 500.000 | 3.075 | ||||||
| 2025-11-14 | 13F | Mount Yale Investment Advisors, LLC | 0 | -100,00 | 0 | |||||
| 2026-04-24 | 13F | Able Wealth Management LLC | 12.538 | 77 | ||||||
| 2026-02-11 | 13F | Westerkirk Capital Inc. | 0 | -100,00 | 0 | |||||
| 2026-02-11 | 13F | Picton Mahoney Asset Management | 3.519.080 | 193,40 | 21.670 | 361.050,00 | ||||
| 2026-02-10 | 13F | Jupiter Asset Management Ltd | 918.774 | 4.665,18 | 5.657 | 5.392,23 | ||||
| 2026-02-17 | 13F | Raymond James Financial Inc | 80.678 | -21,40 | 496 | -9,98 | ||||
| 2026-02-13 | 13F | DKRT Investments Corp. | 175.000 | -12,50 | 1.076 | 0,19 | ||||
| 2026-02-13 | 13F | Aigen Investment Management, Lp | 0 | -100,00 | 0 | |||||
| 2026-02-13 | 13F | Alberta Investment Management Corp | 2.553.200 | 0,00 | 15.702 | 14,53 | ||||
| 2026-02-17 | 13F | Susquehanna Advisors Group, Inc. | 386.400 | 117,81 | 2.376 | 149,58 | ||||
| 2026-02-13 | 13F | Citigroup Inc | 216.524 | -47,76 | 1.333 | -40,17 | ||||
| 2026-02-17 | 13F | Gotham Asset Management, LLC | 293.195 | -49,77 | 1.803 | -42,47 | ||||
| 2026-02-17 | 13F | Farringdon Capital, Ltd. | 18.232 | 112 | ||||||
| 2026-02-10 | 13F | Envestnet Asset Management Inc | 37.920 | 233,66 | 233 | 281,97 | ||||
| 2026-02-18 | 13F | Vident Advisory, LLC | 31.199 | 9,61 | 192 | 25,66 | ||||
| 2026-02-17 | 13F | Engineers Gate Manager LP | 144.825 | -9,99 | 891 | 3,01 | ||||
| 2025-11-14 | 13F | Weiss Asset Management LP | 50.000 | 269 | ||||||
| 2025-11-13 | 13F | Bank Of Montreal /can/ | Put | 0 | -100,00 | 0 | -100,00 | |||
| 2026-02-13 | 13F | JustInvest LLC | 86.259 | 5,65 | 530 | 21,00 | ||||
| 2026-02-13 | 13F | MAI Capital Management | 439 | 0,00 | 3 | 0,00 | ||||
| 2026-02-12 | 13F | BRYN MAWR TRUST Co | 0 | -100,00 | 0 | -100,00 | ||||
| 2026-02-02 | 13F | Horizon Investments, LLC | 242.117 | 32,53 | 1.489 | 51,78 | ||||
| 2026-02-10 | 13F | Savant Capital, LLC | 18.498 | 114 | ||||||
| 2026-02-13 | 13F | Johnson Investment Counsel Inc | 0 | -100,00 | 0 | |||||
| 2026-03-12 | 13F/A | Peak6 Llc | Call | 18.400 | 0,00 | 113 | 15,31 | |||
| 2026-02-17 | 13F | XTX Topco Ltd | 137.453 | -26,94 | 845 | -16,34 | ||||
| 2025-11-14 | 13F | Jane Street Group, Llc | Put | 0 | -100,00 | 0 | -100,00 | |||
| 2026-02-17 | 13F | Blackstone Group Inc | 0 | -100,00 | 0 | |||||
| 2026-02-12 | 13F | Campbell & CO Investment Adviser LLC | 662.965 | 1.208,63 | 4.077 | 1.398,90 | ||||
| 2026-01-28 | 13F | DekaBank Deutsche Girozentrale | 109.141 | 0,00 | 1 | |||||
| 2026-04-21 | 13F | Hennessy Advisors Inc | 141.064 | 0,00 | 866 | -0,12 | ||||
| 2026-04-16 | 13F | SG Americas Securities, LLC | 0 | -100,00 | 0 | |||||
| 2026-02-10 | 13F | Goldman Sachs Group Inc | 5.711.454 | -42,19 | 35.125 | -33,79 | ||||
| 2026-02-13 | 13F | Transamerica Financial Advisors, Inc. | 14 | 0 | ||||||
| 2026-02-13 | 13F | Mufg Securities (canada), Ltd. | 0 | -100,00 | 0 | |||||
| 2025-11-07 | 13F | Shell Asset Management Co | 11.200 | -70,91 | 0 | |||||
| 2026-02-17 | 13F | Advisor Group Holdings, Inc. | 21.126 | -13,22 | 130 | -2,27 | ||||
| 2026-02-12 | 13F | Scotia Capital Inc. | 684.990 | -13,03 | 4.207 | -0,21 | ||||
| 2026-04-17 | 13F | United Advisor Group, LLC | 26.362 | 162 | ||||||
| 2026-01-28 | 13F | Davis-rea Ltd. | 12.264 | 0,00 | 76 | 15,15 | ||||
| 2026-02-05 | 13F | Bessemer Group Inc | 467 | 0 | ||||||
| 2026-02-03 | 13F | SBI Securities Co., Ltd. | 4.994 | 1,90 | 31 | 15,38 | ||||
| 2026-02-10 | 13F | Moors & Cabot, Inc. | 17.200 | 0,80 | 106 | 15,38 | ||||
| 2025-12-02 | 13F | IFP Advisors, Inc | 0 | -100,00 | 0 | |||||
| 2025-11-14 | 13F | Nomura Holdings Inc | Call | 0 | -100,00 | 0 | -100,00 | |||
| 2026-02-17 | 13F | Yaupon Capital Management LP | 866.736 | -85,28 | 5.330 | -83,14 | ||||
| 2026-02-10 | 13F | Foundations Investment Advisors, LLC | 14.202 | 6,65 | 87 | 22,54 | ||||
| 2026-02-17 | 13F | DZ BANK AG Deutsche Zentral Genossenschafts Bank, Frankfurt am Main | 1.552.488 | -3,12 | 9.548 | 10,83 | ||||
| 2026-02-09 | 13F | Terril Brothers, Inc. | 56.328 | 11,26 | 346 | 27,68 | ||||
| 2026-02-13 | 13F | Quinn Opportunity Partners LLC | 430.000 | 0,00 | 2.644 | 14,51 | ||||
| 2026-04-22 | 13F | Spire Wealth Management | 0 | -100,00 | 0 | |||||
| 2026-01-23 | 13F | Assetmark, Inc | 20.246 | 7.934,13 | 125 | 12.300,00 | ||||
| 2026-01-15 | 13F | Allspring Global Investments Holdings, LLC | 54.000 | 38,11 | 332 | 58,85 | ||||
| 2026-02-17 | 13F | Jump Financial, LLC | 203.834 | -60,65 | 1.254 | -54,94 | ||||
| 2026-02-13 | 13F | Natixis | 172.843 | 21,06 | 1.065 | 39,58 | ||||
| 2026-02-04 | 13F | Atlantic Union Bankshares Corp | 850 | 5 | ||||||
| 2026-01-28 | 13F | Chicago Partners Investment Group LLC | 33.960 | -12,74 | 217 | -3,14 | ||||
| 2025-11-12 | 13F | Group One Trading, L.p. | Put | 0 | -100,00 | 0 | -100,00 | |||
| 2026-02-11 | 13F | Empowered Funds, LLC | 295.515 | 1.817 | ||||||
| 2026-02-17 | 13F | FIL Ltd | 48.999.903 | -1,85 | 301.307 | 12,29 | ||||
| 2026-04-15 | 13F | Valley National Advisers Inc | 325 | 0,00 | 0 | |||||
| 2026-02-12 | 13F | Swiss National Bank | 1.445.100 | 1,31 | 8.904 | 16,10 | ||||
| 2026-02-02 | 13F | Cornerstone Planning Group LLC | 361 | 334,94 | 2 | -85,71 | ||||
| 2026-02-12 | 13F | Renaissance Technologies Llc | 1.234.992 | -42,16 | 7.595 | -33,75 | ||||
| 2026-02-17 | 13F | Trexquant Investment LP | 1.111.876 | 125,15 | 6.838 | 157,94 | ||||
| 2025-11-12 | 13F | Simplex Trading, Llc | Put | 0 | -100,00 | 0 | ||||
| 2025-11-14 | 13F | Gluskin Sheff & Assoc Inc | 0 | -100,00 | 0 | -100,00 | ||||
| 2026-04-27 | 13F | RWC Asset Management LLP | 2.231.500 | -4,27 | 13.701 | -4,43 | ||||
| 2026-02-05 | 13F | Gabelli Funds Llc | 2.186.122 | 1,34 | 13.445 | 16,07 | ||||
| 2026-01-20 | 13F | Packer & Co Ltd | 4.513.113 | 0,00 | 28 | 12,50 | ||||
| 2026-04-27 | 13F | Td Private Client Wealth Llc | 70 | 94,44 | 0 | |||||
| 2026-02-13 | 13F | Beutel, Goodman & Co Ltd. | 262.070 | -41,42 | 2 | -50,00 | ||||
| 2026-04-24 | 13F | Washington Capital Management Inc | 0 | -100,00 | 0 | |||||
| 2026-02-05 | 13F | Allworth Financial LP | 954 | -11,67 | 6 | 0,00 | ||||
| 2026-02-17 | 13F | Two Sigma Investments, Lp | 718.039 | 43,15 | 4.416 | 63,94 | ||||
| 2026-04-17 | 13F | Bell Investment Advisors, Inc | 392 | 0,00 | 2 | 0,00 | ||||
| 2026-02-17 | 13F | Jones Financial Companies Lllp | 0 | -100,00 | 0 | |||||
| 2025-11-14 | 13F | Citadel Advisors Llc | Put | 0 | -100,00 | 0 | -100,00 | |||
| 2026-02-13 | 13F | Rhumbline Advisers | 205 | 0,00 | 1 | 0,00 | ||||
| 2026-03-06 | 13F | Hsbc Holdings Plc | 0 | -100,00 | 0 | |||||
| 2025-11-13 | 13F | Macquarie Group Ltd | 0 | -100,00 | 0 | -100,00 | ||||
| 2026-01-22 | 13F | Alpha Omega Wealth Management LLC | 0 | -100,00 | 0 | |||||
| 2026-02-17 | 13F | Algert Global Llc | 56.565 | 110,99 | 0 | |||||
| 2026-02-18 | 13F | Guardian Capital Lp | 76.301 | 0,00 | 469 | 14,39 | ||||
| 2026-02-13 | 13F | Flow Traders U.s. Llc | 10.435 | 0 | ||||||
| 2026-02-17 | 13F | Consultiva Wealth Management, Corp. | 1.000 | 0,00 | 6 | 20,00 | ||||
| 2026-04-16 | 13F | Roble, Belko & Company, Inc | 60 | 0,00 | 0 | |||||
| 2026-02-17 | 13F | Quantinno Capital Management LP | 23.440 | 144 | ||||||
| 2026-02-18 | 13F | State of Tennessee, Treasury Department | 0 | -100,00 | 0 | |||||
| 2026-01-30 | 13F | Bogart Wealth, LLC | 1 | 0,00 | 0 | |||||
| 2026-02-12 | 13F | Dimensional Fund Advisors Lp | 7.572.396 | 3,64 | 46.572 | 18,70 | ||||
| 2026-02-06 | 13F | EverSource Wealth Advisors, LLC | 2.232 | 321,93 | 14 | 550,00 | ||||
| 2026-04-22 | 13F | Pictet Asset Management Holding SA | 155.868 | 16,55 | 952 | 15,55 | ||||
| 2026-02-17 | 13F | Starboard Value LP | 63.489.420 | 0,00 | 390.460 | 14,52 | ||||
| 2026-02-17 | 13F | Zimmer Partners, LP | 0 | -100,00 | 0 | |||||
| 2026-04-20 | 13F | CWA Asset Management Group, LLC | 619.470 | 24,25 | 3.804 | 24,04 | ||||
| 2025-11-14 | 13F | Axa S.a. | 0 | -100,00 | 0 | |||||
| 2026-02-12 | 13F | Advisors Asset Management, Inc. | 103.387 | -27,32 | 636 | -16,78 | ||||
| 2026-02-05 | 13F | GABELLI & Co INVESTMENT ADVISERS, INC. | 62.000 | 0,00 | 381 | 14,76 | ||||
| 2026-02-11 | 13F | Parallel Advisors, LLC | 1.402 | 0,00 | 9 | 14,29 | ||||
| 2026-02-13 | 13F | Quarry LP | 0 | -100,00 | 0 | |||||
| 2026-02-02 | 13F | Principal Financial Group Inc | 12.069.980 | 74.263 | ||||||
| 2026-04-17 | 13F | A. D. Beadell Investment Counsel, Inc. | 12.500 | 0,00 | 0 | |||||
| 2026-02-05 | 13F | Stephens Inc /ar/ | 13.505 | 0,00 | 83 | 15,28 | ||||
| 2026-02-10 | 13F | Natixis Advisors, L.p. | 0 | -100,00 | 0 | |||||
| 2025-11-14 | 13F | Jane Street Group, Llc | Call | 0 | -100,00 | 0 | -100,00 | |||
| 2026-02-11 | 13F | Private Management Group Inc | 6.432.155 | -1,11 | 39.558 | 13,26 | ||||
| 2026-02-13 | 13F | Smartleaf Asset Management LLC | 3.859 | 0,00 | 24 | 20,00 | ||||
| 2026-02-17 | 13F | Millennium Management Llc | 1.145.029 | 661,78 | 7.043 | 772,74 | ||||
| 2026-02-17 | 13F | Corvex Management LP | 6.183.855 | 0,00 | 38.031 | 14,52 |