Grundlæggende statistik
| Institutionelle ejere | 253 total, 252 long only, 1 short only, 0 long/short - change of -0,39% MRQ |
| Gennemsnitlig porteføljeallokering | 0.3479 % - change of 3,80% MRQ |
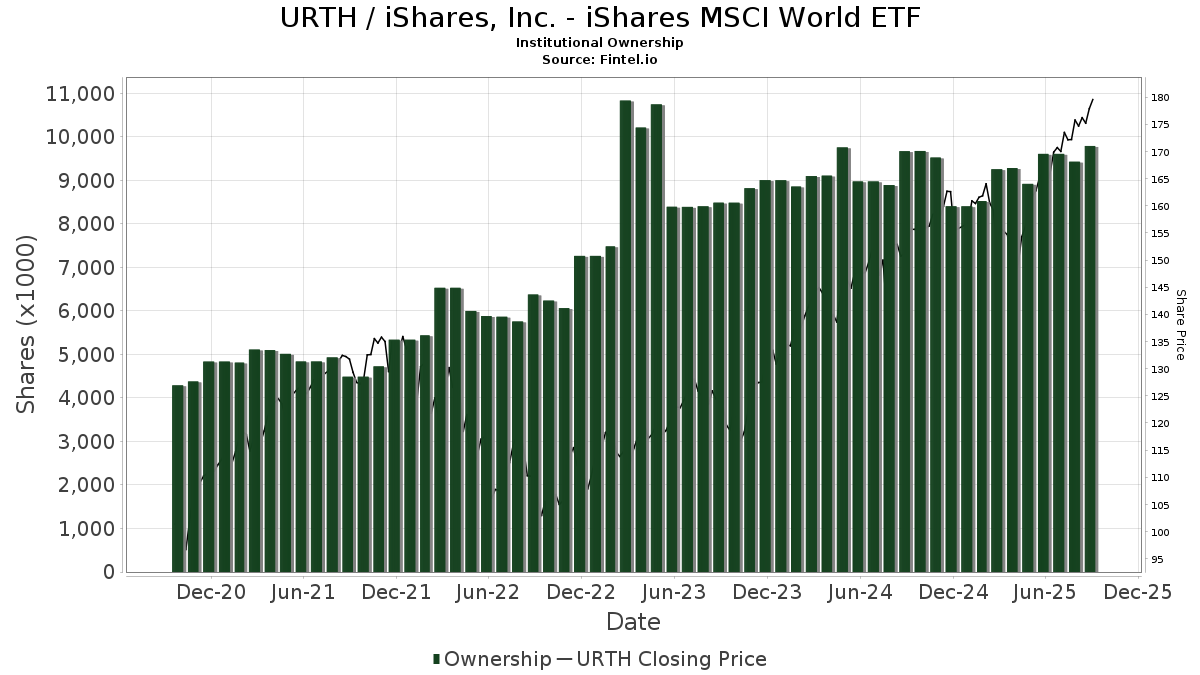
| Institutionelle aktier (lange) | 12.879.905 (ex 13D/G) - change of -0,02MM shares -0,18% MRQ |
| Institutionel værdi (lang) | $ 2.321.849 USD ($1000) |
Institutionelt ejerskab og aktionærer
iShares, Inc. - iShares MSCI World ETF (US:URTH) har 253 institutionelle ejere og aktionærer, der har indsendt 13D/G- eller 13F-formularer til Securities Exchange Commission (SEC). Disse institutioner har i alt 12,879,905 aktier. Største aktionærer omfatter Royal Bank Of Canada, Federation des caisses Desjardins du Quebec, Morgan Stanley, Bank Of America Corp /de/, Goldman Sachs Group Inc, Prudential Plc, Sumitomo Mitsui DS Asset Management Company, Ltd, Ci Investments Inc., Obermeyer Wood Investment Counsel, Lllp, and Envestnet Asset Management Inc .
iShares, Inc. - iShares MSCI World ETF (ARCA:URTH) institutionel ejerskabsstruktur viser aktuelle positioner i virksomheden efter institutioner og fonde, samt seneste ændringer i positionsstørrelse. Større aktionærer kan omfatte individuelle investorer, investeringsforeninger, hedgefonde eller institutioner. Skema 13D angiver, at investoren besidder (eller besidder) mere end 5 % af virksomheden og har til hensigt (eller har til hensigt at) aktivt at forfølge en ændring i forretningsstrategi. Skema 13G indikerer en passiv investering på over 5%.
The share price as of May 1, 2026 is 196,76 / share. Previously, on May 2, 2025, the share price was 157,21 / share. This represents an increase of 25,16% over that period.
Fondens stemningsscore
Fund Sentiment Score (fka Ownership Accumulation Score) finder de aktier, der bliver mest købt af fonde. Det er resultatet af en sofistikeret, multi-faktor kvantitativ model, der identificerer virksomheder med de højeste niveauer af institutionel akkumulering. Scoringsmodellen bruger en kombination af den samlede stigning i oplyste ejere, ændringerne i porteføljeallokeringer i disse ejere og andre målinger. Tallet går fra 0 til 100, hvor højere tal indikerer et højere niveau af akkumulering for sine jævnaldrende, og 50 er gennemsnittet.
Opdateringsfrekvens: Dagligt
Se Ownership Explorer, som giver en liste over højest rangerende virksomheder.
AI+ Ask Fintel’s AI assistant about iShares, Inc. - iShares MSCI World ETF.
Select a question to share a public post with an AI-crafted answer.
Thinking of good questions…
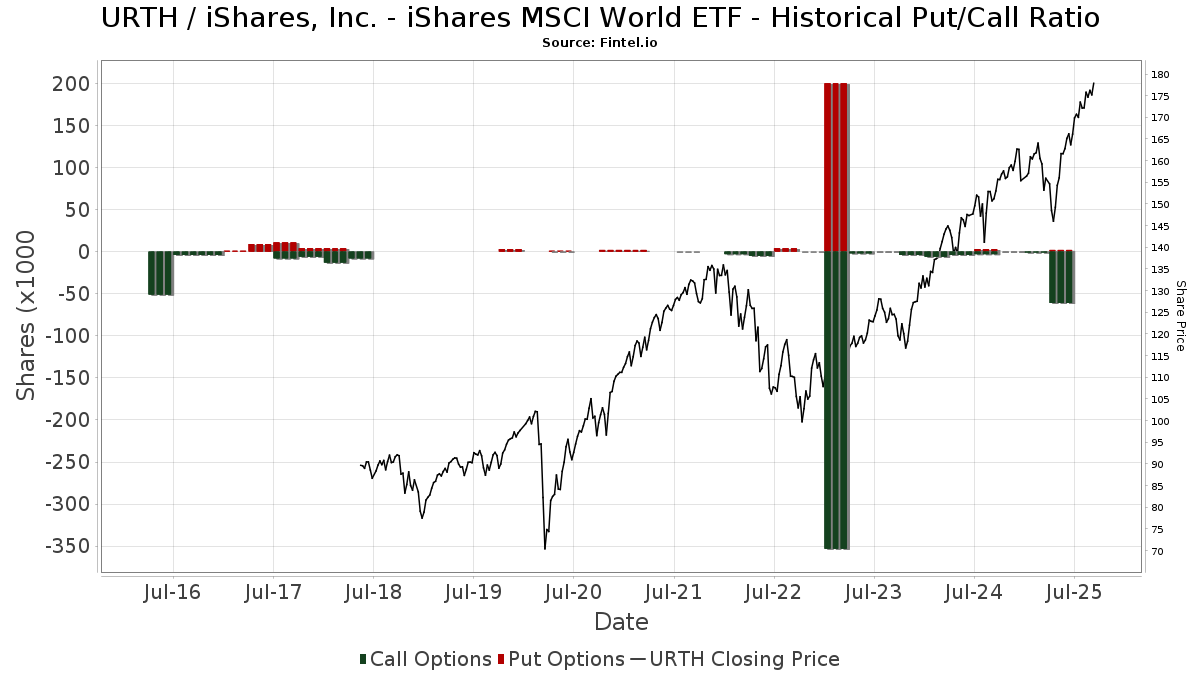
Institutionel Put/Call-forhold
Ud over at indberette standardaktie- og gældsudstedelser skal institutter med mere end 100 mill. aktiver under forvaltning også oplyse deres put- og call-optionsbeholdninger. Da salgsoptioner generelt indikerer negativ stemning, og købsoptioner indikerer positiv stemning, kan vi få en fornemmelse af den overordnede institutionelle stemning ved at plotte forholdet mellem put og kald. Diagrammet til højre viser det historiske put/call-forhold for dette instrument.
Brug af Put/Call Ratio som en indikator for investorernes stemning overvinder en af de vigtigste mangler ved at bruge totalt institutionelt ejerskab, som er, at en betydelig mængde af aktiver under forvaltning investeres passivt for at spore indekser. Passivt forvaltede fonde køber typisk ikke optioner, så indikatoren for put/call-forholdet følger mere nøje følelsen af aktivt forvaltede fonde.
13F og NPORT arkivering
Detaljer om 13F-arkivering er gratis. Detaljer om NP-ansøgninger kræver et premium-medlemskab. Grønne rækker angiver nye positioner. Røde rækker angiver lukkede positioner. Klik på linket ikon for at se den fulde transaktionshistorik.
Opgrader
for at låse premium-data op og eksportere til Excel ![]() .
.
| Fil dato | Kilde | Investor | Type | Gennemsnitlig pris (Øst) |
Aktier | Δ Aktier (%) |
Rapporteret Værdi ($1000) |
Δ Værdi (%) |
Port Alloc (%) |
|
|---|---|---|---|---|---|---|---|---|---|---|
| 2026-04-29 | 13F | Strategic Blueprint, LLC | 4.080 | 0,00 | 734 | -3,04 | ||||
| 2026-02-14 | 13F | Rockefeller Capital Management L.P. | 3.889 | 55.457,14 | 726 | 72.400,00 | ||||
| 2026-02-17 | 13F | Brevan Howard Capital Management LP | 1.816 | 19,24 | 338 | 22,91 | ||||
| 2026-01-28 | 13F | Migdal Insurance & Financial Holdings Ltd. | 0 | -100,00 | 0 | |||||
| 2026-02-12 | 13F | CIBC Private Wealth Group, LLC | 50 | 0,00 | 9 | 0,00 | ||||
| 2026-02-13 | 13F | Gen-Wealth Partners Inc | 617 | 0,00 | 115 | 1,79 | ||||
| 2026-04-15 | 13F | Arlington Financial Advisors, LLC | 2.975 | 0,00 | 536 | -3,08 | ||||
| 2026-04-16 | 13F | Asset Advisory Group, Inc. | 13.380 | 4,48 | 2.409 | 1,22 | ||||
| 2026-04-30 | 13F | Kestra Advisory Services, LLC | 1.234 | -33,41 | 222 | -35,47 | ||||
| 2026-04-16 | 13F | Evolve Private Wealth, Llc | 1.867 | -22,91 | 336 | -25,17 | ||||
| 2026-01-29 | 13F | UBS Group AG | 180.736 | 14,06 | 33.575 | 16,71 | ||||
| 2026-02-04 | 13F | Empire Life Investments Inc. | 82.743 | 6,83 | 15.371 | 9,32 | ||||
| 2026-02-13 | 13F | Citigroup Inc | 1.082 | 37,14 | 201 | 40,56 | ||||
| 2025-11-14 | 13F | Qtron Investments LLC | 0 | -100,00 | 0 | |||||
| 2026-02-17 | 13F | Mercer Global Advisors Inc /adv | 2.410 | -1,55 | 448 | 0,68 | ||||
| 2026-02-17 | 13F | Ameriprise Financial Inc | 27.404 | 472,11 | 5.091 | 485,73 | ||||
| 2026-04-20 | 13F | Obermeyer Wood Investment Counsel, Lllp | 349.999 | -0,86 | 63.007 | -3,93 | ||||
| 2026-04-28 | 13F | Robertson Stephens Wealth Management, LLC | 3.299 | 0,03 | 594 | -3,10 | ||||
| 2026-02-20 | 13F | Waterford Advisors, LLC | 0 | -100,00 | 0 | |||||
| 2026-04-22 | 13F | Advocate Investing Services LLC | 1.960 | 0,00 | 353 | -3,30 | ||||
| 2026-05-01 | 13F | Emerald Investment Partners, Llc | 600 | 0,00 | 108 | -2,70 | ||||
| 2026-04-24 | 13F | Keystone Global Partners, LLC | 50.422 | 53,36 | 9.077 | 48,62 | ||||
| 2026-02-13 | 13F | Allie Family Office LLC | 2.478 | 0,00 | 460 | 2,45 | ||||
| 2026-04-30 | 13F | Nisa Investment Advisors, Llc | 1.500 | 0,00 | 270 | -2,88 | ||||
| 2026-01-21 | 13F | Y.D. More Investments Ltd | 215 | 0,00 | 40 | 0,00 | ||||
| 2026-02-02 | 13F | JDM Financial Group LLC | 1.457 | 0,00 | 271 | 2,27 | ||||
| 2026-02-06 | 13F | EverSource Wealth Advisors, LLC | 6 | 0,00 | 1 | 0,00 | ||||
| 2026-02-13 | 13F | AlTi Global, Inc. | 6.131 | 0,97 | 1.139 | 3,27 | ||||
| 2026-04-30 | 13F | Personal Cfo Solutions, Llc | 0 | -100,00 | 0 | |||||
| 2026-02-02 | 13F | Principal Financial Group Inc | 160.195 | -16,22 | 29.759 | -14,27 | ||||
| 2026-01-30 | 13F | Pekin Hardy Strauss, Inc. | 8.800 | 0,00 | 1.635 | 2,32 | ||||
| 2026-02-06 | 13F | HighTower Advisors, LLC | 3.263 | 14,21 | 606 | 16,99 | ||||
| 2026-04-27 | 13F | Qrg Capital Management, Inc. | 0 | -100,00 | 0 | |||||
| 2026-02-10 | 13F | Lido Advisors, LLC | 73.421 | -1,07 | 13.502 | 0,19 | ||||
| 2026-04-14 | 13F | Nbc Securities, Inc. | 0 | -100,00 | 0 | |||||
| 2026-02-10 | 13F | Avestar Capital, LLC | 17.137 | 0,00 | 3.184 | 2,31 | ||||
| 2026-02-13 | 13F | Vontobel Holding Ltd. | 11.225 | -11,40 | 2.085 | -9,35 | ||||
| 2026-02-12 | 13F | BlackRock, Inc. | 219.917 | 8,67 | 40.854 | 11,19 | ||||
| 2026-02-17 | 13F | Fwl Investment Management, Llc | 20 | 0,00 | 4 | 0,00 | ||||
| 2026-02-13 | 13F | Resources Investment Advisors, LLC. | 6.363 | 13,52 | 1.182 | 16,22 | ||||
| 2025-11-03 | 13F | Impact Partnership Wealth, LLC | 0 | -100,00 | 0 | -100,00 | ||||
| 2026-01-26 | 13F | AE Wealth Management LLC | 1 | 0,00 | 0 | |||||
| 2026-02-10 | 13F/A | Northwestern Mutual Wealth Management Co | 54.962 | 29,33 | 10.210 | 32,32 | ||||
| 2026-02-13 | 13F | Causeway Capital Management Llc | 10.631 | 72,83 | 1.975 | 76,88 | ||||
| 2026-04-02 | 13F | Fulcrum Equity Management | 46.192 | 0,00 | 8.315 | -3,10 | ||||
| 2026-02-12 | 13F | Principal Securities, Inc. | 1.353 | 20,05 | 251 | 23,04 | ||||
| 2026-02-11 | 13F | Fiduciary Management Inc /wi/ | 0 | -100,00 | 0 | -100,00 | ||||
| 2026-02-13 | 13F | Aptus Capital Advisors, LLC | 147 | 0,00 | 27 | 3,85 | ||||
| 2026-04-28 | 13F | Sheridan Capital Management, LLC | 13.416 | -1,46 | 2.415 | -4,51 | ||||
| 2026-05-01 | 13F | Fifth Third Bancorp | 318 | 57 | ||||||
| 2026-02-13 | 13F | Smartleaf Asset Management LLC | 1.967 | -13,08 | 368 | -10,27 | ||||
| 2026-02-13 | 13F | Morgan Stanley | 698.705 | -12,90 | 129.799 | -10,88 | ||||
| 2026-02-13 | 13F | Wells Fargo & Company/mn | 64.286 | 110,91 | 11.942 | 115,83 | ||||
| 2026-04-13 | 13F | Compass Ion Advisors, LLC | 1.148 | 0,00 | 207 | -3,29 | ||||
| 2026-04-07 | 13F | Signaturefd, Llc | 74 | 0,00 | 13 | 0,00 | ||||
| 2026-04-27 | 13F | Truist Financial Corp | 2.685 | -23,79 | 483 | -26,15 | ||||
| 2026-02-13 | 13F | LM Advisors LLC | 218 | -81,38 | 1 | |||||
| 2026-02-11 | 13F | Jpmorgan Chase & Co | 261.228 | 14,41 | 48.529 | 17,06 | ||||
| 2026-02-17 | 13F | GAM Holding AG | 137.304 | 0,18 | 25.478 | 2,38 | ||||
| 2026-01-29 | 13F | Sanctuary Advisors, LLC | 9.295 | 3,28 | 1.727 | 5,63 | ||||
| 2026-02-13 | 13F | Evelyn Partners Asset Management Ltd | 28.764 | 0,00 | 5.343 | 2,32 | ||||
| 2026-02-17 | 13F | Schusterman Interests, LLC | 5.375 | 999 | ||||||
| 2026-04-27 | 13F | Tsfg, Llc | 403 | 0,00 | 0 | |||||
| 2026-01-26 | 13F | Mirae Asset Global Investments Co., Ltd. | 219.613 | 30,10 | 40.798 | 33,12 | ||||
| 2025-11-13 | 13F | Glenmede Investment Management, LP | 3.927 | 0,00 | 713 | 7,07 | ||||
| 2026-02-10 | 13F | Bbr Partners, Llc | 22.440 | 0,00 | 4.169 | 2,33 | ||||
| 2026-04-14 | 13F | Pictet North America Advisors SA | 160.097 | 634,36 | 28.821 | 611,78 | ||||
| 2026-02-10 | 13F | Close Asset Management Ltd | 300 | 0,00 | 0 | |||||
| 2026-04-08 | 13F | Holos Integrated Wealth LLC | 1.106 | -13,73 | 202 | -15,90 | ||||
| 2026-01-28 | 13F | Fischer Investment Strategies, Llc | 24.006 | -14,06 | 4.460 | -12,07 | ||||
| 2026-04-06 | 13F | Washington Trust Advisors, Inc. | 394 | 0,00 | 71 | -4,11 | ||||
| 2026-04-30 | 13F | Private Trust Co Na | 238 | 0,00 | 43 | -4,55 | ||||
| 2026-04-24 | 13F | Keybank National Association/oh | 3.050 | 0,00 | 549 | -3,00 | ||||
| 2026-02-17 | 13F | Cetera Investment Advisers | 87.796 | 15,34 | 16.310 | 18,02 | ||||
| 2025-11-14 | 13F | PineBridge Investments, L.P. | 114.750 | 94,15 | 20.834 | 108,13 | ||||
| 2026-02-17 | 13F | Two Sigma Securities, Llc | 0 | -100,00 | 0 | |||||
| 2025-11-03 | 13F | J. Safra Sarasin Holding AG | 0 | -100,00 | 0 | -100,00 | ||||
| 2026-02-12 | 13F | Commonwealth Equity Services, Llc | 25.676 | -1,44 | 4.770 | 119.125,00 | ||||
| 2026-02-04 | 13F | Valeo Financial Advisors, LLC | 4.068 | -0,73 | 756 | 1,48 | ||||
| 2026-02-12 | 13F | StoneX Group Inc. | 2.982 | 27,06 | 554 | 29,81 | ||||
| 2026-02-13 | 13F | Centaurus Financial, Inc. | 614 | -3,15 | 0 | |||||
| 2026-02-17 | 13F | EFG International AG | 8.171 | 1.518 | ||||||
| 2026-02-13 | 13F | Squarepoint Ops LLC | 0 | -100,00 | 0 | |||||
| 2026-02-17 | 13F | Rakuten Investment Management, Inc. | 0 | -100,00 | 0 | |||||
| 2026-04-15 | 13F | Compagnie Lombard Odier SCmA | 53.856 | -6,17 | 9.695 | -9,07 | ||||
| 2026-04-22 | 13F | Joel Isaacson & Co., LLC | 3.561 | -12,93 | 641 | -15,55 | ||||
| 2026-02-17 | 13F | Main Street Financial Solutions, LLC | 3.029 | 0,00 | 563 | 2,37 | ||||
| 2026-02-13 | 13F | Mml Investors Services, Llc | 49.330 | 1.150,13 | 9.164 | 1.179,89 | ||||
| 2026-02-12 | 13F | Steward Partners Investment Advisory, Llc | 75 | 0,00 | 14 | 0,00 | ||||
| 2026-04-23 | 13F | Ameliora Wealth Management Ltd. | 136 | -32,00 | 24 | -35,14 | ||||
| 2026-02-13 | 13F | Ausdal Financial Partners, Inc. | 2.663 | -1,88 | 495 | 0,41 | ||||
| 2026-01-29 | 13F | Comerica Bank | 1.576 | 460,85 | 293 | 472,55 | ||||
| 2026-02-11 | 13F | Prudential Plc | 465.500 | -10,07 | 86.476 | -7,98 | ||||
| 2026-01-27 | 13F | TD Waterhouse Canada Inc. | 28.841 | 0,83 | 5.355 | 2,70 | ||||
| 2026-04-22 | 13F | Stone House Investment Management, LLC | 39 | 0,00 | 7 | 0,00 | ||||
| 2026-01-27 | 13F | Lorne Steinberg Wealth Management Inc. | 6.911 | 25,79 | 1.284 | 28,69 | ||||
| 2026-02-06 | 13F | Larson Financial Group LLC | 25 | 5 | ||||||
| 2026-02-13 | 13F | Brown Advisory Inc | 85.761 | -12,62 | 15.932 | -10,59 | ||||
| 2026-01-06 | 13F | RDA Financial Network | 0 | -100,00 | 0 | |||||
| 2026-01-27 | 13F | Seeds Investor Llc | 5.480 | -1,62 | 1.018 | 0,69 | ||||
| 2026-02-10 | 13F | JTC Employer Solutions Trusteee Ltd | 878 | 0,00 | 0 | |||||
| 2026-02-17 | 13F | Citadel Advisors Llc | 10.751 | -12,22 | 1.997 | -10,17 | ||||
| 2026-04-03 | 13F | Investors Research Corp | 121 | -51,79 | 22 | -54,35 | ||||
| 2026-01-14 | 13F | BFI Infinity Ltd. | Put | 0 | -100,00 | 0 | -100,00 | |||
| 2026-02-10 | 13F | Goldman Sachs Group Inc | 542.545 | -4,89 | 100.789 | -2,69 | ||||
| 2026-04-28 | 13F | Fundamentun, Llc | 5.273 | 7,63 | 949 | 4,29 | ||||
| 2026-02-17 | 13F | Susquehanna International Group, Llp | Call | 4.600 | -40,26 | 855 | -38,91 | |||
| 2026-01-29 | 13F | LFA - Lugano Financial Advisors SA | 599 | 0,00 | 111 | 2,78 | ||||
| 2026-02-17 | 13F | Susquehanna International Group, Llp | 1.507 | -76,73 | 280 | -76,26 | ||||
| 2026-02-17 | 13F | Blair William & Co/il | 7.014 | 5,25 | 1.303 | 7,69 | ||||
| 2026-04-28 | 13F | Arbor Investment Advisors, LLC | 2.476 | 0,00 | 446 | -3,05 | ||||
| 2026-02-13 | 13F | Schroder Investment Management Group | 49.005 | -50,60 | 9.164 | -48,94 | ||||
| 2026-02-17 | 13F | Fmr Llc | 7.034 | 6,92 | 1.307 | 9,38 | ||||
| 2026-02-17 | 13F | Lazard Asset Management Llc | 0 | -100,00 | 0 | |||||
| 2026-03-25 | 13F/A | Barclays Plc | 0 | -100,00 | 0 | |||||
| 2026-02-17 | 13F | Captrust Financial Advisors | 2.757 | 0,00 | 512 | 2,40 | ||||
| 2026-04-10 | 13F | Perigon Wealth Management, LLC | 2.563 | 0,00 | 461 | -3,15 | ||||
| 2026-04-16 | 13F | SG Americas Securities, LLC | 2.624 | 0,00 | 0 | |||||
| 2025-11-12 | 13F | Xponance, Inc. | 0 | -100,00 | 0 | -100,00 | ||||
| 2026-02-10 | 13F | BlackDiamond Wealth Management Inc. | 1.847 | 45,55 | 354 | 53,91 | ||||
| 2026-02-13 | 13F | SYM FINANCIAL Corp | 1.810 | 17,08 | 336 | 20,00 | ||||
| 2026-04-08 | 13F | First Heartland Consultants, Inc. | 0 | -100,00 | 0 | |||||
| 2026-02-12 | 13F | Bank Of Montreal /can/ | 276.231 | 5,02 | 51.315 | 7,45 | ||||
| 2026-04-08 | 13F | Wealth Enhancement Advisory Services, Llc | 0 | -100,00 | 0 | |||||
| 2026-02-12 | 13F | Litman Gregory Asset Management LLC | 7.947 | -14,99 | 1.476 | -13,02 | ||||
| 2026-02-17 | 13F | Inherent Management Corp. | 60.650 | 0,00 | 11.267 | 2,32 | ||||
| 2026-02-11 | 13F | Simplex Trading, Llc | 740 | 103,30 | 137 | |||||
| 2026-02-13 | 13F | Ubs Asset Management Americas Inc | 3.207 | 596 | ||||||
| 2026-04-29 | 13F | LTS Liquid Investments LLC | 125.840 | -0,57 | 22.654 | -3,65 | ||||
| 2026-01-23 | 13F | Rsm Us Wealth Management Llc | 1.370 | -41,25 | 256 | -39,48 | ||||
| 2026-02-18 | 13F | Sierra Capital LLC | 10.801 | -0,12 | 2 | 100,00 | ||||
| 2026-03-04 | 13F | Rehmann Capital Advisory Group | 2.328 | -0,94 | 432 | 1,41 | ||||
| 2026-02-12 | 13F | Federation des caisses Desjardins du Quebec | 1.077.054 | -25,07 | 200.084 | -23,33 | ||||
| 2026-01-27 | 13F | Silphium Asset Management Ltd | 0 | -100,00 | 0 | |||||
| 2026-01-16 | 13F | Trust Co Of Vermont | 20 | 4 | ||||||
| 2026-02-05 | 13F | AlphaCore Capital LLC | 1.075 | 217,11 | 200 | 226,23 | ||||
| 2026-02-17 | 13F | Warren Averett Asset Management, LLC | 3.822 | -0,70 | 710 | 1,72 | ||||
| 2026-04-28 | 13F | Whittier Trust Co | 1.712 | 0,00 | 312 | -3,41 | ||||
| 2026-04-24 | 13F | Sumitomo Mitsui DS Asset Management Company, Ltd | 407.987 | -16,95 | 73.446 | -19,52 | ||||
| 2026-04-13 | 13F | BFI Infinity Ltd. | 1.791 | -12,89 | 322 | -15,49 | ||||
| 2026-04-30 | 13F | Sequoia Financial Advisors, LLC | 20.662 | -5,73 | 3.720 | -8,65 | ||||
| 2026-05-01 | 13F | Sovran Advisors, LLC | 1.430 | 23,28 | 281 | 28,31 | ||||
| 2026-02-05 | 13F | Dash Acquisitions Inc. | 1.202 | -91,11 | 227 | -90,99 | ||||
| 2026-02-13 | 13F | Glen Eagle Advisors, LLC | 200 | 0,00 | 37 | 2,78 | ||||
| 2025-11-13 | 13F | Parallel Advisors, LLC | 0 | -100,00 | 0 | |||||
| 2026-02-11 | 13F | Buckingham Strategic Partners | 1.650 | 307 | ||||||
| 2026-02-17 | 13F | Russell Investments Group, Ltd. | 1.208 | -34,77 | 224 | -33,33 | ||||
| 2026-02-10 | 13F | Bank of New York Mellon Corp | 8.900 | 290,35 | 1.653 | 300,24 | ||||
| 2025-11-14 | 13F | Wolverine Trading, Llc | 1.988 | 360 | ||||||
| 2025-11-14 | 13F | Wolverine Trading, Llc | Call | 3.600 | 651 | |||||
| 2026-01-23 | 13F | LOM Asset Management Ltd | 5.240 | -3,41 | 973 | -1,22 | ||||
| 2026-01-20 | 13F | Aspiriant, Llc | 1.297 | 241 | ||||||
| 2026-01-23 | 13F | Westside Investment Management, Inc. | 60 | 0,00 | 11 | 10,00 | ||||
| 2026-02-06 | 13F | Pnc Financial Services Group, Inc. | 18.935 | 0,00 | 3.518 | 2,33 | ||||
| 2026-02-04 | 13F | Nwam Llc | 0 | -100,00 | 0 | -100,00 | ||||
| 2026-02-03 | 13F | Retirement Planning Group | 7.236 | 0,00 | 1.344 | 2,36 | ||||
| 2026-02-12 | 13F | Financial Engines Advisors L.L.C. | 1.080 | -13,60 | 201 | -11,50 | ||||
| 2026-02-12 | 13F | Summit Financial, LLC | 1.463 | 0,41 | 272 | 2,65 | ||||
| 2026-02-13 | 13F | Banco Santander, S.A. | 305.829 | 29,36 | 56.814 | 32,35 | ||||
| 2026-04-27 | 13F | Td Private Client Wealth Llc | 12.647 | -44,80 | 2.277 | -46,52 | ||||
| 2026-02-10 | 13F | Envestnet Asset Management Inc | 318.350 | 166,55 | 59.140 | 172,73 | ||||
| 2026-04-16 | 13F | Roble, Belko & Company, Inc | 14 | 0,00 | 0 | |||||
| 2026-02-12 | 13F | Jane Street Group, Llc | 0 | -100,00 | 0 | |||||
| 2026-02-12 | 13F | Groupe la Francaise | 0 | -100,00 | 0 | |||||
| 2026-02-17 | 13F | Advisor Group Holdings, Inc. | 16.548 | 5,72 | 3.075 | 9,67 | ||||
| 2026-02-09 | 13F | Tiff Advisory Services Inc | 202 | 37 | ||||||
| 2026-02-17 | 13F | Snowden Capital Advisors LLC | 4.011 | 8,41 | 745 | 11,03 | ||||
| 2026-04-15 | 13F | Exchange Traded Concepts, Llc | 0 | -100,00 | 0 | |||||
| 2026-04-28 | 13F | LWM Advisory Services, LLC | 0 | -100,00 | 0 | |||||
| 2026-01-15 | 13F | Jaffetilchin Investment Partners, LLC | 2.647 | 0,80 | 492 | 3,15 | ||||
| 2026-02-06 | 13F | Global Retirement Partners, LLC | 0 | -100,00 | 0 | |||||
| 2026-02-17 | 13F | Angeles Wealth Management, Llc | 122.386 | 2,82 | 22.736 | 5,20 | ||||
| 2026-02-06 | 13F | KDT Advisors, LLC | 3.100 | 0,00 | 576 | 2,31 | ||||
| 2026-02-03 | 13F | Cassaday & Co Wealth Management LLC | 1.904 | 12,13 | 354 | 14,61 | ||||
| 2026-02-18 | 13F | EP Wealth Advisors, Inc. | 1.656 | 82,98 | 308 | 100,65 | ||||
| 2026-02-13 | 13F | 1832 Asset Management L.P. | 13.390 | 622,22 | 2.487 | 640,18 | ||||
| 2026-02-13 | 13F | Evelyn Partners Investment Management (Europe) Ltd | 104.148 | 1,37 | 19.348 | 3,72 | ||||
| 2026-04-10 | 13F | Magnus Financial Group LLC | 0 | -100,00 | 0 | |||||
| 2026-02-17 | 13F | BTG Pactual Asset Management US LLC | 3.567 | 142,65 | 546 | 142,67 | ||||
| 2026-04-14 | 13F | Retirement Management Systems Inc. | 1.117 | -97,86 | 201 | -97,94 | ||||
| 2026-02-11 | 13F | J.w. Cole Advisors, Inc. | 0 | -100,00 | 0 | |||||
| 2026-04-27 | 13F | Wbh Advisory Inc | 18.058 | -0,64 | 3.283 | -2,75 | ||||
| 2026-02-13 | 13F | Evelyn Partners Investment Management LLP | 10.074 | 18,52 | 1.871 | 21,26 | ||||
| 2025-11-12 | 13F | Creekmur Asset Management LLC | 103 | 0,00 | 19 | 5,88 | ||||
| 2026-01-29 | 13F | Dunhill Financial, LLC | 400 | 0,00 | 74 | 2,78 | ||||
| 2026-02-18 | 13F | GWM Advisors LLC | 27.853 | 5,80 | 5.174 | 8,27 | ||||
| 2026-04-15 | 13F | Activest Wealth Management | 447 | 0,00 | 80 | -2,44 | ||||
| 2026-05-01 | 13F | Wealthspire Advisors, LLC | 3.961 | 1,10 | 713 | -1,93 | ||||
| 2026-02-11 | 13F | Wealthgarden F.s. Llc | 1.674 | -1,59 | 318 | 1,93 | ||||
| 2026-02-17 | 13F | Edmond De Rothschild Holding S.a. | 6.164 | 4,92 | 1.145 | 7,41 | ||||
| 2026-02-23 | 13F | Investments & Financial Planning, LLC | 54.335 | -1,10 | 10.094 | 1,19 | ||||
| 2025-11-13 | 13F | GeoWealth Management, LLC | 0 | -100,00 | 0 | |||||
| 2026-02-05 | 13F | Allworth Financial LP | 2.037 | 0,54 | 378 | 3,00 | ||||
| 2026-02-17 | 13F | Wiley Bros.-aintree Capital, Llc | 1.905 | 354 | ||||||
| 2026-04-07 | 13F | Farther Finance Advisors, LLC | 2.226 | 420,09 | 405 | 411,39 | ||||
| 2026-01-07 | 13F | Sagespring Wealth Partners, Llc | 3.428 | 2,57 | 637 | 4,95 | ||||
| 2026-02-13 | 13F | Prudential Financial Inc | 57.150 | 8,14 | 10.617 | 10,64 | ||||
| 2026-02-05 | 13F | Atria Investments Llc | 1.780 | -21,59 | 331 | -19,90 | ||||
| 2026-02-17 | 13F | Creative Planning | 0 | -100,00 | 0 | |||||
| 2026-04-30 | 13F | Main Street Research LLC | 14.742 | -2,62 | 2.654 | -5,65 | ||||
| 2026-02-17 | 13F | Montaka Global Pty Ltd | 1.628 | 302 | ||||||
| 2026-04-30 | 13F | Dara Capital Us, Inc. | 10.400 | 0,00 | 1.872 | -3,11 | ||||
| 2026-02-06 | 13F | Auxano Advisors, LLC | 2.270 | 47,59 | 422 | 50,90 | ||||
| 2026-02-13 | 13F | Colony Group, LLC | 5.498 | 19,57 | 1.021 | 22,42 | ||||
| 2026-02-18 | 13F | Mackenzie Financial Corp | 39.540 | 12,43 | 7.380 | 15,57 | ||||
| 2026-02-12 | 13F | Gerber Kawasaki Wealth & Investment Management | 103.282 | 2,27 | 19.187 | 4,64 | ||||
| 2026-04-06 | 13F | CX Institutional | 4.299 | -0,35 | 1 | |||||
| 2026-01-28 | 13F | Chicago Partners Investment Group LLC | 2.828 | -6,70 | 534 | -5,49 | ||||
| 2026-04-16 | 13F | Arizona PSPRS Trust | 0 | -100,00 | 0 | -100,00 | ||||
| 2026-04-27 | 13F | Integrity Wealth Partners, LLC | 4.403 | 793 | ||||||
| 2026-02-13 | 13F | Gts Securities Llc | 2.290 | 97,58 | 425 | 102,38 | ||||
| 2026-02-17 | 13F | Amundi | 0 | -100,00 | 0 | |||||
| 2026-04-24 | 13F | National Asset Management, Inc. | 35.701 | 6.246 | ||||||
| 2026-04-16 | 13F | Arizona PSPRS Trust | Put | 111.964 | 20.156 | |||||
| 2026-02-17 | 13F | Advisory Services Network, LLC | 2.951 | -7,08 | 548 | -4,86 | ||||
| 2026-04-07 | 13F | Park Avenue Securities Llc | 6.057 | 40,57 | 1 | |||||
| 2026-04-17 | 13F | PKO Investment Management Joint-Stock Co | 24.800 | 0,00 | 4.464 | -3,10 | ||||
| 2026-02-09 | 13F | Bleakley Financial Group, LLC | 55.266 | -3,47 | 10.267 | -1,23 | ||||
| 2026-04-15 | 13F | Fifth Third Securities, Inc. | 16.613 | 7,03 | 2.991 | 3,71 | ||||
| 2026-02-17 | 13F | Bank Of America Corp /de/ | 566.989 | 57,69 | 105.330 | 61,34 | ||||
| 2026-02-05 | 13F | Bank Julius Baer & Co. Ltd, Zurich | 69.780 | -10,58 | 12.963 | -8,51 | ||||
| 2026-02-17 | 13F | London & Capital Asset Management Ltd | 2.540 | 472 | ||||||
| 2026-02-13 | 13F | National Bank Of Canada /fi/ | 5.622 | -81,13 | 1.044 | -80,71 | ||||
| 2026-02-13 | 13F | Victory Capital Management Inc | 9.664 | 0,00 | 1.795 | 2,34 | ||||
| 2025-11-14 | 13F | Strategic Wealth Partners, Ltd. | 1 | 0 | ||||||
| 2026-04-29 | 13F | Envestnet Portfolio Solutions, Inc. | 0 | -100,00 | 0 | |||||
| 2026-02-17 | 13F | Glenmede Trust Co Na | 3.927 | 0,00 | 730 | 21,30 | ||||
| 2026-02-13 | 13F | Pathstone Holdings, LLC | 0 | -100,00 | 0 | |||||
| 2026-02-12 | 13F | Barings Llc | 288.921 | -7,13 | 53.673 | -4,98 | ||||
| 2026-02-13 | 13F | Partners Capital Investment Group, Llp | 26.420 | -8,72 | 4.908 | -6,60 | ||||
| 2026-02-13 | 13F | C M Bidwell & Associates Ltd | 439 | 0,69 | 82 | 2,53 | ||||
| 2026-01-28 | 13F | Geneos Wealth Management Inc. | 1.014 | 0,20 | 188 | 2,73 | ||||
| 2026-01-27 | 13F | Retirement Income Solutions, Inc | 3.985 | 0,00 | 740 | 2,35 | ||||
| 2026-02-19 | 13F | Atomi Financial Group, Inc. | 5.464 | -22,90 | 1.015 | -21,07 | ||||
| 2026-01-30 | 13F | Us Bancorp \de\ | 2.223 | 84,33 | 413 | 88,99 | ||||
| 2026-04-13 | 13F | IFP Advisors, Inc | 21 | 90,91 | 4 | 50,00 | ||||
| 2026-04-29 | 13F | BEAM Asset Management, LLC | 21.030 | -6,65 | 3.786 | -9,54 | ||||
| 2026-02-13 | 13F | State Street Corp | 48.460 | 9.002 | ||||||
| 2026-02-12 | 13F | Great Valley Advisor Group, Inc. | 0 | -100,00 | 0 | |||||
| 2026-04-16 | 13F | Allegheny Financial Group LTD | 1.154 | 0,00 | 208 | -3,27 | ||||
| 2026-02-05 | 13F | Mission Wealth Management, Lp | 2.641 | 0,00 | 491 | 2,30 | ||||
| 2026-04-16 | 13F | BridgePort Financial Solutions, LLC | 2.166 | 0,00 | 390 | -3,23 | ||||
| 2026-02-17 | 13F | Susquehanna International Group, Llp | Put | 0 | -100,00 | 0 | ||||
| 2026-02-11 | 13F | Mount Capital Ltd | 23.725 | 4.407 | ||||||
| 2026-02-17 | 13F | Qube Research & Technologies Ltd | 26 | -7,14 | 5 | -20,00 | ||||
| 2026-02-10 | 13F | MidAtlantic Capital Management, Inc. | 1.902 | -70,48 | 353 | -69,80 | ||||
| 2026-04-29 | 13F | Horst & Graben Wealth Management LLC | 1.614 | 0,00 | 315 | 5,35 | ||||
| 2026-04-30 | 13F | Cambridge Investment Research Advisors, Inc. | 12.896 | -0,09 | 2 | 0,00 | ||||
| 2026-04-17 | 13F | Cidel Asset Management Inc | 6.563 | -11,41 | 1.181 | -14,17 | ||||
| 2026-04-22 | 13F | Evensky & Katz LLC | 287.975 | -0,13 | 52 | -3,77 | ||||
| 2026-02-11 | 13F | Cerity Partners LLC | 5.375 | 0,02 | 998 | 2,36 | ||||
| 2026-02-17 | 13F | Cresset Asset Management, LLC | 18.189 | 8,89 | 3.379 | 11,41 | ||||
| 2025-11-20 | 13F/A | BRYN MAWR TRUST Co | 0 | -100,00 | 0 | |||||
| 2026-01-30 | 13F | Archer Investment Corp | 170 | -64,88 | 31 | -64,37 | ||||
| 2026-02-13 | 13F | MAI Capital Management | 609 | 121,45 | 113 | 130,61 | ||||
| 2026-02-17 | 13F | Equitable Holdings, Inc. | 3.884 | -4,24 | 722 | -2,04 | ||||
| 2026-04-15 | 13F | Signature Estate & Investment Advisors Llc | 1.210 | -13,32 | 218 | -16,22 | ||||
| 2026-04-16 | 13F | Capital Investment Advisors, LLC | 8.927 | 0,00 | 1.607 | -3,08 | ||||
| 2026-02-09 | 13F | Hartland & Co., LLC | 262 | 0,00 | 49 | 2,13 | ||||
| 2026-04-07 | 13F | Comprehensive Financial Planning, Inc./PA | 106 | 0,00 | 19 | 0,00 | ||||
| 2025-11-12 | 13F | Taikang Asset Management (Hong Kong) Co Ltd | 0 | -100,00 | 0 | -100,00 | ||||
| 2026-02-11 | 13F | J.Safra Asset Management Corp | 1.274 | 0,00 | 237 | 2,16 | ||||
| 2026-04-15 | 13F | Financial Management Professionals, Inc. | 62 | 19,23 | 11 | 22,22 | ||||
| 2026-01-16 | 13F | Beaumont Financial Advisors, LLC | 2.070 | -1,90 | 385 | 0,26 | ||||
| 2026-02-17 | 13F | Tudor Investment Corp Et Al | 2.098 | 390 | ||||||
| 2026-02-17 | 13F | Roehl & Yi Investment Advisors, LLC | 5.703 | 1.059 | ||||||
| 2026-04-22 | 13F | Union Bancaire Privee, UBP SA | 6.502 | 5,43 | 1.009 | 0,20 | ||||
| 2026-01-30 | 13F/A | M&t Bank Corp | 8.382 | 0,00 | 1.557 | 2,37 | ||||
| 2026-02-17 | 13F | Moneda S.A. Administradora General de Fondos | 2.579 | 479 | ||||||
| 2026-02-10 | 13F | CIBC World Markets Inc. | 2.249 | 1,12 | 418 | 3,47 | ||||
| 2026-02-18 | 13F | Financial Advisory Service, Inc. | 1.068 | 0,75 | 198 | 3,13 | ||||
| 2026-04-14 | 13F | Banque Pictet & Cie Sa | 34.903 | 32,37 | 6.283 | 28,28 | ||||
| 2026-02-13 | 13F | ICONIQ Capital, LLC | 29.109 | 0,00 | 5.408 | 2,31 | ||||
| 2026-02-12 | 13F | Sava Penzisko Drushtvo A.d. Skopje | 202.500 | 0,00 | 37.618 | 2,32 | ||||
| 2025-11-17 | 13F | LGT Financial Advisors LLC | 0 | -100,00 | 0 | |||||
| 2025-11-14 | 13F | Hrt Financial Lp | 0 | -100,00 | 0 | |||||
| 2026-02-17 | 13F | Royal Bank Of Canada | 2.027.632 | 17,47 | 376.672 | 20,19 | ||||
| 2026-02-11 | 13F | LPL Financial LLC | 233.889 | 14,23 | 43.450 | 16,88 | ||||
| 2026-02-20 | 13F | Sunbelt Securities, Inc. | 173 | 0,00 | 32 | 3,23 | ||||
| 2026-04-30 | 13F | Hsbc Holdings Plc | 42.991 | 41,88 | 7.739 | 37,51 | ||||
| 2026-02-12 | 13F | Elevated Private Wealth, LLC | 1.358 | 252 | ||||||
| 2026-02-13 | 13F | Ieq Capital, Llc | 2.363 | -18,55 | 439 | -16,73 | ||||
| 2026-02-19 | 13F | CI Private Wealth, LLC | 1.304 | 0,00 | 242 | 2,54 | ||||
| 2026-02-12 | 13F | Renaissance Technologies Llc | 8.500 | 1.579 | ||||||
| 2026-04-20 | 13F | Kestra Private Wealth Services, Llc | 4.042 | 728 | ||||||
| 2026-02-17 | 13F | Raymond James Financial Inc | 143.682 | 14,08 | 26.692 | 16,73 | ||||
| 2026-02-17 | 13F | Jones Financial Companies Lllp | 7.648 | 51,18 | 1.421 | 55,70 | ||||
| 2026-02-12 | 13F | Marex Group plc | 5.451 | -65,31 | 1.013 | -64,52 | ||||
| 2026-02-17 | 13F | Banco Bilbao Vizcaya Argentaria, S.a. | 0 | -100,00 | 0 | |||||
| 2026-04-09 | 13F | Nelson, Van Denburg & Campbell Wealth Management Group, LLC | 5.311 | -1,67 | 956 | -4,69 | ||||
| 2026-02-12 | 13F/A | Pinebridge Investments Llc | 119.195 | 22.143 | ||||||
| 2026-02-12 | 13F | Ci Investments Inc. | 391.402 | 255,40 | 72.711 | 382.584,21 | ||||
| 2026-02-13 | 13F | Mariner, LLC | 6.693 | -18,97 | 1.243 | -17,08 | ||||
| 2026-02-10 | 13F | Bnp Paribas Arbitrage, Sa | 14.376 | 30,05 | 2.671 | 33,10 | ||||
| 2026-02-13 | 13F | First Trust Advisors Lp | 17.764 | 0,00 | 3.300 | 2,33 | ||||
| 2026-02-17 | 13F | Boothbay Fund Management, Llc | Call | 0 | -100,00 | 0 | ||||
| 2026-04-30 | 13F | Hyposwiss Advisors SA | 14.655 | -0,98 | 2.638 | -4,04 | ||||
| 2026-04-17 | 13F | Webster Bank, N. A. | 300 | 0,00 | 54 | -1,82 |