Grundlæggende statistik
| Institutionelle aktier (lange) | 7.057.071 - 13,17% (ex 13D/G) - change of -1,10MM shares -13,47% MRQ |
| Institutionel værdi (lang) | $ 26.930 USD ($1000) |
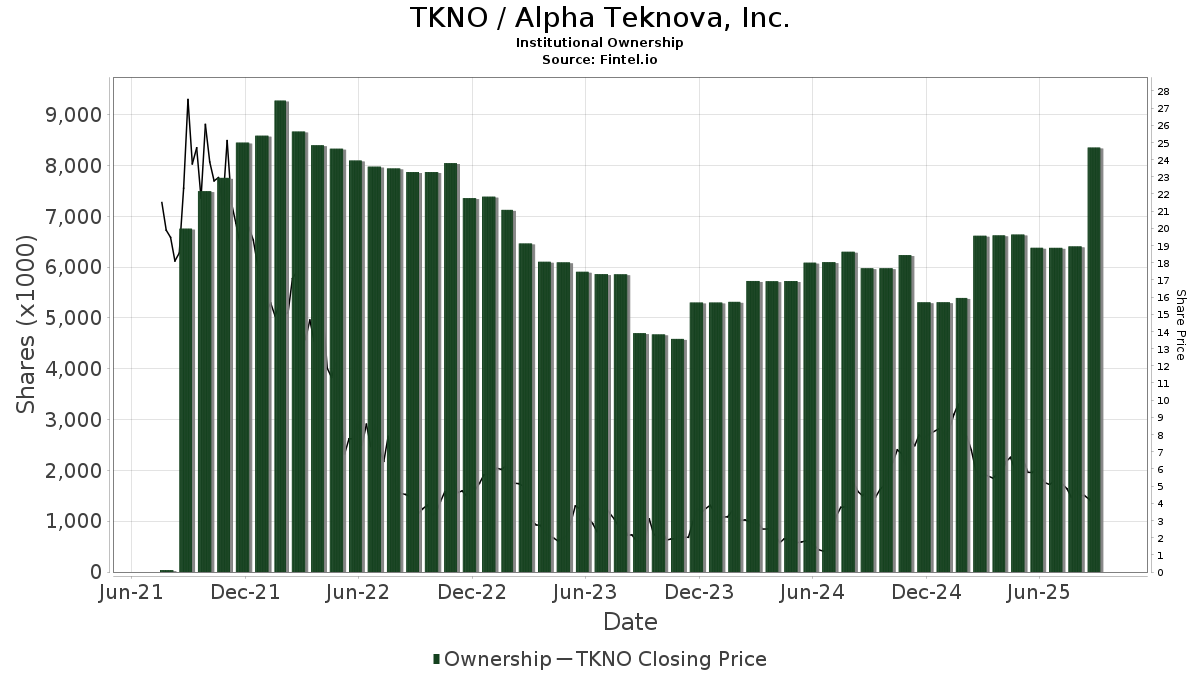
Institutionelt ejerskab og aktionærer
Alpha Teknova, Inc. (US:TKNO) har 73 institutionelle ejere og aktionærer, der har indsendt 13D/G- eller 13F-formularer til Securities Exchange Commission (SEC). Disse institutioner har i alt 7,057,071 aktier. Største aktionærer omfatter Roubaix Capital, LLC, Balyasny Asset Management Llc, UBS Group AG, BlackRock, Inc., Vanguard Group Inc, Conestoga Capital Advisors, LLC, Royce & Associates Lp, Geode Capital Management, Llc, Bank Of America Corp /de/, and Massar Capital Management, LP .
Alpha Teknova, Inc. (NasdaqGM:TKNO) institutionel ejerskabsstruktur viser aktuelle positioner i virksomheden efter institutioner og fonde, samt seneste ændringer i positionsstørrelse. Større aktionærer kan omfatte individuelle investorer, investeringsforeninger, hedgefonde eller institutioner. Skema 13D angiver, at investoren besidder (eller besidder) mere end 5 % af virksomheden og har til hensigt (eller har til hensigt at) aktivt at forfølge en ændring i forretningsstrategi. Skema 13G indikerer en passiv investering på over 5%.
The share price as of March 27, 2026 is 2,71 / share. Previously, on March 28, 2025, the share price was 5,21 / share. This represents a decline of 47,98% over that period.
Fondens stemningsscore
Fund Sentiment Score (fka Ownership Accumulation Score) finder de aktier, der bliver mest købt af fonde. Det er resultatet af en sofistikeret, multi-faktor kvantitativ model, der identificerer virksomheder med de højeste niveauer af institutionel akkumulering. Scoringsmodellen bruger en kombination af den samlede stigning i oplyste ejere, ændringerne i porteføljeallokeringer i disse ejere og andre målinger. Tallet går fra 0 til 100, hvor højere tal indikerer et højere niveau af akkumulering for sine jævnaldrende, og 50 er gennemsnittet.
Opdateringsfrekvens: Dagligt
Se Ownership Explorer, som giver en liste over højest rangerende virksomheder.
AI+ Ask Fintel’s AI assistant about Alpha Teknova, Inc..
Select a question to share a public post with an AI-crafted answer.
Thinking of good questions…
Institutionel Put/Call-forhold
Ud over at indberette standardaktie- og gældsudstedelser skal institutter med mere end 100 mill. aktiver under forvaltning også oplyse deres put- og call-optionsbeholdninger. Da salgsoptioner generelt indikerer negativ stemning, og købsoptioner indikerer positiv stemning, kan vi få en fornemmelse af den overordnede institutionelle stemning ved at plotte forholdet mellem put og kald. Diagrammet til højre viser det historiske put/call-forhold for dette instrument.
Brug af Put/Call Ratio som en indikator for investorernes stemning overvinder en af de vigtigste mangler ved at bruge totalt institutionelt ejerskab, som er, at en betydelig mængde af aktiver under forvaltning investeres passivt for at spore indekser. Passivt forvaltede fonde køber typisk ikke optioner, så indikatoren for put/call-forholdet følger mere nøje følelsen af aktivt forvaltede fonde.
13F og NPORT arkivering
Detaljer om 13F-arkivering er gratis. Detaljer om NP-ansøgninger kræver et premium-medlemskab. Grønne rækker angiver nye positioner. Røde rækker angiver lukkede positioner. Klik på linket ikon for at se den fulde transaktionshistorik.
Opgrader
for at låse premium-data op og eksportere til Excel ![]() .
.
| Fil dato | Kilde | Investor | Type | Gennemsnitlig pris (Øst) |
Aktier | Δ Aktier (%) |
Rapporteret Værdi ($1000) |
Δ Værdi (%) |
Port Alloc (%) |
|
|---|---|---|---|---|---|---|---|---|---|---|
| 2026-02-06 | 13F | ProShare Advisors LLC | 10.002 | 38 | ||||||
| 2026-02-12 | 13F | Nuveen, LLC | 14.158 | 0,00 | 54 | -39,08 | ||||
| 2026-02-17 | 13F | Tower Research Capital LLC (TRC) | 2.865 | 52,39 | 11 | -9,09 | ||||
| 2026-02-05 | 13F | Amalgamated Bank | 341 | -7,84 | 0 | |||||
| 2026-02-17 | 13F | Two Sigma Investments, Lp | 61.463 | 66,13 | 234 | 1,75 | ||||
| 2026-02-10 | 13F | Fielder Capital Group LLC | 25.153 | 0,01 | 96 | -38,71 | ||||
| 2026-02-12 | 13F | Jane Street Group, Llc | 62.903 | 239 | ||||||
| 2025-11-14 | 13F | Boothbay Fund Management, Llc | 0 | -100,00 | 0 | |||||
| 2026-01-05 | 13F | GAMMA Investing LLC | 140 | 1 | ||||||
| 2026-02-05 | 13F | Mount Lucas Management LP | 70.000 | 0,00 | 266 | -38,57 | ||||
| 2026-02-17 | 13F | Northern Trust Corp | 90.834 | -10,07 | 345 | -44,80 | ||||
| 2026-02-13 | 13F | Wexford Capital Lp | 0 | -100,00 | 0 | |||||
| 2026-02-17 | 13F | MIRAE ASSET GLOBAL ETFS HOLDINGS Ltd. | 5.069 | 3,60 | 19 | -36,67 | ||||
| 2026-02-17 | 13F | Citadel Advisors Llc | 68.353 | 260 | ||||||
| 2026-02-17 | 13F | Susquehanna International Group, Llp | 38.784 | 139,32 | 147 | 47,00 | ||||
| 2026-02-06 | 13F | Larson Financial Group LLC | 2.525 | -73,10 | 10 | -84,48 | ||||
| 2026-02-17 | 13F | Fmr Llc | 575 | 12,75 | 2 | -33,33 | ||||
| 2026-01-29 | 13F | Kestra Private Wealth Services, Llc | 105.673 | 32,68 | 402 | -18,66 | ||||
| 2025-11-04 | 13F | UMA Financial Services, Inc. | 0 | -100,00 | 0 | |||||
| 2026-02-17 | 13F | Bridgeway Capital Management Inc | 80.900 | 0,00 | 307 | -38,60 | ||||
| 2026-02-13 | 13F | SRS Capital Advisors, Inc. | 0 | -100,00 | 0 | |||||
| 2026-02-13 | 13F | Police & Firemen's Retirement System of New Jersey | 4.306 | 0,00 | 16 | -38,46 | ||||
| 2026-02-03 | 13F | Credit Industriel Et Commercial | 2.000 | 0,00 | 8 | -41,67 | ||||
| 2026-02-11 | 13F | Jpmorgan Chase & Co | 7.948 | 2,38 | 30 | -37,50 | ||||
| 2026-02-17 | 13F | Royal Bank Of Canada | 387 | -21,50 | 1 | -66,67 | ||||
| 2026-02-17 | 13F | Sherbrooke Park Advisers Llc | 12.948 | -14,75 | 49 | -47,87 | ||||
| 2026-01-27 | 13F | Zurcher Kantonalbank (Zurich Cantonalbank) | 906 | 0,00 | 3 | -40,00 | ||||
| 2025-11-07 | 13F | Gsa Capital Partners Llp | 0 | -100,00 | 0 | |||||
| 2026-02-13 | 13F | Rhumbline Advisers | 13.866 | -10,77 | 53 | -45,83 | ||||
| 2026-02-17 | 13F | Bank Of America Corp /de/ | 227.085 | 0,60 | 863 | -38,30 | ||||
| 2026-01-29 | 13F | China Universal Asset Management Co., Ltd. | 8.723 | -7,00 | 33 | -43,10 | ||||
| 2026-02-13 | 13F | Sterling Capital Management LLC | 112 | 57,75 | 0 | |||||
| 2025-11-14 | 13F | ExodusPoint Capital Management, LP | 29.712 | -17,61 | 184 | |||||
| 2026-02-10 | 13F | Goldman Sachs Group Inc | 55.048 | -8,49 | 209 | -43,82 | ||||
| 2026-02-11 | 13F | Simplex Trading, Llc | 48 | 0 | ||||||
| 2026-01-29 | 13F | UBS Group AG | 737.265 | -50,92 | 2.802 | -69,88 | ||||
| 2025-11-14 | 13F | Aquatic Capital Management LLC | 0 | -100,00 | 0 | |||||
| 2026-02-09 | 13F | Roubaix Capital, LLC | 998.532 | 19,75 | 3.794 | -26,49 | ||||
| 2026-02-13 | 13F | Barclays Plc | 20.342 | 1,68 | 77 | -37,40 | ||||
| 2026-02-12 | 13F | New York State Common Retirement Fund | 12.500 | -36,22 | 48 | -61,16 | ||||
| 2026-02-17 | 13F | Russell Investments Group, Ltd. | 1.271 | 35,79 | 5 | -20,00 | ||||
| 2026-02-12 | 13F | Dimensional Fund Advisors Lp | 11.752 | 3,84 | 45 | -35,29 | ||||
| 2026-02-13 | 13F | National Bank Of Canada /fi/ | 0 | -100,00 | 0 | |||||
| 2025-11-14 | 13F | Advisor Group Holdings, Inc. | 0 | -100,00 | 0 | |||||
| 2025-11-14 | 13F | Atom Investors LP | 0 | -100,00 | 0 | -100,00 | ||||
| 2026-01-29 | 13F | Vanguard Group Inc | 593.100 | -5,19 | 2.254 | -41,81 | ||||
| 2025-09-29 | NP | RSSL - Global X Russell 2000 ETF | 5.413 | 24 | ||||||
| 2026-01-26 | 13F | Cwm, Llc | 68 | 30,77 | 0 | |||||
| 2025-11-14 | 13F | Raymond James Financial Inc | 0 | -100,00 | 0 | |||||
| 2026-02-17 | 13F | PharVision Advisers, LLC | 0 | -100,00 | 0 | |||||
| 2026-02-17 | 13F | Millennium Management Llc | 0 | -100,00 | 0 | |||||
| 2026-01-06 | 13F | Sanctuary Advisors, LLC | 52.814 | 274 | ||||||
| 2026-02-11 | 13F | Ameritas Investment Partners, Inc. | 1.108 | 4 | ||||||
| 2026-02-17 | 13F | Engineers Gate Manager LP | 0 | -100,00 | 0 | |||||
| 2025-09-29 | NP | SUNAMERICA SERIES TRUST - SA Small Cap Index Portfolio Class 1 | 1.233 | 6 | ||||||
| 2026-02-13 | 13F | State Street Corp | 156.529 | -0,63 | 595 | -39,08 | ||||
| 2026-01-27 | 13F | Gf Fund Management Co. Ltd. | 1.051 | -8,21 | 4 | -57,14 | ||||
| 2026-02-17 | 13F | Massar Capital Management, LP | 200.000 | 0,00 | 760 | -38,61 | ||||
| 2026-02-10 | 13F | Bank of New York Mellon Corp | 119.083 | 0,87 | 453 | -38,08 | ||||
| 2026-02-13 | 13F | Quarry LP | 0 | -100,00 | 0 | |||||
| 2026-02-09 | 13F | Geode Capital Management, Llc | 287.432 | 1,06 | 1.093 | -37,99 | ||||
| 2026-02-03 | 13F | SBI Securities Co., Ltd. | 13 | 0 | ||||||
| 2026-02-13 | 13F | Charles Schwab Investment Management Inc | 34.298 | 0,08 | 130 | -38,68 | ||||
| 2026-02-02 | 13F | Conestoga Capital Advisors, LLC | 317.084 | 2,64 | 1.205 | -37,03 | ||||
| 2025-11-14 | 13F | Ikarian Capital, LLC | 0 | -100,00 | 0 | |||||
| 2026-02-13 | 13F | Citigroup Inc | 1.739 | -2,14 | 7 | -40,00 | ||||
| 2026-02-17 | 13F | California State Teachers Retirement System | 666 | -1,77 | 3 | -50,00 | ||||
| 2025-10-29 | 13F | McAdam, LLC | 0 | -100,00 | 0 | |||||
| 2026-02-13 | 13F | Divisadero Street Capital Management, LP | 78.872 | 0,00 | 300 | -38,73 | ||||
| 2026-02-17 | 13F | Two Sigma Securities, Llc | 22.626 | 86 | ||||||
| 2026-01-26 | 13F | Mirae Asset Global Investments Co., Ltd. | 2.601 | 25,71 | 10 | -25,00 | ||||
| 2026-02-11 | 13F | Deutsche Bank Ag\ | 14.425 | 0,00 | 55 | -39,33 | ||||
| 2026-02-13 | 13F | Morgan Stanley | 75.667 | -29,63 | 288 | -56,84 | ||||
| 2026-02-17 | 13F | Balyasny Asset Management Llc | 987.197 | -0,00 | 3.751 | -38,61 | ||||
| 2025-11-13 | 13F | Renaissance Technologies Llc | 0 | -100,00 | 0 | |||||
| 2026-02-09 | 13F | Royce & Associates Lp | 293.576 | 1.116 | ||||||
| 2026-02-13 | 13F | Squarepoint Ops LLC | 60.582 | -27,54 | 230 | -55,51 | ||||
| 2026-02-09 | 13F | Legal & General Group Plc | 1.204 | 0,00 | 5 | -42,86 | ||||
| 2026-02-13 | 13F | Tradewinds, LLC. | 48.803 | -68,82 | 185 | -80,89 | ||||
| 2026-02-17 | 13F | XTX Topco Ltd | 20.142 | 77 | ||||||
| 2026-02-12 | 13F | BlackRock, Inc. | 730.912 | 5,30 | 2.777 | -35,36 | ||||
| 2025-10-24 | 13F | Bay Colony Advisory Group, Inc d/b/a Bay Colony Advisors | 0 | -100,00 | 0 | |||||
| 2026-02-12 | 13F | EHP Funds Inc. | 0 | -100,00 | 0 | |||||
| 2025-11-07 | 13F | CenterBook Partners LP | 0 | -100,00 | 0 | |||||
| 2026-02-11 | 13F | T3 Companies, LLC | 32.600 | 124 | ||||||
| 2026-02-17 | 13F | Apollo Management Holdings, L.P. | 65.036 | 0,00 | 247 | -38,56 | ||||
| 2026-02-18 | 13F | Vermillion & White Wealth Management Group, LLC | 423 | 0,00 | 2 | -50,00 | ||||
| 2026-01-20 | 13F | Whalen Wealth Management Inc. | 0 | -100,00 | 0 | |||||
| 2026-02-06 | 13F | Pnc Financial Services Group, Inc. | 106 | 0 | ||||||
| 2026-02-10 | 13F | Daiwa Securities Group Inc. | 300 | 0,00 | 0 | |||||
| 2026-02-13 | 13F | Wells Fargo & Company/mn | 11.883 | 43,81 | 45 | -11,76 | ||||
| 2026-02-10 | 13F | Bnp Paribas Arbitrage, Sa | 3.839 | 20,84 | 15 | -26,32 | ||||
| 2026-02-05 | 13F | Allworth Financial LP | 1 | 0 | ||||||
| 2026-02-13 | 13F | Marshall Wace, Llp | 50.156 | 191 |