Grundlæggende statistik
| Institutionelle aktier (lange) | 23.593.701 - 52,74% (ex 13D/G) - change of -8,10MM shares -25,56% MRQ |
| Institutionel værdi (lang) | $ 1.176.706 USD ($1000) |
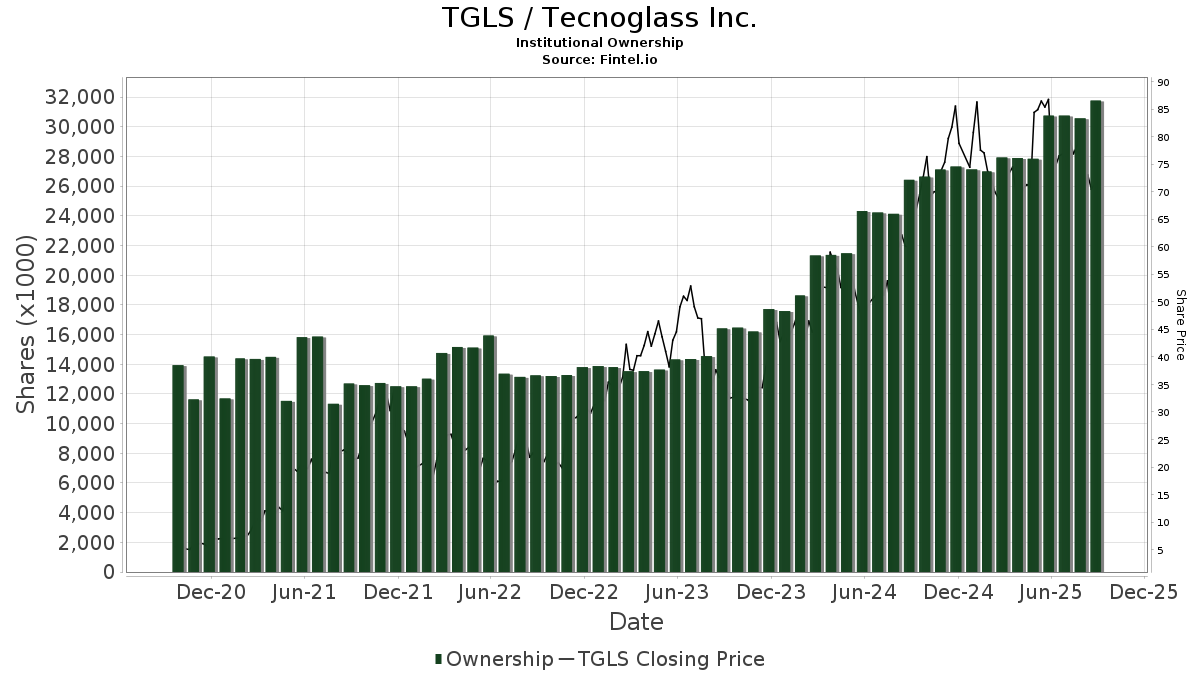
Institutionelt ejerskab og aktionærer
Tecnoglass Inc. (US:TGLS) har 179 institutionelle ejere og aktionærer, der har indsendt 13D/G- eller 13F-formularer til Securities Exchange Commission (SEC). Disse institutioner har i alt 23,593,701 aktier. Største aktionærer omfatter Fmr Llc, BlackRock, Inc., American Century Companies Inc, First Trust Advisors Lp, Capital World Investors, Delaware Management Holdings, Inc., Dimensional Fund Advisors Lp, William Blair Investment Management, Llc, Owls Nest Partners IA, LLC, and Geode Capital Management, Llc .
Tecnoglass Inc. (NYSE:TGLS) institutionel ejerskabsstruktur viser aktuelle positioner i virksomheden efter institutioner og fonde, samt seneste ændringer i positionsstørrelse. Større aktionærer kan omfatte individuelle investorer, investeringsforeninger, hedgefonde eller institutioner. Skema 13D angiver, at investoren besidder (eller besidder) mere end 5 % af virksomheden og har til hensigt (eller har til hensigt at) aktivt at forfølge en ændring i forretningsstrategi. Skema 13G indikerer en passiv investering på over 5%.
The share price as of April 13, 2026 is 45,74 / share. Previously, on April 14, 2025, the share price was 71,75 / share. This represents a decline of 36,25% over that period.
Fondens stemningsscore
Fund Sentiment Score (fka Ownership Accumulation Score) finder de aktier, der bliver mest købt af fonde. Det er resultatet af en sofistikeret, multi-faktor kvantitativ model, der identificerer virksomheder med de højeste niveauer af institutionel akkumulering. Scoringsmodellen bruger en kombination af den samlede stigning i oplyste ejere, ændringerne i porteføljeallokeringer i disse ejere og andre målinger. Tallet går fra 0 til 100, hvor højere tal indikerer et højere niveau af akkumulering for sine jævnaldrende, og 50 er gennemsnittet.
Opdateringsfrekvens: Dagligt
Se Ownership Explorer, som giver en liste over højest rangerende virksomheder.
AI+ Ask Fintel’s AI assistant about Tecnoglass Inc..
Select a question to share a public post with an AI-crafted answer.
Thinking of good questions…
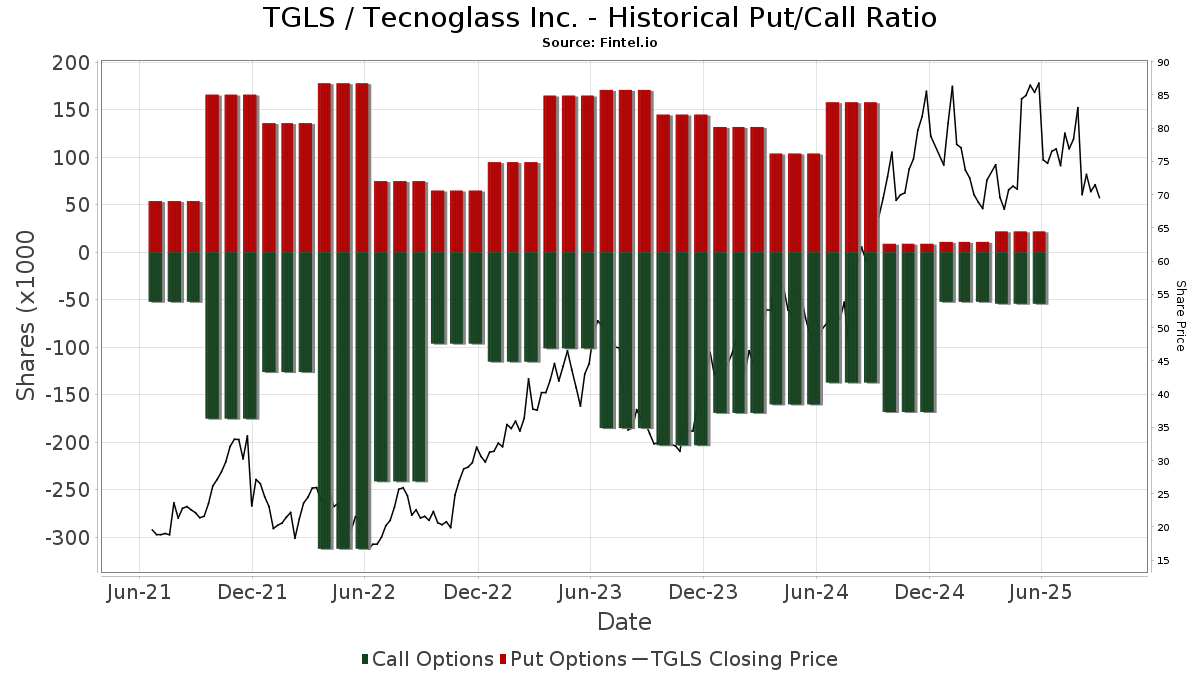
Institutionel Put/Call-forhold
Ud over at indberette standardaktie- og gældsudstedelser skal institutter med mere end 100 mill. aktiver under forvaltning også oplyse deres put- og call-optionsbeholdninger. Da salgsoptioner generelt indikerer negativ stemning, og købsoptioner indikerer positiv stemning, kan vi få en fornemmelse af den overordnede institutionelle stemning ved at plotte forholdet mellem put og kald. Diagrammet til højre viser det historiske put/call-forhold for dette instrument.
Brug af Put/Call Ratio som en indikator for investorernes stemning overvinder en af de vigtigste mangler ved at bruge totalt institutionelt ejerskab, som er, at en betydelig mængde af aktiver under forvaltning investeres passivt for at spore indekser. Passivt forvaltede fonde køber typisk ikke optioner, så indikatoren for put/call-forholdet følger mere nøje følelsen af aktivt forvaltede fonde.
13D/G-arkivering
Vi præsenterer 13D/G ansøgninger separat fra 13F ansøgninger på grund af den forskellige behandling af SEC. 13D/G-ansøgninger kan indgives af grupper af investorer (med én ledende), hvorimod 13F-ansøgninger ikke kan. Dette resulterer i situationer, hvor en investor kan indsende en 13D/G, der rapporterer én værdi for de samlede aktier (der repræsenterer alle de aktier, der ejes af investorgruppen), men derefter indsender en 13F, der rapporterer en anden værdi for de samlede aktier (der udelukkende repræsenterer deres egne) ejendomsret). Det betyder, at aktieejerskab af 13D/G-arkiver og 13F-arkiveringer ofte ikke er direkte sammenlignelige, så vi præsenterer dem separat.
Bemærk: Fra den 16. maj 2021 viser vi ikke længere ejere, der ikke har indsendt en 13D/G inden for det seneste år. Tidligere viste vi den fulde historie af 13D/G-arkiver. Generelt skal enheder, der er forpligtet til at indgive 13D/G-ansøgninger, indgive mindst årligt, før de indsender en afsluttende ansøgning. Dog forlader fonde nogle gange positioner uden at indsende en afsluttende ansøgning (dvs. de afvikler), så visning af den fulde historie resulterede nogle gange i forvirring om det nuværende ejerskab. For at undgå forvirring viser vi nu kun 'aktuelle' ejere - det vil sige - ejere, der har anmeldt inden for det seneste år.
Upgrade to unlock premium data.
| Fil dato | Form | Investor | Forrige Aktier |
Seneste Aktier |
Δ Aktier (Procent) |
Ejendomsret (Procent) |
Δ Ejerskab (Procent) |
|
|---|---|---|---|---|---|---|---|---|
| 2025-11-05 | FMR LLC | 5,931,167 | 6,853,236 | 15.55 | 14.60 | 15.87 | ||
| 2025-08-15 | Energy Holding Corp | 21,705,988 | 20,210,090 | -6.89 | 43.00 | -6.93 |
13F og NPORT arkivering
Detaljer om 13F-arkivering er gratis. Detaljer om NP-ansøgninger kræver et premium-medlemskab. Grønne rækker angiver nye positioner. Røde rækker angiver lukkede positioner. Klik på linket ikon for at se den fulde transaktionshistorik.
Opgrader
for at låse premium-data op og eksportere til Excel ![]() .
.
| Fil dato | Kilde | Investor | Type | Gennemsnitlig pris (Øst) |
Aktier | Δ Aktier (%) |
Rapporteret Værdi ($1000) |
Δ Værdi (%) |
Port Alloc (%) |
|
|---|---|---|---|---|---|---|---|---|---|---|
| 2026-02-17 | 13F | Russell Investments Group, Ltd. | 2.966 | 5,89 | 149 | -20,32 | ||||
| 2026-02-12 | 13F | Quadrant Capital Group Llc | 529 | -88,95 | 27 | -91,87 | ||||
| 2026-01-14 | 13F | Exchange Traded Concepts, Llc | 4.943 | 249 | ||||||
| 2026-02-05 | 13F | Cambridge Investment Research Advisors, Inc. | 8.488 | -13,13 | 0 | |||||
| 2026-02-17 | 13F | Prelude Capital Management, Llc | 5.659 | 285 | ||||||
| 2026-02-12 | 13F | Cloud Capital Management, LLC | 0 | -100,00 | 0 | |||||
| 2026-02-17 | 13F | Qube Research & Technologies Ltd | 140.210 | -5,28 | 7.055 | -28,77 | ||||
| 2026-02-17 | 13F | Silvercrest Asset Management Group Llc | 0 | -100,00 | 0 | |||||
| 2026-02-04 | 13F | Ameritas Advisory Services, LLC | 0 | -100,00 | 0 | |||||
| 2026-01-15 | 13F | Fortitude Family Office, LLC | 0 | -100,00 | 0 | |||||
| 2026-01-26 | 13F | Private Trust Co Na | 68 | 0,00 | 3 | -25,00 | ||||
| 2026-01-30 | 13F | Turning Point Benefit Group, Inc. | 2 | 0,00 | 0 | |||||
| 2026-01-12 | 13F | Rialto Wealth Management, LLC | 0 | -100,00 | 0 | |||||
| 2026-02-11 | 13F | Ameritas Investment Partners, Inc. | 2.239 | 113 | ||||||
| 2026-02-10 | 13F | Thompson Siegel & Walmsley Llc | 76.300 | 263,33 | 4 | 200,00 | ||||
| 2026-02-17 | 13F | one8zero8, LLC | 96.376 | 3,85 | 4.850 | -21,90 | ||||
| 2026-02-05 | 13F | Atria Investments Llc | 0 | -100,00 | 0 | |||||
| 2026-02-09 | 13F | Cooke & Bieler Lp | 487.371 | -12,18 | 24.525 | -33,96 | ||||
| 2026-02-17 | 13F | Aquatic Capital Management LLC | 0 | -100,00 | 0 | |||||
| 2026-02-13 | 13F | Macquarie Group Ltd | 0 | -100,00 | 0 | |||||
| 2026-02-11 | 13F | Hughes Financial Services, LLC | 2 | 0 | ||||||
| 2026-01-26 | 13F | Nations Financial Group Inc, /ia/ /adv | 0 | -100,00 | 0 | |||||
| 2025-11-14 | 13F | Point72 Europe (London) LLP | 58 | 4 | ||||||
| 2026-02-17 | 13F | Ancora Advisors, LLC | 500 | 0,00 | 25 | -24,24 | ||||
| 2026-02-12 | 13F | Steward Partners Investment Advisory, Llc | 760 | -5,00 | 38 | -28,30 | ||||
| 2025-11-14 | 13F | Skopos Labs, Inc. | 0 | -100,00 | 0 | |||||
| 2026-02-11 | 13F | X-Square Capital, LLC | 7.764 | 6,90 | 0 | |||||
| 2025-11-13 | 13F | Prudential Financial Inc | 0 | -100,00 | 0 | |||||
| 2026-02-12 | 13F | Jane Street Group, Llc | 0 | -100,00 | 0 | |||||
| 2026-02-17 | 13F | Point72 Asset Management, L.P. | 0 | -100,00 | 0 | |||||
| 2026-02-13 | 13F | Barclays Plc | 42.288 | 19,63 | 2.128 | -10,06 | ||||
| 2026-01-26 | 13F | Cwm, Llc | 375 | 151,68 | 0 | |||||
| 2026-01-29 | 13F | Sanctuary Advisors, LLC | 4.333 | -16,88 | 218 | -37,36 | ||||
| 2025-11-04 | 13F | UMA Financial Services, Inc. | 0 | -100,00 | 0 | |||||
| 2026-02-09 | 13F | Geode Capital Management, Llc | 640.586 | 5,83 | 32.242 | -20,41 | ||||
| 2026-02-11 | 13F | Franklin Resources Inc | 19.146 | -12,00 | 963 | -33,81 | ||||
| 2026-01-27 | 13F | First Horizon Corp | 673 | 63,35 | 34 | 22,22 | ||||
| 2026-02-12 | 13F | Campbell & CO Investment Adviser LLC | 0 | -100,00 | 0 | |||||
| 2026-02-10 | 13F | Envestnet Asset Management Inc | 0 | -100,00 | 0 | |||||
| 2026-02-17 | 13F | Balyasny Asset Management Llc | 0 | -100,00 | 0 | |||||
| 2026-01-23 | 13F | TFC Financial Management | 0 | -100,00 | 0 | |||||
| 2026-02-17 | 13F | Advisor Group Holdings, Inc. | 9.226 | 7,97 | 466 | -20,78 | ||||
| 2026-02-06 | 13F | ProShare Advisors LLC | 4.958 | 19,13 | 249 | -10,43 | ||||
| 2026-02-13 | 13F | Manufacturers Life Insurance Company, The | 0 | -100,00 | 0 | |||||
| 2026-02-03 | 13F | Denali Advisors Llc | 33.823 | 1.702 | ||||||
| 2026-01-23 | 13F | Private Wealth Management Group, LLC | 32 | 2 | ||||||
| 2026-02-17 | 13F | Kemnay Advisory Services Inc. | 551 | 28 | ||||||
| 2026-02-17 | 13F | ExodusPoint Capital Management, LP | 0 | -100,00 | 0 | -100,00 | ||||
| 2026-02-11 | 13F | O'shaughnessy Asset Management, Llc | 5.102 | -48,30 | 257 | -61,21 | ||||
| 2026-02-17 | 13F | Millennium Management Llc | 72.868 | -59,91 | 3.667 | -69,85 | ||||
| 2026-02-17 | 13F | Ameriprise Financial Inc | 53.525 | 12,54 | 2.693 | -15,37 | ||||
| 2026-02-13 | 13F | Entropy Technologies, LP | 0 | -100,00 | 0 | |||||
| 2025-10-15 | 13F | Harbor Capital Advisors, Inc. | 0 | -100,00 | 0 | |||||
| 2026-02-11 | 13F | Clearbridge Investments, LLC | 95.896 | -8,06 | 4.825 | -30,85 | ||||
| 2026-01-15 | 13F | Nisa Investment Advisors, Llc | 32 | -90,06 | 2 | -95,24 | ||||
| 2026-02-17 | 13F | Wellington Management Group Llp | 0 | -100,00 | 0 | |||||
| 2025-11-14 | 13F | Northwestern Mutual Wealth Management Co | 0 | -100,00 | 0 | |||||
| 2026-02-13 | 13F | Arrowstreet Capital, Limited Partnership | 0 | -100,00 | 0 | |||||
| 2026-02-17 | 13F | Canada Pension Plan Investment Board | 0 | -100,00 | 0 | |||||
| 2026-02-10 | 13F | Quantbot Technologies LP | 6.864 | -57,03 | 345 | -67,70 | ||||
| 2026-02-13 | 13F | SRS Capital Advisors, Inc. | 596 | 128,35 | 30 | 70,59 | ||||
| 2026-02-13 | 13F | Victory Capital Management Inc | 71.004 | -75,72 | 3.573 | -81,74 | ||||
| 2026-02-17 | 13F | Aqr Capital Management Llc | 27.479 | 13,86 | 1.383 | -14,37 | ||||
| 2026-01-12 | 13F | DAVENPORT & Co LLC | 0 | -100,00 | 0 | |||||
| 2026-02-17 | 13F | Fmr Llc | 6.914.985 | 0,90 | 347.962 | -24,12 | ||||
| 2025-11-14 | 13F | Broad Bay Capital Management, LP | 0 | -100,00 | 0 | |||||
| 2026-02-13 | 13F | Mariner, LLC | 0 | -100,00 | 0 | |||||
| 2026-02-18 | 13F | Cim, Llc | 5.318 | -3,10 | 268 | -27,25 | ||||
| 2026-04-06 | 13F | Versant Capital Management, Inc | 72 | 188,00 | 3 | 200,00 | ||||
| 2026-01-27 | 13F | WealthCollab, LLC | 0 | -100,00 | 0 | |||||
| 2026-02-12 | 13F | Advisors Asset Management, Inc. | 10.965 | -1,56 | 552 | -26,04 | ||||
| 2026-02-27 | 13F | Compass Financial Services Inc | 0 | -100,00 | 0 | |||||
| 2026-02-09 | 13F | Keating Financial Advisory Services, Inc. | 2.833 | 143 | ||||||
| 2026-02-13 | 13F | Smartleaf Asset Management LLC | 0 | -100,00 | 0 | |||||
| 2026-02-17 | 13F | XTX Topco Ltd | 60.076 | 3.023 | ||||||
| 2026-02-17 | 13F | Trexquant Investment LP | 109.012 | 118,36 | 5.485 | 64,22 | ||||
| 2026-01-14 | 13F | Hennion & Walsh Asset Management, Inc. | 0 | -100,00 | 0 | |||||
| 2026-02-13 | 13F | Fieldview Capital Management, LLC | 0 | -100,00 | 0 | |||||
| 2026-02-17 | 13F | California State Teachers Retirement System | 1.670 | 9,87 | 84 | -16,83 | ||||
| 2026-02-10 | 13F | Goldman Sachs Group Inc | 285.426 | 195,93 | 14.363 | 122,56 | ||||
| 2026-02-17 | 13F | Raymond James Financial Inc | 32.287 | -1,94 | 1.625 | -26,28 | ||||
| 2026-01-30 | 13F | R Squared Ltd | 6.428 | 23,45 | 323 | -7,18 | ||||
| 2026-01-29 | 13F | Verdence Capital Advisors LLC | 7.418 | 2,22 | 373 | -14,06 | ||||
| 2026-02-10 | 13F | Rothschild Investment Llc | 11.043 | -0,08 | 556 | -24,90 | ||||
| 2026-02-17 | 13F | Bank Of America Corp /de/ | 149.261 | -1,40 | 7.511 | -25,85 | ||||
| 2026-02-03 | 13F | Chesapeake Capital Corp /il/ | 0 | -100,00 | 0 | |||||
| 2025-11-17 | 13F | Castleark Management Llc | 0 | -100,00 | 0 | |||||
| 2025-10-17 | 13F | Valley National Advisers Inc | 0 | -100,00 | 0 | |||||
| 2026-02-09 | 13F | Connors Investor Services Inc | 41.215 | 2.074 | ||||||
| 2026-02-17 | 13F | Engineers Gate Manager LP | 60.705 | 118,43 | 3.055 | 64,28 | ||||
| 2025-10-27 | 13F | Polaris Capital Management, LLC | 0 | -100,00 | 0 | |||||
| 2026-02-06 | 13F | Handelsbanken Fonder AB | 8.600 | 30,30 | 0 | |||||
| 2026-01-16 | 13F | Ronald Blue Trust, Inc. | 89 | 0,00 | 4 | -20,00 | ||||
| 2026-02-17 | 13F | Optiver Holding B.V. | 155 | -6,63 | 8 | -36,36 | ||||
| 2026-02-17 | 13F | Jones Financial Companies Lllp | 58 | 3 | ||||||
| 2026-02-12 | 13F | Pinnacle Holdings, LLC | 315 | 0,00 | 16 | -28,57 | ||||
| 2026-01-30 | 13F | Jennison Associates Llc | 0 | -100,00 | 0 | |||||
| 2026-01-23 | 13F | Assetmark, Inc | 44 | 2 | ||||||
| 2026-02-17 | 13F | Advisory Services Network, LLC | 0 | -100,00 | 0 | |||||
| 2026-02-10 | 13F | Intech Investment Management Llc | 15.800 | 0,00 | 795 | -24,79 | ||||
| 2026-02-13 | 13F | First Trust Advisors Lp | 1.209.419 | 17,77 | 60.858 | -11,43 | ||||
| 2026-02-06 | 13F | Pnc Financial Services Group, Inc. | 34 | -76,39 | 2 | -88,89 | ||||
| 2026-02-12 | 13F | Aviva Plc | 9.889 | 45,30 | 498 | 9,23 | ||||
| 2026-02-13 | 13F | OMERS ADMINISTRATION Corp | 0 | -100,00 | 0 | |||||
| 2025-11-12 | 13F | Park Square Financial Group, LLC | 0 | -100,00 | 0 | |||||
| 2026-01-14 | 13F | Jfs Wealth Advisors, Llc | 31 | 40,91 | 2 | 0,00 | ||||
| 2026-02-02 | 13F | Bay Harbor Wealth Management, LLC | 1 | -66,67 | 0 | |||||
| 2026-02-11 | 13F | Picton Mahoney Asset Management | 17 | 0,00 | 1 | |||||
| 2025-11-14 | 13F | Man Group plc | 0 | -100,00 | 0 | |||||
| 2026-01-30 | 13F | Us Bancorp \de\ | 66 | 17,86 | 3 | 0,00 | ||||
| 2026-02-12 | 13F | Riverwater Partners LLC | 62.485 | 7,59 | 3.144 | -19,09 | ||||
| 2026-02-13 | 13F | Caitong International Asset Management Co., Ltd | 233 | -63,42 | 12 | -73,81 | ||||
| 2026-02-17 | 13F | Northern Trust Corp | 223.977 | 1,74 | 11.271 | -23,49 | ||||
| 2026-02-11 | 13F | Capital World Investors | 1.093.255 | -39,07 | 55.013 | -54,18 | ||||
| 2025-10-24 | 13F | Hemington Wealth Management | 47 | -28,79 | 0 | |||||
| 2026-01-21 | 13F | Stone House Investment Management, LLC | 0 | -100,00 | 0 | -100,00 | ||||
| 2026-02-13 | 13F | State Street Corp | 519.254 | 9,61 | 26.207 | -17,51 | ||||
| 2026-02-17 | 13F | Lazard Asset Management Llc | 36.670 | 1.845 | ||||||
| 2026-02-17 | 13F | Susquehanna International Group, Llp | Put | 35.200 | 48,52 | 1.771 | 11,74 | |||
| 2026-02-17 | 13F | Susquehanna International Group, Llp | Call | 16.600 | -62,86 | 835 | -72,07 | |||
| 2026-04-08 | 13F | DiNuzzo Private Wealth, Inc. | 5 | -16,67 | 0 | |||||
| 2025-11-06 | 13F | Centerpoint Advisors, LLC | 0 | -100,00 | 0 | |||||
| 2026-02-11 | 13F | Deutsche Bank Ag\ | 19.020 | 10,65 | 957 | -16,78 | ||||
| 2026-02-17 | 13F | Susquehanna International Group, Llp | 31.568 | -24,10 | 1.589 | -42,92 | ||||
| 2025-11-13 | 13F | C M Bidwell & Associates Ltd | 0 | -100,00 | 0 | -100,00 | ||||
| 2026-02-10 | 13F | B. Riley Financial, Inc. | 7.700 | 387 | ||||||
| 2026-02-02 | 13F | Principal Financial Group Inc | 45.365 | 53,97 | 2.283 | 15,78 | ||||
| 2026-02-17 | 13F | Schonfeld Strategic Advisors LLC | 0 | -100,00 | 0 | |||||
| 2026-02-17 | 13F/A | Laurion Capital Management LP | 15.351 | 772 | ||||||
| 2026-02-10 | 13F | Bank of New York Mellon Corp | 69.642 | -3,59 | 3.504 | -27,50 | ||||
| 2026-04-07 | 13F | Signaturefd, Llc | 61 | -89,11 | 3 | -92,86 | ||||
| 2026-02-17 | 13F | Delaware Management Holdings, Inc. | 1.084.454 | 54.570 | ||||||
| 2026-02-12 | 13F | Ensign Peak Advisors, Inc | 136.239 | -6,43 | 6.856 | -29,63 | ||||
| 2026-02-13 | 13F | Verition Fund Management LLC | 16.400 | 0,00 | 825 | -24,79 | ||||
| 2026-02-13 | 13F | Morgan Stanley | 250.908 | 63,40 | 12.626 | 22,88 | ||||
| 2026-02-12 | 13F | CIBC Private Wealth Group, LLC | 214 | -13,71 | 11 | -37,50 | ||||
| 2026-02-18 | 13F | Vermillion & White Wealth Management Group, LLC | 0 | -100,00 | 0 | -100,00 | ||||
| 2026-02-17 | 13F | Portolan Capital Management, LLC | 238.852 | 118,60 | 12.019 | 64,42 | ||||
| 2026-02-12 | 13F | Hrt Financial Lp | 60.003 | -20,44 | 3 | -40,00 | ||||
| 2026-02-13 | 13F | Peak6 Llc | Put | 0 | -100,00 | 0 | ||||
| 2026-02-10 | 13F | Bnp Paribas Arbitrage, Sa | 6.187 | 25,22 | 311 | -5,76 | ||||
| 2026-02-13 | 13F | Peak6 Llc | 0 | -100,00 | 0 | |||||
| 2026-02-13 | 13F | PCM Encore, LLC | 6.796 | 342 | ||||||
| 2026-01-21 | 13F | SJS Investment Consulting Inc. | 3 | -25,00 | 0 | |||||
| 2026-02-12 | 13F | BlackRock, Inc. | 1.872.480 | 11,14 | 94.223 | -16,42 | ||||
| 2025-10-31 | 13F | Y-Intercept (Hong Kong) Ltd | 0 | -100,00 | 0 | |||||
| 2026-02-13 | 13F | Charles Schwab Investment Management Inc | 221.544 | 2,20 | 11.148 | -23,14 | ||||
| 2026-02-17 | 13F | PDT Partners, LLC | 0 | -100,00 | 0 | |||||
| 2026-02-03 | 13F | SBI Securities Co., Ltd. | 408 | -20,62 | 21 | -41,18 | ||||
| 2026-01-29 | 13F | Vanguard Group Inc | 640.035 | 2,32 | 32.207 | -23,05 | ||||
| 2026-02-02 | 13F | Fifth Third Bancorp | 0 | -100,00 | 0 | |||||
| 2026-02-05 | 13F | Amalgamated Bank | 852 | 9,23 | 0 | |||||
| 2026-02-09 | 13F | Harbour Investments, Inc. | 0 | -100,00 | 0 | |||||
| 2026-02-11 | 13F | J.Safra Asset Management Corp | 35 | 0,00 | 2 | -50,00 | ||||
| 2026-02-12 | 13F | Cibc World Markets Corp | 0 | -100,00 | 0 | |||||
| 2026-02-12 | 13F | EntryPoint Capital, LLC | 13.951 | 131,59 | 702 | 74,19 | ||||
| 2026-02-17 | 13F | State Of Wisconsin Investment Board | 34.375 | -34,19 | 1.730 | -50,52 | ||||
| 2025-11-14 | 13F | Cubist Systematic Strategies, LLC | 13.030 | -65,10 | 872 | -69,84 | ||||
| 2026-02-12 | 13F | MetLife Investment Management, LLC | 15.115 | 3,34 | 761 | -22,29 | ||||
| 2026-02-13 | 13F | Fourth Sail Capital LP | 346.991 | 17.461 | ||||||
| 2026-01-29 | 13F | UBS Group AG | 80.154 | -56,57 | 4.033 | -67,34 | ||||
| 2026-02-06 | 13F | EverSource Wealth Advisors, LLC | 155 | -20,92 | 8 | -46,15 | ||||
| 2026-02-24 | 13F | DGS Capital Management, LLC | 0 | -100,00 | 0 | |||||
| 2025-10-14 | 13F | HBK Sorce Advisory LLC | 0 | -100,00 | 0 | |||||
| 2025-11-17 | 13F | GWM Advisors LLC | 0 | -100,00 | 0 | |||||
| 2026-02-17 | 13F | Blue Chip Partners, Inc. | 4.250 | 6,25 | 214 | -20,22 | ||||
| 2026-02-06 | 13F | Larson Financial Group LLC | 41 | 925,00 | 2 | |||||
| 2026-04-13 | 13F | True Wealth Design, LLC | 0 | -100,00 | 0 | |||||
| 2026-02-13 | 13F | Cynosure Management, Llc | 13.598 | 46,85 | 684 | 10,50 | ||||
| 2026-02-17 | 13F | Tower Research Capital LLC (TRC) | 2.522 | 11,64 | 127 | -16,56 | ||||
| 2026-02-11 | 13F | Parallel Advisors, LLC | 175 | -1,69 | 9 | -27,27 | ||||
| 2026-02-13 | 13F | MAI Capital Management | 142 | -23,24 | 7 | -41,67 | ||||
| 2026-02-12 | 13F | Brown Brothers Harriman & Co | 81 | 4 | ||||||
| 2026-01-28 | 13F | WPG Advisers, LLC | 87 | 0,00 | 4 | -20,00 | ||||
| 2026-02-09 | 13F | Catalyst Funds Management Pty Ltd | 0 | -100,00 | 0 | |||||
| 2025-12-09 | 13F/A | Tudor Investment Corp Et Al | 0 | -100,00 | 0 | |||||
| 2026-01-15 | 13F | Nilsine Partners, LLC | 0 | -100,00 | 0 | |||||
| 2026-02-17 | 13F | Royal Bank Of Canada | 3.495 | -0,82 | 176 | -25,42 | ||||
| 2025-11-06 | 13F | Bryce Point Capital, LLC | 10.157 | 13,70 | 680 | -1,74 | ||||
| 2026-02-17 | 13F | SageView Advisory Group, LLC | 18 | 1 | ||||||
| 2026-01-09 | 13F | SG Americas Securities, LLC | 18.961 | 121,79 | 1 | |||||
| 2026-04-06 | 13F | GAMMA Investing LLC | 955 | 493,17 | 43 | 425,00 | ||||
| 2025-10-30 | 13F | CVA Family Office, LLC | 0 | -100,00 | 0 | |||||
| 2026-02-12 | 13F | Dimensional Fund Advisors Lp | 1.081.541 | 5,77 | 54.427 | -20,46 | ||||
| 2026-02-13 | 13F | Marshall Wace, Llp | 53.910 | 2.713 | ||||||
| 2026-02-19 | 13F | Invesco Ltd. | 33.225 | 2,55 | 1.672 | -22,89 | ||||
| 2026-02-09 | 13F | William Blair Investment Management, Llc | 930.033 | -0,79 | 46.799 | -25,39 | ||||
| 2026-02-11 | 13F | Jpmorgan Chase & Co | 21.563 | -35,56 | 1.085 | -51,52 | ||||
| 2026-02-11 | 13F | Fca Corp /tx | 17.334 | 0,00 | 872 | -24,76 | ||||
| 2025-11-04 | 13F | Gitterman Wealth Management, LLC | 0 | -100,00 | 0 | |||||
| 2026-02-17 | 13F | Quantinno Capital Management LP | 9.734 | 490 | ||||||
| 2026-02-13 | 13F | Parkside Financial Bank & Trust | 20 | 0,00 | 1 | 0,00 | ||||
| 2025-11-12 | 13F/A | Norges Bank | 0 | -100,00 | 0 | -100,00 | ||||
| 2026-02-12 | 13F | Federation des caisses Desjardins du Quebec | 700 | 0,00 | 35 | -23,91 | ||||
| 2026-02-13 | 13F | Citigroup Inc | 17.653 | -96,64 | 888 | -97,48 | ||||
| 2026-02-17 | 13F | Two Sigma Investments, Lp | 42.461 | 2,56 | 2.137 | -22,89 | ||||
| 2026-02-13 | 13F | Squarepoint Ops LLC | 23.823 | 38,81 | 1.199 | 4,36 | ||||
| 2026-02-11 | 13F | Empowered Funds, LLC | 967 | -98,36 | 49 | -98,44 | ||||
| 2025-10-27 | 13F | Janney Montgomery Scott LLC | 0 | -100,00 | 0 | |||||
| 2026-02-17 | 13F | Alliancebernstein L.p. | 23.520 | -2,04 | 1.184 | -26,34 | ||||
| 2026-04-07 | 13F | Farther Finance Advisors, LLC | 594 | 145,45 | 27 | 116,67 | ||||
| 2026-02-02 | 13F | Strs Ohio | 3.400 | -50,00 | 171 | -62,33 | ||||
| 2026-02-13 | 13F | Owls Nest Partners IA, LLC | 846.027 | -6,98 | 42.572 | -30,04 | ||||
| 2026-01-26 | 13F | PFG Investments, LLC | 0 | -100,00 | 0 | |||||
| 2026-02-10 | 13F | Root Financial Partners, LLC | 16 | -81,82 | 1 | -100,00 | ||||
| 2025-10-22 | 13F | Geneos Wealth Management Inc. | 0 | -100,00 | 0 | -100,00 | ||||
| 2025-11-17 | 13F | Jacobs Levy Equity Management, Inc | 0 | -100,00 | 0 | |||||
| 2026-02-11 | 13F | Los Angeles Capital Management Llc | 4.371 | 0,00 | 257 | -12,33 | ||||
| 2026-02-12 | 13F | Federated Hermes, Inc. | 402 | -32,66 | 20 | -48,72 | ||||
| 2025-11-13 | 13F | Pinnacle Associates Ltd | 0 | -100,00 | 0 | -100,00 | ||||
| 2026-02-11 | 13F | Inceptionr Llc | 19.867 | 152,86 | 1.000 | 90,29 | ||||
| 2026-02-12 | 13F | Commonwealth Equity Services, Llc | 0 | -100,00 | 0 | |||||
| 2026-02-13 | 13F | Pinnacle Wealth Planning Services, Inc. | 59 | 3 | ||||||
| 2026-02-05 | 13F | SkyOak Wealth, LLC | 0 | -100,00 | 0 | |||||
| 2026-02-06 | 13F | Kingdom Financial Group LLC. | 10 | 1 | ||||||
| 2026-01-23 | 13F | Yorktown Management & Research Co Inc | 4.050 | 204 | ||||||
| 2026-02-13 | 13F | Rhumbline Advisers | 31.405 | -9,50 | 1.580 | -31,93 | ||||
| 2026-02-13 | 13F | Police & Firemen's Retirement System of New Jersey | 6.885 | 2,17 | 346 | -23,11 | ||||
| 2026-02-12 | 13F | New York State Common Retirement Fund | 16.600 | 100,00 | 835 | 50,45 | ||||
| 2026-02-13 | 13F | American Century Companies Inc | 1.522.154 | 48,92 | 76.595 | 12,00 | ||||
| 2026-02-17 | 13F | Jump Financial, LLC | 24.365 | 1.226 | ||||||
| 2026-02-13 | 13F | JustInvest LLC | 0 | -100,00 | 0 | |||||
| 2026-02-17 | 13F | Twinbeech Capital Lp | 0 | -100,00 | 0 | |||||
| 2026-02-09 | 13F | Legal & General Group Plc | 5.004 | -0,81 | 252 | -25,52 | ||||
| 2026-02-11 | 13F | CenterBook Partners LP | 130.761 | 6.580 | ||||||
| 2026-04-13 | 13F | IFP Advisors, Inc | 2 | 100,00 | 0 | |||||
| 2026-02-12 | 13F | Nuveen, LLC | 60.682 | -42,21 | 3.054 | -56,54 | ||||
| 2026-02-06 | 13F | Global Retirement Partners, LLC | 2.298 | 0,75 | 116 | -24,34 | ||||
| 2026-02-13 | 13F | Ubs Asset Management Americas Inc | 8 | 0 | ||||||
| 2026-02-11 | 13F | LPL Financial LLC | 30.314 | 5,19 | 1.525 | -20,90 | ||||
| 2026-02-13 | 13F | Sterling Capital Management LLC | 174 | 194,92 | 9 | 166,67 | ||||
| 2026-02-17 | 13F | D. E. Shaw & Co., Inc. | 44.403 | 18,17 | 2.234 | -11,14 | ||||
| 2026-02-17 | 13F | Voloridge Investment Management, Llc | 176.081 | -19,62 | 8.860 | -39,56 | ||||
| 2026-02-06 | 13F | Covestor Ltd | 3.122 | 36,81 | 0 | |||||
| 2026-02-12 | 13F | Voya Investment Management Llc | 4.371 | 0,00 | 220 | -25,00 | ||||
| 2026-02-11 | 13F | Fox Run Management, L.l.c. | 0 | -100,00 | 0 | |||||
| 2026-02-10 | 13F | Semanteon Capital Management, LP | 0 | -100,00 | 0 | |||||
| 2026-02-13 | 13F | Sei Investments Co | 0 | -100,00 | 0 | |||||
| 2026-02-05 | 13F | Allworth Financial LP | 136 | 4.433,33 | 7 | |||||
| 2026-02-10 | 13F | State of Wyoming | 924 | -65,26 | 46 | -74,01 | ||||
| 2026-02-17 | 13F | Two Sigma Advisers, Lp | 0 | -100,00 | 0 | |||||
| 2026-04-03 | 13F | Hickory Point Bank & Trust | 800 | 36 | ||||||
| 2026-02-13 | 13F | Aigen Investment Management, Lp | 0 | -100,00 | 0 | |||||
| 2025-11-14 | 13F | Wolverine Trading, Llc | Put | 0 | -100,00 | 0 | ||||
| 2026-01-30 | 13F | CBOE Vest Financial, LLC | 88.040 | 30,22 | 4.430 | -2,06 | ||||
| 2025-11-14 | 13F | Wolverine Trading, Llc | Call | 0 | -100,00 | 0 | ||||
| 2026-02-13 | 13F | Toroso Investments, LLC | 4.018 | -65,52 | 202 | -74,07 | ||||
| 2025-11-14 | 13F | Centiva Capital, LP | 0 | -100,00 | 0 | |||||
| 2026-02-17 | 13F | Citadel Advisors Llc | 0 | -100,00 | 0 | |||||
| 2026-02-17 | 13F | Citadel Advisors Llc | Put | 0 | -100,00 | 0 | ||||
| 2026-01-23 | 13F | State of Alaska, Department of Revenue | 9.337 | 215,97 | 0 | |||||
| 2026-02-13 | 13F | Wells Fargo & Company/mn | 30.766 | 91,72 | 1.548 | 44,27 | ||||
| 2026-02-17 | 13F | Price T Rowe Associates Inc /md/ | 21.602 | 16,89 | 1 | 0,00 | ||||
| 2025-11-14 | 13F | Point72 Hong Kong Ltd | 800 | 54 | ||||||
| 2026-04-10 | 13F | Linden Thomas Advisory Services, LLC | 21.110 | 101,66 | 940 | 78,71 | ||||
| 2026-02-12 | 13F | Wealthspire Advisors, LLC | 0 | -100,00 | 0 | |||||
| 2026-02-17 | 13F | Ameriflex Group, Inc. | 100 | -50,00 | 5 | -61,54 | ||||
| 2025-11-13 | 13F | Riggs Asset Managment Co. Inc. | 0 | -100,00 | 0 | |||||
| 2026-02-13 | 13F | Quarry LP | 0 | -100,00 | 0 | |||||
| 2026-02-05 | 13F | HFM Investment Advisors, LLC | 0 | -100,00 | 0 | |||||
| 2026-02-12 | 13F | Systematic Alpha Investments, LLC | 8.800 | 0,00 | 443 | -24,83 | ||||
| 2026-02-03 | 13F | Premier Fund Managers Ltd | 0 | -100,00 | 0 | |||||
| 2026-04-13 | 13F | Massmutual Trust Co Fsb/adv | 16 | -84,91 | 1 | -100,00 | ||||
| 2026-02-09 | 13F | Annis Gardner Whiting Capital Advisors, LLC | 189 | 0,00 | 10 | -25,00 | ||||
| 2026-02-17 | 13F | Citadel Advisors Llc | Call | 5.900 | -22,37 | 297 | -41,73 | |||
| 2026-02-17 | 13F | MIRAE ASSET GLOBAL ETFS HOLDINGS Ltd. | 122.732 | 81,37 | 6.176 | 36,40 | ||||
| 2026-02-17 | 13F | Aster Capital Management (DIFC) Ltd | 873 | 44 | ||||||
| 2026-02-11 | 13F | Neumeier Poma Investment Counsel Llc | 0 | -100,00 | 0 | |||||
| 2026-02-12 | 13F | BRYN MAWR TRUST Co | 3.070 | 0,00 | 154 | -24,88 | ||||
| 2026-02-13 | 13F | Stifel Financial Corp | 0 | -100,00 | 0 | |||||
| 2026-02-14 | 13F | Rockefeller Capital Management L.P. | 1.359 | 276,45 | 68 | 183,33 | ||||
| 2025-10-15 | 13F | Stephens Consulting, LLC | 0 | -100,00 | 0 |
Other Listings
| DE:7FH | 37,42 € |