Grundlæggende statistik
| Institutionelle ejere | 108 total, 105 long only, 1 short only, 2 long/short - change of -3,54% MRQ |
| Gennemsnitlig porteføljeallokering | 0.0780 % - change of -14,74% MRQ |
| Institutionelle aktier (lange) | 2.909.368 (ex 13D/G) - change of -0,43MM shares -12,87% MRQ |
| Institutionel værdi (lang) | $ 252.448 USD ($1000) |
Institutionelt ejerskab og aktionærer
Invesco Exchange-Traded Fund Trust II - Invesco S&P 500 High Beta ETF (US:SPHB) har 108 institutionelle ejere og aktionærer, der har indsendt 13D/G- eller 13F-formularer til Securities Exchange Commission (SEC). Disse institutioner har i alt 2,909,368 aktier. Største aktionærer omfatter Bank Of America Corp /de/, Cambridge Investment Research Advisors, Inc., Allianz Se, Morgan Stanley, LPL Financial LLC, Goldman Sachs Group Inc, Raymond James Financial Inc, Bnp Paribas Arbitrage, Sa, Wells Fargo & Company/mn, and Royal Bank Of Canada .
Invesco Exchange-Traded Fund Trust II - Invesco S&P 500 High Beta ETF (ARCA:SPHB) institutionel ejerskabsstruktur viser aktuelle positioner i virksomheden efter institutioner og fonde, samt seneste ændringer i positionsstørrelse. Større aktionærer kan omfatte individuelle investorer, investeringsforeninger, hedgefonde eller institutioner. Skema 13D angiver, at investoren besidder (eller besidder) mere end 5 % af virksomheden og har til hensigt (eller har til hensigt at) aktivt at forfølge en ændring i forretningsstrategi. Skema 13G indikerer en passiv investering på over 5%.
The share price as of September 15, 2025 is 108,45 / share. Previously, on September 16, 2024, the share price was 85,58 / share. This represents an increase of 26,72% over that period.

Fondens stemningsscore
Fund Sentiment Score (fka Ownership Accumulation Score) finder de aktier, der bliver mest købt af fonde. Det er resultatet af en sofistikeret, multi-faktor kvantitativ model, der identificerer virksomheder med de højeste niveauer af institutionel akkumulering. Scoringsmodellen bruger en kombination af den samlede stigning i oplyste ejere, ændringerne i porteføljeallokeringer i disse ejere og andre målinger. Tallet går fra 0 til 100, hvor højere tal indikerer et højere niveau af akkumulering for sine jævnaldrende, og 50 er gennemsnittet.
Opdateringsfrekvens: Dagligt
Se Ownership Explorer, som giver en liste over højest rangerende virksomheder.
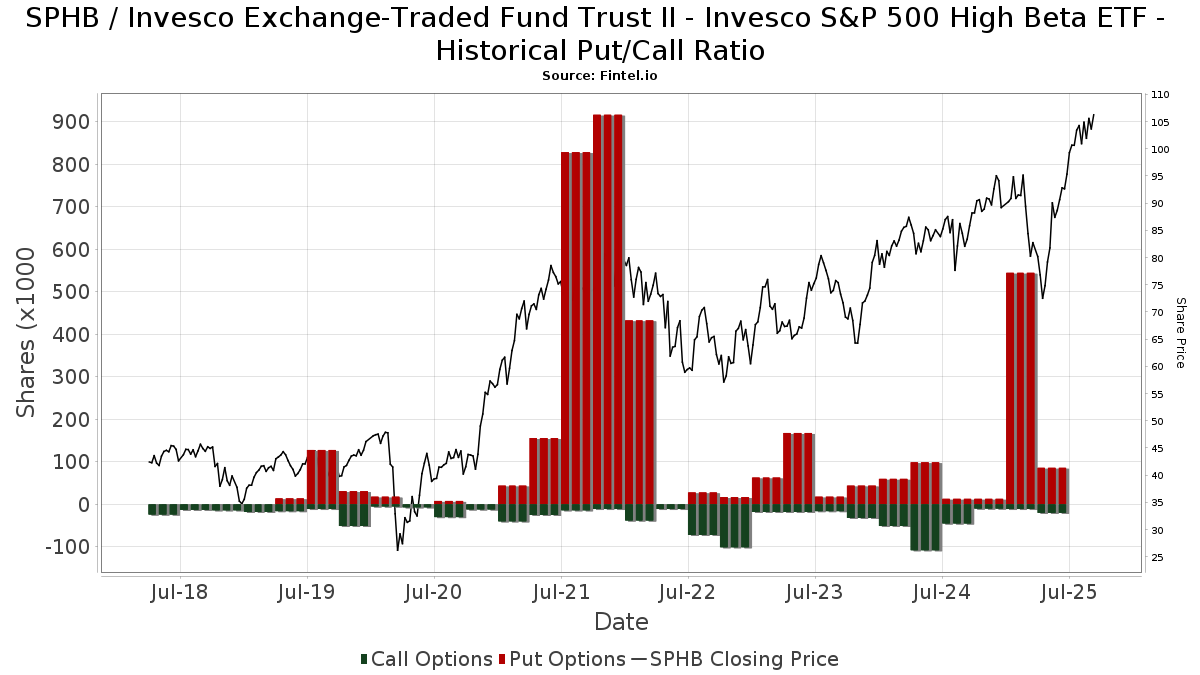
Institutionel Put/Call-forhold
Ud over at indberette standardaktie- og gældsudstedelser skal institutter med mere end 100 mill. aktiver under forvaltning også oplyse deres put- og call-optionsbeholdninger. Da salgsoptioner generelt indikerer negativ stemning, og købsoptioner indikerer positiv stemning, kan vi få en fornemmelse af den overordnede institutionelle stemning ved at plotte forholdet mellem put og kald. Diagrammet til højre viser det historiske put/call-forhold for dette instrument.
Brug af Put/Call Ratio som en indikator for investorernes stemning overvinder en af de vigtigste mangler ved at bruge totalt institutionelt ejerskab, som er, at en betydelig mængde af aktiver under forvaltning investeres passivt for at spore indekser. Passivt forvaltede fonde køber typisk ikke optioner, så indikatoren for put/call-forholdet følger mere nøje følelsen af aktivt forvaltede fonde.
13F og NPORT arkivering
Detaljer om 13F-arkivering er gratis. Detaljer om NP-ansøgninger kræver et premium-medlemskab. Grønne rækker angiver nye positioner. Røde rækker angiver lukkede positioner. Klik på linket ikon for at se den fulde transaktionshistorik.
Opgrader
for at låse premium-data op og eksportere til Excel ![]() .
.
| Fil dato | Kilde | Investor | Type | Gennemsnitlig pris (Øst) |
Aktier | Δ Aktier (%) |
Rapporteret Værdi ($1000) |
Δ Værdi (%) |
Port Alloc (%) |
|
|---|---|---|---|---|---|---|---|---|---|---|
| 2025-08-14 | 13F | Jane Street Group, Llc | 0 | -100,00 | 0 | |||||
| 2025-05-14 | 13F | BOK Financial Private Wealth, Inc. | 0 | -100,00 | 0 | -100,00 | ||||
| 2025-08-12 | 13F | Steward Partners Investment Advisory, Llc | 104 | 0,00 | 10 | 25,00 | ||||
| 2025-07-08 | 13F | Gradient Investments LLC | 3.172 | -19,23 | 309 | 0,65 | ||||
| 2025-08-14 | 13F | Goldman Sachs Group Inc | 190.334 | 120,07 | 18.563 | 174,28 | ||||
| 2025-08-14 | 13F | Mpwm Advisory Solutions, Llc | 888 | -36,02 | 87 | -20,37 | ||||
| 2025-05-01 | 13F | Q3 Asset Management | 0 | -100,00 | 0 | |||||
| 2025-07-16 | 13F | Ayalon Holdings Ltd. | 26.021 | 0,00 | 3 | 0,00 | ||||
| 2025-08-14 | 13F | Bnp Paribas Arbitrage, Sa | 142.593 | 13,81 | 13.907 | 41,84 | ||||
| 2025-08-14 | 13F | Raymond James Financial Inc | 159.696 | -0,28 | 15.575 | 24,28 | ||||
| 2025-08-14 | 13F | Wiley Bros.-aintree Capital, Llc | 2.077 | 203 | ||||||
| 2025-04-09 | 13F | HBW Advisory Services LLC | 0 | -100,00 | 0 | -100,00 | ||||
| 2025-08-14 | 13F | Summit Partners Public Asset Management, Llc | Put | 80.000 | -73,33 | 7.802 | -66,77 | |||
| 2025-07-21 | 13F | Seros Financial, LLC | 9.220 | 0,00 | 899 | 24,69 | ||||
| 2025-08-04 | 13F | Assetmark, Inc | 36 | -62,89 | 4 | -57,14 | ||||
| 2025-08-14 | 13F | Headlands Technologies LLC | 1.063 | 104 | ||||||
| 2025-07-31 | 13F | Oppenheimer Asset Management Inc. | 3.770 | -18,04 | 368 | 2,23 | ||||
| 2025-08-14 | 13F | GWM Advisors LLC | 115 | 0,00 | 11 | 22,22 | ||||
| 2025-08-14 | 13F | Mml Investors Services, Llc | 30.874 | -5,89 | 3 | 50,00 | ||||
| 2025-07-25 | 13F | 1858 Wealth Management, Llc | 2.180 | 213 | ||||||
| 2025-07-17 | 13F | XML Financial, LLC | 2.490 | 243 | ||||||
| 2025-07-25 | 13F | Cwm, Llc | 263 | 0,00 | 0 | |||||
| 2025-08-06 | 13F | Commonwealth Equity Services, Llc | 13.411 | -12,61 | 1 | 0,00 | ||||
| 2025-08-12 | 13F | Quadcap Wealth Management, LLC | 5.606 | 0,00 | 547 | 24,66 | ||||
| 2025-07-14 | 13F | Sowell Financial Services LLC | 13.100 | 1.278 | ||||||
| 2025-08-12 | 13F | Archer Investment Corp | 364 | 0,00 | 36 | 25,00 | ||||
| 2025-08-15 | 13F | Morgan Stanley | 209.463 | 23,91 | 20.429 | 54,43 | ||||
| 2025-07-16 | 13F | ORG Partners LLC | 0 | 0 | ||||||
| 2025-08-14 | 13F | Abound Financial, Llc | 19.853 | 0,01 | 1.936 | 24,66 | ||||
| 2025-08-14 | 13F | Fmr Llc | 1.284 | -32,77 | 125 | -16,11 | ||||
| 2025-07-22 | 13F | One Wealth Management Investment & Advisory Services, LLC | 4.178 | -0,74 | 407 | 23,71 | ||||
| 2025-08-08 | 13F | Capital Investment Advisory Services, LLC | 22 | -99,93 | 2 | -99,92 | ||||
| 2025-08-06 | 13F | Vestmark Advisory Solutions, Inc. | 0 | -100,00 | 0 | |||||
| 2025-08-12 | 13F | Weaver Consulting Group | 6.149 | -0,65 | 600 | 23,76 | ||||
| 2025-08-13 | 13F | Walleye Trading LLC | 4.601 | 449 | ||||||
| 2025-07-23 | 13F | New England Professional Planning Group Inc. | 3.591 | -38,55 | 350 | -23,41 | ||||
| 2025-07-10 | 13F | Wealth Enhancement Advisory Services, Llc | 2.126 | 213 | ||||||
| 2025-08-13 | 13F | Renaissance Technologies Llc | 8.600 | -77,43 | 839 | -71,89 | ||||
| 2025-04-30 | 13F | BCJ Capital Management, LLC | 0 | -100,00 | 0 | |||||
| 2025-08-12 | 13F | SRS Capital Advisors, Inc. | 150 | 0,00 | 15 | 27,27 | ||||
| 2025-08-14 | 13F | CoreCap Advisors, LLC | 0 | -100,00 | 0 | |||||
| 2025-08-14 | 13F | Citadel Advisors Llc | 103.569 | 301,76 | 10.101 | 400,79 | ||||
| 2025-04-23 | 13F | Oppenheimer & Co Inc | 0 | -100,00 | 0 | -100,00 | ||||
| 2025-08-13 | 13F | Gateway Wealth Partners, LLC | 2.202 | -86,19 | 215 | -82,85 | ||||
| 2025-08-14 | 13F | Comerica Bank | 4.848 | -12,81 | 473 | 8,51 | ||||
| 2025-03-21 | 13F | Prostatis Group LLC | 0 | -100,00 | 0 | -100,00 | ||||
| 2025-08-07 | 13F | Allworth Financial LP | 1.133 | 0,00 | 111 | 25,00 | ||||
| 2025-08-15 | 13F | Captrust Financial Advisors | 3.104 | 0,00 | 303 | 24,79 | ||||
| 2025-08-07 | 13F | Runnymede Capital Advisors, Inc. | 0 | -100,00 | 0 | |||||
| 2025-09-04 | 13F/A | Advisor Group Holdings, Inc. | 24.612 | 86,44 | 2.373 | 129,62 | ||||
| 2025-08-19 | 13F | Delos Wealth Advisors, LLC | 388 | 38 | ||||||
| 2025-07-21 | 13F | Ntv Asset Management Llc | 31.869 | -9,90 | 3.108 | 12,32 | ||||
| 2025-07-31 | 13F | Burke & Herbert Bank & Trust Co | 10.740 | -2,72 | 1.047 | 21,32 | ||||
| 2025-08-13 | 13F | Quadrature Capital Ltd | 0 | -100,00 | 0 | |||||
| 2025-08-14 | 13F | Citadel Advisors Llc | Put | 2.400 | -76,24 | 234 | -70,38 | |||
| 2025-07-29 | 13F | Private Trust Co Na | 0 | -100,00 | 0 | |||||
| 2025-07-25 | 13F | Atria Wealth Solutions, Inc. | 10.289 | 1.003 | ||||||
| 2025-08-14 | 13F/A | Barclays Plc | 1.300 | 0,00 | 0 | |||||
| 2025-08-06 | 13F | Legacy Investment Solutions, LLC | 97 | 0,00 | 9 | 12,50 | ||||
| 2025-08-14 | 13F | Qube Research & Technologies Ltd | 0 | -100,00 | 0 | |||||
| 2025-08-13 | 13F | Townsquare Capital Llc | 0 | -100,00 | 0 | |||||
| 2025-08-14 | 13F | Hrt Financial Lp | 0 | -100,00 | 0 | |||||
| 2025-05-06 | 13F | Proficio Capital Partners LLC | 0 | -100,00 | 0 | -100,00 | ||||
| 2025-07-31 | 13F | Sequent Asset Management, LLC | 3.810 | 0,00 | 372 | 24,50 | ||||
| 2025-07-31 | 13F | Brinker Capital Investments, LLC | 0 | -100,00 | 0 | -100,00 | ||||
| 2025-08-11 | 13F | Plotkin Financial Advisors, LLC | 4.650 | -3,49 | 454 | 20,16 | ||||
| 2025-07-24 | 13F | IFP Advisors, Inc | 985 | 0,00 | 96 | 24,68 | ||||
| 2025-08-19 | 13F | Cape Investment Advisory, Inc. | 311 | 0,00 | 30 | 25,00 | ||||
| 2025-05-14 | 13F | Chicago Wealth Management, Inc. | 0 | -100,00 | 0 | |||||
| 2025-07-25 | 13F | Commonwealth Financial Services, LLC | 45.863 | 4.473 | ||||||
| 2025-08-08 | 13F | Allianz Se | 223.509 | 21.799 | ||||||
| 2025-08-14 | 13F | Sunbelt Securities, Inc. | 0 | -100,00 | 0 | |||||
| 2025-08-14 | 13F | Guardian Wealth Management, Inc. | 0 | -100,00 | 0 | |||||
| 2025-08-12 | 13F | Jpmorgan Chase & Co | 49.995 | -6,49 | 4.876 | 16,54 | ||||
| 2025-08-14 | 13F | Avant Capital LLC | 3.088 | -0,71 | 301 | 23,87 | ||||
| 2025-08-06 | 13F | Legacy Wealth Managment, LLC/ID | 97 | 0,00 | 9 | 28,57 | ||||
| 2025-08-14 | 13F | MGB Wealth Management, LLC | 2.899 | -0,03 | 283 | 24,78 | ||||
| 2025-07-30 | 13F | D.a. Davidson & Co. | 10.448 | -22,92 | 1.019 | -3,96 | ||||
| 2025-08-14 | 13F | Betterment LLC | 2.460 | -14,52 | 0 | |||||
| 2025-05-08 | 13F | IFG Advisory, LLC | 0 | -100,00 | 0 | |||||
| 2025-08-13 | 13F | Jones Financial Companies Lllp | 11.263 | 28,47 | 1.094 | 58,87 | ||||
| 2025-08-08 | 13F | Avantax Advisory Services, Inc. | 14.981 | -59,21 | 1.461 | -49,16 | ||||
| 2025-08-14 | 13F | Colony Group, LLC | 2.705 | 4,24 | 264 | 29,56 | ||||
| 2025-07-10 | 13F | Legacy Financial Strategies, LLC | 5.500 | 0,00 | 536 | 24,65 | ||||
| 2025-07-29 | 13F | Stratos Wealth Partners, LTD. | 3.318 | -7,78 | 324 | 14,95 | ||||
| 2025-08-13 | 13F | Northwestern Mutual Wealth Management Co | 6.878 | -13,24 | 671 | 8,06 | ||||
| 2025-08-14 | 13F | Sig Brokerage, Lp | 20.000 | 1.951 | ||||||
| 2025-08-05 | 13F | Tsfg, Llc | 60 | 0,00 | 0 | |||||
| 2025-08-14 | 13F | Ameriprise Financial Inc | 9.634 | -2,30 | 940 | 21,79 | ||||
| 2025-08-14 | 13F | Wells Fargo & Company/mn | 128.590 | 16,44 | 12.541 | 45,12 | ||||
| 2025-08-13 | 13F | Flow Traders U.s. Llc | 0 | -100,00 | 0 | |||||
| 2025-08-12 | 13F | LPL Financial LLC | 197.363 | -48,79 | 19.249 | -36,18 | ||||
| 2025-08-14 | 13F | Stifel Financial Corp | 13.168 | -30,80 | 1.284 | -13,77 | ||||
| 2025-08-15 | 13F | Tower Research Capital LLC (TRC) | 0 | -100,00 | 0 | |||||
| 2025-07-08 | 13F | Parallel Advisors, LLC | 840 | 0,00 | 82 | 24,62 | ||||
| 2025-08-14 | 13F | EHP Funds Inc. | 21.300 | -38,79 | 2.077 | -23,72 | ||||
| 2025-05-08 | 13F | Harbour Investments, Inc. | 0 | -100,00 | 0 | |||||
| 2025-07-18 | 13F | Centricity Wealth Management, LLC | 0 | -100,00 | 0 | |||||
| 2025-04-30 | 13F | Axxcess Wealth Management, Llc | 0 | -100,00 | 0 | |||||
| 2025-07-31 | 13F | Cambridge Investment Research Advisors, Inc. | 246.024 | 2.921,29 | 24 | |||||
| 2025-08-14 | 13F | Hilltop Holdings Inc. | 26.312 | -56,16 | 2.566 | -45,36 | ||||
| 2025-08-14 | 13F | Susquehanna International Group, Llp | Put | 4.500 | -98,09 | 439 | -97,62 | |||
| 2025-08-08 | 13F | Pnc Financial Services Group, Inc. | 839 | 0,00 | 82 | 24,62 | ||||
| 2025-08-11 | 13F | Citigroup Inc | 220 | 54,93 | 21 | 90,91 | ||||
| 2025-08-14 | 13F | Susquehanna International Group, Llp | Call | 20.300 | 82,88 | 1.980 | 128,00 | |||
| 2025-08-19 | 13F | Advisory Services Network, LLC | 2.414 | 248 | ||||||
| 2025-04-22 | 13F | Synergy Financial Management, LLC | 0 | -100,00 | 0 | |||||
| 2025-08-15 | 13F | Kestra Advisory Services, LLC | 12.049 | 35,49 | 1.175 | 69,06 | ||||
| 2025-08-05 | 13F | Bank Of Montreal /can/ | 25.406 | -25,34 | 2.478 | -6,98 | ||||
| 2025-08-07 | 13F | PFG Advisors | 9.953 | -8,00 | 971 | 14,66 | ||||
| 2025-08-11 | 13F | TD Waterhouse Canada Inc. | 796 | -52,13 | 78 | -40,77 | ||||
| 2025-07-17 | 13F | City Holding Co | 0 | -100,00 | 0 | |||||
| 2025-08-14 | 13F | D. E. Shaw & Co., Inc. | 14.988 | -3,85 | 1.462 | 19,85 | ||||
| 2025-07-29 | 13F | Stratos Wealth Advisors, LLC | 5.829 | 3,77 | 569 | 29,38 | ||||
| 2025-08-11 | 13F | Aptus Capital Advisors, LLC | 182 | 0,00 | 18 | 21,43 | ||||
| 2025-08-12 | 13F | Cynosure Management, Llc | 0 | -100,00 | 0 | |||||
| 2025-07-31 | 13F | Buckingham Strategic Partners | 3.193 | 311 | ||||||
| 2025-08-06 | 13F | AE Wealth Management LLC | 7.863 | 4.342,37 | 767 | 5.792,31 | ||||
| 2025-07-31 | 13F | Optimum Investment Advisors | 53 | 0,00 | 5 | 25,00 | ||||
| 2025-05-12 | 13F | Founders Financial Securities Llc | 0 | -100,00 | 0 | |||||
| 2025-08-14 | 13F | Susquehanna International Group, Llp | 0 | -100,00 | 0 | |||||
| 2025-08-12 | 13F | O'shaughnessy Asset Management, Llc | 50 | -40,48 | 5 | -33,33 | ||||
| 2025-08-01 | 13F | Envestnet Asset Management Inc | 9.574 | -57,70 | 934 | -47,32 | ||||
| 2025-07-30 | 13F | Fingerlakes Wealth Management, Inc. | 3.562 | 2,21 | 347 | 27,57 | ||||
| 2025-08-11 | 13F | HighTower Advisors, LLC | 2.468 | -5,51 | 241 | 17,65 | ||||
| 2025-08-14 | 13F | UBS Group AG | 30.419 | -26,28 | 2.967 | -8,14 | ||||
| 2025-08-08 | 13F | Cetera Investment Advisers | 5.618 | 0,57 | 548 | 25,17 | ||||
| 2025-08-18 | 13F | Hollencrest Capital Management | 921 | 90 | ||||||
| 2025-07-16 | 13F | Legend Financial Advisors, Inc. | 204 | 20 | ||||||
| 2025-05-14 | 13F | CIBC Private Wealth Group, LLC | 0 | -100,00 | 0 | -100,00 | ||||
| 2025-08-11 | 13F | TRUE Private Wealth Advisors | 8.280 | 808 | ||||||
| 2025-08-14 | 13F | Royal Bank Of Canada | 104.470 | -23,77 | 10.189 | -5,01 | ||||
| 2025-08-08 | 13F | Gts Securities Llc | 0 | -100,00 | 0 | |||||
| 2025-08-14 | 13F | Bank Of America Corp /de/ | 485.901 | -46,53 | 47.390 | -33,36 | ||||
| 2025-08-18 | 13F/A | National Bank Of Canada /fi/ | 2.351 | 53,76 | 229 | 92,44 | ||||
| 2025-08-11 | 13F | Private Advisor Group, LLC | 4.709 | -1,38 | 459 | 23,06 | ||||
| 2025-08-14 | 13F | Citadel Advisors Llc | Call | 0 | -100,00 | 0 | ||||
| 2025-08-14 | 13F | IHT Wealth Management, LLC | 3.379 | -7,07 | 330 | 15,85 | ||||
| 2025-08-05 | 13F | Bank of New York Mellon Corp | 0 | -100,00 | 0 | |||||
| 2025-07-16 | 13F | Townsend Asset Management Corp /nc/ /adv | 4.032 | 0,00 | 393 | 24,76 | ||||
| 2025-07-14 | 13F | E&G Advisors, LP | 14.815 | -38,26 | 1.445 | -23,07 | ||||
| 2025-08-14 | 13F | Coppell Advisory Solutions LLC | 0 | -100,00 | 0 | |||||
| 2025-08-12 | 13F | Global Retirement Partners, LLC | 522 | 0,38 | 51 | 8,70 | ||||
| 2025-08-12 | 13F | Proequities, Inc. | 0 | 0 | ||||||
| 2025-07-10 | 13F | Secure Asset Management, LLC | 2.844 | 0,00 | 277 | 24,77 | ||||
| 2025-07-24 | 13F | Capital Advisors, Ltd. LLC | 187 | 0,00 | 0 | |||||
| 2025-05-15 | 13F | Integrated Wealth Concepts LLC | 0 | -100,00 | 0 | |||||
| 2025-07-29 | 13F | Koshinski Asset Management, Inc. | 5.172 | 0,00 | 504 | 24,75 | ||||
| 2025-08-08 | 13F | Creative Planning | 18.509 | -8,41 | 1.805 | 14,17 |
Other Listings
| PE:SPHB |