Grundlæggende statistik
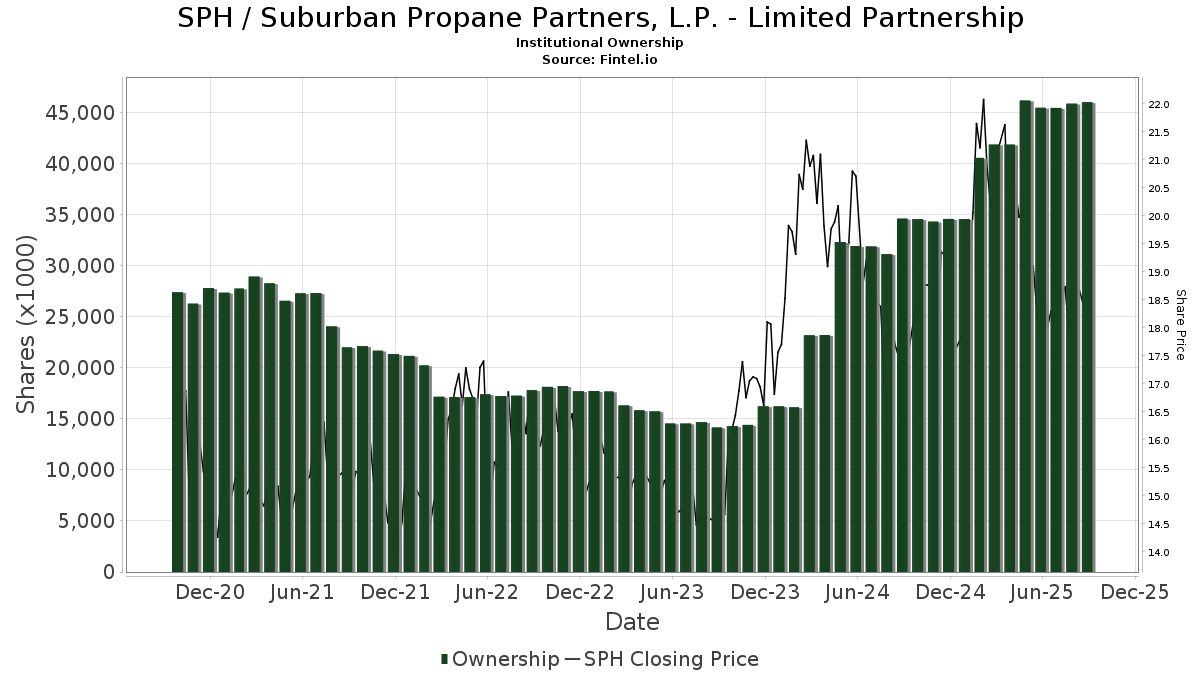
| Institutionelle aktier (lange) | 46.056.369 - 70,34% (ex 13D/G) - change of 0,69MM shares 1,53% MRQ |
| Institutionel værdi (lang) | $ 852.875 USD ($1000) |
Institutionelt ejerskab og aktionærer
Suburban Propane Partners, L.P. - Limited Partnership (US:SPH) har 158 institutionelle ejere og aktionærer, der har indsendt 13D/G- eller 13F-formularer til Securities Exchange Commission (SEC). Disse institutioner har i alt 46,056,369 aktier. Største aktionærer omfatter AMLP - ALERIAN MLP ETF, Alps Advisors Inc, MIRAE ASSET GLOBAL ETFS HOLDINGS Ltd., MLPA - Global X MLP ETF, Goldman Sachs Group Inc, Jpmorgan Chase & Co, GLPAX - Goldman Sachs MLP Energy Infrastructure Fund Class A Shares, Morgan Stanley, Bowen Hanes & Co Inc, and DIV - Global X SuperDividend U.S. ETF .
Suburban Propane Partners, L.P. - Limited Partnership (NYSE:SPH) institutionel ejerskabsstruktur viser aktuelle positioner i virksomheden efter institutioner og fonde, samt seneste ændringer i positionsstørrelse. Større aktionærer kan omfatte individuelle investorer, investeringsforeninger, hedgefonde eller institutioner. Skema 13D angiver, at investoren besidder (eller besidder) mere end 5 % af virksomheden og har til hensigt (eller har til hensigt at) aktivt at forfølge en ændring i forretningsstrategi. Skema 13G indikerer en passiv investering på over 5%.
The share price as of September 19, 2025 is 18,24 / share. Previously, on September 20, 2024, the share price was 17,67 / share. This represents an increase of 3,23% over that period.
Fondens stemningsscore
Fund Sentiment Score (fka Ownership Accumulation Score) finder de aktier, der bliver mest købt af fonde. Det er resultatet af en sofistikeret, multi-faktor kvantitativ model, der identificerer virksomheder med de højeste niveauer af institutionel akkumulering. Scoringsmodellen bruger en kombination af den samlede stigning i oplyste ejere, ændringerne i porteføljeallokeringer i disse ejere og andre målinger. Tallet går fra 0 til 100, hvor højere tal indikerer et højere niveau af akkumulering for sine jævnaldrende, og 50 er gennemsnittet.
Opdateringsfrekvens: Dagligt
Se Ownership Explorer, som giver en liste over højest rangerende virksomheder.
AI+ Ask Fintel’s AI assistant about Suburban Propane Partners, L.P. - Limited Partnership.
Thinking of good questions…
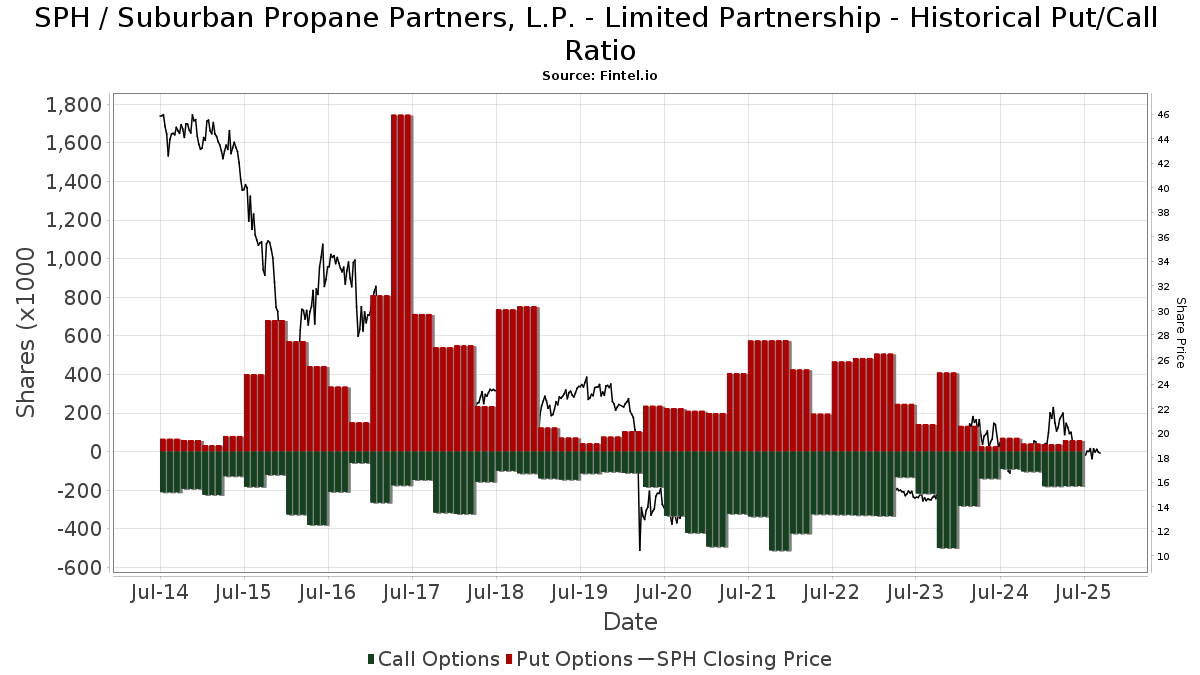
Institutionel Put/Call-forhold
Ud over at indberette standardaktie- og gældsudstedelser skal institutter med mere end 100 mill. aktiver under forvaltning også oplyse deres put- og call-optionsbeholdninger. Da salgsoptioner generelt indikerer negativ stemning, og købsoptioner indikerer positiv stemning, kan vi få en fornemmelse af den overordnede institutionelle stemning ved at plotte forholdet mellem put og kald. Diagrammet til højre viser det historiske put/call-forhold for dette instrument.
Brug af Put/Call Ratio som en indikator for investorernes stemning overvinder en af de vigtigste mangler ved at bruge totalt institutionelt ejerskab, som er, at en betydelig mængde af aktiver under forvaltning investeres passivt for at spore indekser. Passivt forvaltede fonde køber typisk ikke optioner, så indikatoren for put/call-forholdet følger mere nøje følelsen af aktivt forvaltede fonde.
13D/G-arkivering
Vi præsenterer 13D/G ansøgninger separat fra 13F ansøgninger på grund af den forskellige behandling af SEC. 13D/G-ansøgninger kan indgives af grupper af investorer (med én ledende), hvorimod 13F-ansøgninger ikke kan. Dette resulterer i situationer, hvor en investor kan indsende en 13D/G, der rapporterer én værdi for de samlede aktier (der repræsenterer alle de aktier, der ejes af investorgruppen), men derefter indsender en 13F, der rapporterer en anden værdi for de samlede aktier (der udelukkende repræsenterer deres egne) ejendomsret). Det betyder, at aktieejerskab af 13D/G-arkiver og 13F-arkiveringer ofte ikke er direkte sammenlignelige, så vi præsenterer dem separat.
Bemærk: Fra den 16. maj 2021 viser vi ikke længere ejere, der ikke har indsendt en 13D/G inden for det seneste år. Tidligere viste vi den fulde historie af 13D/G-arkiver. Generelt skal enheder, der er forpligtet til at indgive 13D/G-ansøgninger, indgive mindst årligt, før de indsender en afsluttende ansøgning. Dog forlader fonde nogle gange positioner uden at indsende en afsluttende ansøgning (dvs. de afvikler), så visning af den fulde historie resulterede nogle gange i forvirring om det nuværende ejerskab. For at undgå forvirring viser vi nu kun 'aktuelle' ejere - det vil sige - ejere, der har anmeldt inden for det seneste år.
Upgrade to unlock premium data.
| Fil dato | Form | Investor | Forrige Aktier |
Seneste Aktier |
Δ Aktier (Procent) |
Ejendomsret (Procent) |
Δ Ejerskab (Procent) |
|
|---|---|---|---|---|---|---|---|---|
| 2025-07-09 | ALPS ADVISORS INC | 14,142,616 | 13,893,278 | -1.76 | 21.39 | -2.46 | ||
| 2025-05-15 | Global X Management CO LLC | 3,344,151 | 4,249,304 | 27.07 | 6.54 | 25.29 |
13F og NPORT arkivering
Detaljer om 13F-arkivering er gratis. Detaljer om NP-ansøgninger kræver et premium-medlemskab. Grønne rækker angiver nye positioner. Røde rækker angiver lukkede positioner. Klik på linket ikon for at se den fulde transaktionshistorik.
Opgrader
for at låse premium-data op og eksportere til Excel ![]() .
.
| Fil dato | Kilde | Investor | Type | Gennemsnitlig pris (Øst) |
Aktier | Δ Aktier (%) |
Rapporteret Værdi ($1000) |
Δ Værdi (%) |
Port Alloc (%) |
|
|---|---|---|---|---|---|---|---|---|---|---|
| 2025-08-12 | 13F | LPL Financial LLC | 115.774 | 1,14 | 2.145 | -10,81 | ||||
| 2025-07-15 | 13F | FLP Wealth Management, LLC | 0 | -100,00 | 0 | |||||
| 2025-07-15 | 13F | Main Street Group, LTD | 0 | -100,00 | 0 | |||||
| 2025-07-29 | 13F | Stratos Wealth Partners, LTD. | 11.754 | 0,32 | 218 | -11,79 | ||||
| 2025-06-27 | NP | DIV - Global X SuperDividend U.S. ETF This fund is a listed as child fund of Mirae Asset Global Investments Co., Ltd. and if that institution has disclosed ownership in this security, then these positions will not be double counted when calculating total shares and total value | 605.723 | -4,30 | 12.096 | -9,56 | ||||
| 2025-08-05 | 13F | Levin Capital Strategies, L.p. | 156.498 | -0,07 | 2.900 | -11,88 | ||||
| 2025-08-15 | 13F | CI Private Wealth, LLC | 29.176 | 101,19 | 541 | 77,63 | ||||
| 2025-05-08 | 13F | Tandem Financial, LLC | 0 | -100,00 | 0 | -100,00 | ||||
| 2025-07-24 | NP | FSDIX - Fidelity Strategic Dividend & Income Fund This fund is a listed as child fund of Fmr Llc and if that institution has disclosed ownership in this security, then these positions will not be double counted when calculating total shares and total value | 27.630 | 3,44 | 521 | -6,14 | ||||
| 2025-07-08 | 13F | Nbc Securities, Inc. | 922 | 0,00 | 0 | |||||
| 2025-08-08 | 13F | Cetera Investment Advisers | 58.668 | -1,50 | 1.087 | -13,11 | ||||
| 2025-07-29 | 13F | Spirit Of America Management Corp/ny | 8.000 | 0,00 | 148 | -11,90 | ||||
| 2025-08-19 | 13F | State of Wyoming | 27.053 | 734,20 | 501 | 636,76 | ||||
| 2025-07-25 | 13F | Allspring Global Investments Holdings, LLC | 26.300 | 6,48 | 487 | -5,98 | ||||
| 2025-08-07 | 13F | CENTRAL TRUST Co | 1.275 | 0,00 | 24 | -11,54 | ||||
| 2025-08-15 | 13F | Tower Research Capital LLC (TRC) | 0 | -100,00 | 0 | |||||
| 2025-07-10 | 13F | Wealth Enhancement Advisory Services, Llc | 20.063 | 7,85 | 369 | -5,64 | ||||
| 2025-08-11 | 13F | October Effect Ltd | 22.500 | 417 | ||||||
| 2025-07-25 | 13F | LRI Investments, LLC | 11.270 | -9,73 | 209 | -20,61 | ||||
| 2025-08-14 | 13F | Wells Fargo & Company/mn | 68.607 | -27,90 | 1.271 | -36,42 | ||||
| 2025-08-11 | 13F | Principal Securities, Inc. | 8.221 | 152 | ||||||
| 2025-07-31 | 13F | Optimum Investment Advisors | 604 | 0,00 | 11 | -8,33 | ||||
| 2025-06-17 | NP | GSRAX - Goldman Sachs Rising Dividend Growth Fund Class A | 41.193 | -10,77 | 823 | -15,69 | ||||
| 2025-07-22 | NP | STIAX - Federated Strategic Income Fund Class A Shares | 3.816 | -81,98 | 72 | -83,83 | ||||
| 2025-07-24 | 13F | Us Bancorp \de\ | 500 | 0,00 | 9 | -10,00 | ||||
| 2025-07-10 | 13F | Oliver Lagore Vanvalin Investment Group | 1.951 | 0,00 | 41 | 21,21 | ||||
| 2025-07-10 | 13F | Secure Asset Management, LLC | 0 | -100,00 | 0 | -100,00 | ||||
| 2025-07-18 | 13F | Trust Co Of Vermont | 322 | 0,00 | 6 | -16,67 | ||||
| 2025-08-14 | 13F | Fmr Llc | 63.330 | 137,10 | 1.174 | 109,09 | ||||
| 2025-08-14 | 13F | UBS Group AG | 362.914 | -6,51 | 6.725 | -17,55 | ||||
| 2025-08-14 | 13F | Group One Trading, L.p. | Call | 18.600 | 33,81 | 345 | 17,81 | |||
| 2025-08-14 | 13F | Group One Trading, L.p. | Put | 500 | -54,55 | 9 | -60,87 | |||
| 2025-08-25 | 13F/A | Neuberger Berman Group LLC | 14.500 | 0,00 | 269 | -11,84 | ||||
| 2025-08-14 | 13F | Raymond James Financial Inc | 193.387 | -2,00 | 3.583 | -13,58 | ||||
| 2025-08-13 | 13F | Federated Hermes, Inc. | 71.756 | -34,20 | 1.330 | -41,99 | ||||
| 2025-07-22 | NP | FHYTX - FEDERATED HIGH YIELD TRUST Service Shares | 49.341 | -22,45 | 930 | -29,62 | ||||
| 2025-08-08 | 13F | Avantax Advisory Services, Inc. | 0 | -100,00 | 0 | |||||
| 2025-05-12 | 13F | C2P Capital Advisory Group, LLC d.b.a. Prosperity Capital Advisors | 0 | -100,00 | 0 | -100,00 | ||||
| 2025-08-26 | NP | GOP - Unusual Whales Subversive Republican Trading ETF | 13.376 | -8,57 | 248 | -19,54 | ||||
| 2025-08-12 | 13F | BlackRock, Inc. | 0 | -100,00 | 0 | |||||
| 2025-08-14 | 13F | Jane Street Group, Llc | 122.910 | 2.278 | ||||||
| 2025-08-14 | 13F | Toroso Investments, LLC | 13.376 | -7,25 | 248 | -18,21 | ||||
| 2025-08-12 | 13F | Virtu Financial LLC | 19.315 | 0 | ||||||
| 2025-08-08 | 13F | Creative Planning | 31.421 | 0,91 | 582 | -11,01 | ||||
| 2025-05-19 | 13F | Smith Asset Management Co., LLC | 47.358 | -0,36 | 995 | 21,66 | ||||
| 2025-08-14 | 13F | Aster Capital Management (DIFC) Ltd | 0 | -100,00 | 0 | |||||
| 2025-04-17 | 13F | Copia Wealth Management | 0 | -100,00 | 0 | |||||
| 2025-08-14 | 13F | Van Eck Associates Corp | 0 | -100,00 | 0 | |||||
| 2025-08-14 | 13F | Vivaldi Capital Management, LLC | 0 | -100,00 | 0 | |||||
| 2025-08-13 | 13F | Guggenheim Capital Llc | 10.461 | -0,50 | 194 | -12,27 | ||||
| 2025-08-01 | 13F | Bessemer Group Inc | 0 | -100,00 | 0 | |||||
| 2025-08-14 | 13F | Citadel Advisors Llc | Call | 114.700 | 5,62 | 2.125 | -6,84 | |||
| 2025-08-06 | 13F | Rialto Wealth Management, LLC | 60 | 0,00 | 1 | 0,00 | ||||
| 2025-08-14 | 13F | Citadel Advisors Llc | Put | 24.300 | 17,39 | 450 | 3,69 | |||
| 2025-08-12 | 13F | Wood Tarver Financial Group, LLC | 7.000 | 0,00 | 0 | -100,00 | ||||
| 2025-08-14 | 13F | Gould Capital, LLC | 3.685 | 1,66 | 68 | -10,53 | ||||
| 2025-07-25 | 13F | Community Bank, N.A. | 660 | 0,00 | 12 | -7,69 | ||||
| 2025-08-14 | 13F | Hrt Financial Lp | 54.239 | 1 | ||||||
| 2025-04-29 | 13F | Hm Payson & Co | 2.200 | -81,97 | 46 | -77,99 | ||||
| 2025-08-11 | 13F | Alps Advisors Inc | 13.893.278 | -1,76 | 257.442 | -13,36 | ||||
| 2025-08-01 | 13F | MorganRosel Wealth Management, LLC | 115 | 0,00 | 2 | 0,00 | ||||
| 2025-04-29 | 13F | Lee Danner & Bass Inc | 0 | -100,00 | 0 | -100,00 | ||||
| 2025-08-05 | 13F | Simplex Trading, Llc | Put | 7.900 | -7,06 | 0 | ||||
| 2025-08-05 | 13F | Simplex Trading, Llc | Call | 15.100 | -19,25 | 0 | ||||
| 2025-08-11 | 13F | Delta Asset Management Llc/tn | 61 | 0,00 | 1 | 0,00 | ||||
| 2025-04-23 | 13F | Mascagni Wealth Management, Inc. | 0 | -100,00 | 0 | |||||
| 2025-08-15 | 13F | Morgan Stanley | 1.069.199 | 14,46 | 19.812 | 0,95 | ||||
| 2025-08-05 | 13F | Huntington National Bank | 201 | 0,00 | 4 | -25,00 | ||||
| 2025-07-24 | 13F | Costello Asset Management, INC | 941 | 1,62 | 17 | -10,53 | ||||
| 2025-08-08 | 13F | WASHINGTON TRUST Co | 0 | -100,00 | 0 | |||||
| 2025-05-14 | 13F | Rockefeller Capital Management L.P. | 0 | -100,00 | 0 | |||||
| 2025-07-31 | 13F | Oppenheimer & Co Inc | 0 | -100,00 | 0 | |||||
| 2025-07-23 | 13F | Nbt Bank N A /ny | 300 | 0,00 | 6 | -16,67 | ||||
| 2025-08-13 | 13F | Invesco Ltd. | 46.545 | 8,08 | 862 | -4,65 | ||||
| 2025-08-14 | 13F | Stifel Financial Corp | 27.043 | 36,22 | 501 | 20,14 | ||||
| 2025-07-16 | 13F | Strategic Investment Solutions, Inc. /IL | 154 | 1,32 | 3 | -33,33 | ||||
| 2025-04-22 | 13F | Duncker Streett & Co Inc | 0 | -100,00 | 0 | |||||
| 2025-07-25 | 13F | Concord Wealth Partners | 233 | 0,00 | 4 | 0,00 | ||||
| 2025-08-04 | 13F | Spire Wealth Management | 2.306 | 1,72 | 43 | -10,64 | ||||
| 2025-08-15 | 13F | Kestra Advisory Services, LLC | 15.749 | 20,15 | 292 | 5,82 | ||||
| 2025-08-13 | 13F | Colonial Trust Co / SC | 1.000 | 0,00 | 19 | -14,29 | ||||
| 2025-07-10 | 13F | Legacy Financial Strategies, LLC | 14.000 | 0,00 | 259 | -11,90 | ||||
| 2025-08-01 | 13F | Gwn Securities Inc. | 0 | -100,00 | 0 | |||||
| 2025-08-14 | 13F | Susquehanna International Group, Llp | Put | 27.500 | 177,78 | 510 | 145,89 | |||
| 2025-08-14 | 13F | Susquehanna International Group, Llp | 14.830 | -31,25 | 275 | -39,51 | ||||
| 2025-08-14 | 13F | Susquehanna International Group, Llp | Call | 29.200 | -20,87 | 541 | -30,19 | |||
| 2025-08-14 | 13F | Wealth Advisors of Tampa Bay, LLC | 13.455 | 0,00 | 249 | -11,70 | ||||
| 2025-08-07 | 13F | Kestra Private Wealth Services, Llc | 13.033 | 25,92 | 242 | 11,06 | ||||
| 2025-08-18 | 13F | Front Row Advisors LLC | 481 | 9 | ||||||
| 2025-08-07 | 13F | Allworth Financial LP | 11.514 | 44,70 | 213 | 29,88 | ||||
| 2025-08-14 | 13F | MIRAE ASSET GLOBAL ETFS HOLDINGS Ltd. | 3.985.447 | -6,21 | 73.850 | -17,28 | ||||
| 2025-08-18 | 13F | Geneos Wealth Management Inc. | 2.650 | 0,00 | 49 | -10,91 | ||||
| 2025-08-14 | 13F | Moneta Group Investment Advisors Llc | 63.508 | 1,10 | 1.177 | -10,84 | ||||
| 2025-04-24 | 13F | Wingate Wealth Advisors, Inc. | 0 | -100,00 | 0 | -100,00 | ||||
| 2025-08-12 | 13F | Country Trust Bank | 0 | -100,00 | 0 | |||||
| 2025-08-14 | 13F | Goldman Sachs Group Inc | 1.415.231 | 3,26 | 26.224 | -8,93 | ||||
| 2025-07-31 | 13F | Cambridge Investment Research Advisors, Inc. | 58.847 | -2,35 | 1 | 0,00 | ||||
| 2025-08-14 | 13F | Bank Of America Corp /de/ | 98.158 | 65,75 | 1.819 | 46,14 | ||||
| 2025-07-30 | 13F | Greenup Street Wealth Management Llc | 21.706 | 23,99 | 402 | 9,54 | ||||
| 2025-08-08 | 13F | Pnc Financial Services Group, Inc. | 45.354 | 1,59 | 840 | -10,45 | ||||
| 2025-08-11 | 13F | Citigroup Inc | 3.000 | 56 | ||||||
| 2025-07-21 | 13F | F&V Capital Management, LLC | 0 | -100,00 | 0 | |||||
| 2025-08-13 | 13F | Aristides Capital LLC | 20.294 | -27,78 | 376 | -36,27 | ||||
| 2025-08-25 | NP | ICTUX - ICON UTILITIES AND INCOME FUND Institutional Class | 24.214 | -29,21 | 449 | -37,60 | ||||
| 2025-05-14 | 13F | Bnp Paribas Arbitrage, Sa | 0 | -100,00 | 0 | |||||
| 2025-07-01 | 13F | Harbor Investment Advisory, Llc | 130 | 1,56 | 2 | 0,00 | ||||
| 2025-08-12 | 13F | Bowen Hanes & Co Inc | 816.000 | 0,00 | 15.120 | -11,81 | ||||
| 2025-05-02 | 13F | Capital A Wealth Management, LLC | 0 | -100,00 | 0 | -100,00 | ||||
| 2025-08-12 | 13F | Steward Partners Investment Advisory, Llc | 7.011 | -0,85 | 130 | -12,84 | ||||
| 2025-08-12 | 13F | Proequities, Inc. | Put | 0 | 0 | |||||
| 2025-08-12 | 13F | Proequities, Inc. | Call | 0 | 0 | |||||
| 2025-08-14 | 13F | Blackstone Group Inc | 414.171 | 0,51 | 7.675 | -11,35 | ||||
| 2025-08-12 | 13F | Proequities, Inc. | 0 | 0 | ||||||
| 2025-08-12 | 13F | Jpmorgan Chase & Co | 1.266.303 | 18,72 | 23.465 | 4,71 | ||||
| 2025-08-14 | 13F/A | Barclays Plc | 4.228 | 37,05 | 0 | |||||
| 2025-08-13 | 13F | Summit Financial, LLC | 54.049 | 0,00 | 1.002 | -11,81 | ||||
| 2025-08-14 | 13F | AllSquare Wealth Management LLC | 0 | -100,00 | 0 | |||||
| 2025-07-30 | NP | AMLP - ALERIAN MLP ETF | 14.395.521 | 7,90 | 271.212 | -2,08 | ||||
| 2025-05-27 | NP | RNEW - VanEck Green Infrastructure ETF | 653 | 0,15 | 14 | 18,18 | ||||
| 2025-08-14 | 13F | Evercore Wealth Management, LLC | 45.438 | 0,00 | 842 | -11,84 | ||||
| 2025-08-26 | NP | GAFCX - Virtus AlphaSimplex Global Alternatives Fund Class C | 12.873 | 12,38 | 239 | -0,83 | ||||
| 2025-06-25 | NP | AMZA - InfraCap MLP ETF | 43.224 | 1,32 | 863 | -4,22 | ||||
| 2025-07-18 | 13F | Founders Capital Management | 1.200 | 0,00 | 22 | -12,00 | ||||
| 2025-08-11 | 13F | Private Advisor Group, LLC | 64.326 | 6,05 | 1.192 | -6,51 | ||||
| 2025-08-12 | 13F | Global Retirement Partners, LLC | 400 | 33,33 | 7 | 40,00 | ||||
| 2025-08-14 | 13F | Wiley Bros.-aintree Capital, Llc | 11.523 | 0,69 | 214 | -12,35 | ||||
| 2025-07-08 | 13F | Parallel Advisors, LLC | 1.677 | 0,00 | 31 | -11,43 | ||||
| 2025-07-29 | 13F | Oxbow Advisors, LLC | 11.263 | 0,00 | 209 | -11,86 | ||||
| 2025-08-07 | 13F | Montag A & Associates Inc | 166 | 0,00 | 3 | 0,00 | ||||
| 2025-07-24 | 13F | Wealthstar Advisors, Llc | 36.771 | 7,72 | 681 | -5,02 | ||||
| 2025-07-11 | 13F | Farther Finance Advisors, LLC | 1.363 | 0,00 | 25 | -13,79 | ||||
| 2025-08-15 | 13F | Resources Management Corp /ct/ /adv | 930 | 0,00 | 0 | |||||
| 2025-07-07 | 13F | Fractal Investments LLC | 214.864 | 0,00 | 3.981 | -11,81 | ||||
| 2025-07-25 | 13F | Cwm, Llc | 510 | 0,00 | 0 | |||||
| 2025-08-06 | 13F | Commonwealth Equity Services, Llc | 200.747 | -2,78 | 4 | -25,00 | ||||
| 2025-08-07 | 13F | Commerce Bank | 11.871 | 0,00 | 220 | -12,05 | ||||
| 2025-08-14 | 13F | Infrastructure Capital Advisors, Llc | 43.224 | 17,81 | 801 | -89,12 | ||||
| 2025-08-14 | 13F | Mariner, LLC | 42.272 | 4,60 | 783 | -7,77 | ||||
| 2025-07-30 | NP | MLPA - Global X MLP ETF This fund is a listed as child fund of Mirae Asset Global Investments Co., Ltd. and if that institution has disclosed ownership in this security, then these positions will not be double counted when calculating total shares and total value | 3.340.811 | -7,86 | 62.941 | -16,39 | ||||
| 2025-08-08 | 13F | Compass Wealth Management LLC | 0 | -100,00 | 0 | |||||
| 2025-07-17 | 13F | Sound Income Strategies, LLC | 7.061 | 0,00 | 131 | -12,16 | ||||
| 2025-06-30 | NP | CVY - Invesco Zacks Multi-Asset Income ETF This fund is a listed as child fund of Invesco Ltd. and if that institution has disclosed ownership in this security, then these positions will not be double counted when calculating total shares and total value | 36.600 | -23,77 | 731 | -28,01 | ||||
| 2025-07-15 | 13F | Fifth Third Bancorp | 121 | 0,00 | 2 | 0,00 | ||||
| 2025-07-17 | 13F | Beacon Capital Management, LLC | 59 | 1,72 | 1 | 0,00 | ||||
| 2025-07-29 | 13F | Mb, Levis & Associates, Llc | 211 | 1,44 | 4 | -25,00 | ||||
| 2025-07-25 | 13F | We Are One Seven, LLC | 18.651 | 1,63 | 346 | -10,39 | ||||
| 2025-07-16 | 13F | Signature Resources Capital Management, LLC | 482 | 0,00 | 9 | -20,00 | ||||
| 2025-07-23 | 13F | PARK CIRCLE Co | 33.000 | 0,00 | 611 | -11,83 | ||||
| 2025-07-24 | 13F | IFP Advisors, Inc | 1.000 | 0,00 | 19 | -14,29 | ||||
| 2025-08-14 | 13F | Federation des caisses Desjardins du Quebec | 700 | 0,00 | 13 | -14,29 | ||||
| 2025-08-13 | 13F | Transce3nd, LLC | 0 | -100,00 | 0 | |||||
| 2025-08-14 | 13F | GWM Advisors LLC | 4.836 | 0,62 | 90 | -11,00 | ||||
| 2025-07-30 | 13F | Cullen/frost Bankers, Inc. | 0 | -100,00 | 0 | |||||
| 2025-07-30 | 13F | Princeton Global Asset Management LLC | 4.716 | 0,15 | 87 | -11,22 | ||||
| 2025-08-14 | 13F | Sunbelt Securities, Inc. | 300 | 0,00 | 5 | -16,67 | ||||
| 2025-04-21 | 13F | Nelson, Van Denburg & Campbell Wealth Management Group, LLC | 0 | -100,00 | 0 | |||||
| 2025-07-15 | 13F | Permanent Capital Management, LP | 12.614 | 234 | ||||||
| 2025-07-30 | 13F | Whittier Trust Co Of Nevada Inc | 2.319 | 0,00 | 43 | -12,50 | ||||
| 2025-04-14 | 13F | Cetera Trust Company, N.A | 0 | -100,00 | 0 | -100,00 | ||||
| 2025-07-30 | NP | SOAEX - Spirit of America Energy Fund Class A | 8.000 | 0,00 | 151 | -9,64 | ||||
| 2025-08-13 | 13F | Northwestern Mutual Wealth Management Co | 607 | -64,02 | 11 | -68,57 | ||||
| 2025-07-07 | 13F | Nova Wealth Management, Inc. | 60 | 0,00 | 1 | 0,00 | ||||
| 2025-08-14 | 13F | Royal Bank Of Canada | 22.646 | 1,62 | 420 | -10,45 | ||||
| 2025-07-09 | 13F | WealthCare Investment Partners, LLC | 12.011 | 1,65 | 221 | -7,17 | ||||
| 2025-08-14 | 13F | Safeguard Investment Advisory Group, LLC | 10.890 | 11,17 | 202 | -1,95 | ||||
| 2025-07-29 | NP | MLPEX - Invesco Oppenheimer SteelPath MLP Select 40 Fund Class C | 5.962 | 0,00 | 112 | -8,94 | ||||
| 2025-07-16 | 13F | Signaturefd, Llc | 0 | -100,00 | 0 | |||||
| 2025-08-15 | 13F | Captrust Financial Advisors | 16.414 | -8,85 | 304 | -19,58 | ||||
| 2025-07-10 | 13F | Farmers & Merchants Trust Co of Chambersburg PA | 5.000 | 0,00 | 0 | |||||
| 2025-08-12 | 13F | CIBC Private Wealth Group, LLC | 3.698 | 0,00 | 69 | -4,23 | ||||
| 2025-08-12 | 13F | Bokf, Na | 5.883 | 0,00 | 109 | -11,38 | ||||
| 2025-08-12 | 13F | MAI Capital Management | 4.823 | 0,00 | 89 | -11,88 | ||||
| 2025-07-22 | 13F | Aspire Private Capital, LLC | 15.106 | 0,58 | 280 | -11,43 | ||||
| 2025-08-13 | 13F | Jones Financial Companies Lllp | 8.786 | 23,82 | 164 | 8,67 | ||||
| 2025-08-12 | 13F | Archer Investment Corp | 11.150 | 0,00 | 207 | -11,97 | ||||
| 2025-08-12 | 13F | Pathstone Holdings, LLC | 51.854 | 0,00 | 961 | -11,85 | ||||
| 2025-08-06 | 13F | Ethos Financial Group, LLC | 21.833 | 6,56 | 405 | -6,05 | ||||
| 2025-07-24 | 13F | Trust Co Of Toledo Na /oh/ | 5.556 | 103 | ||||||
| 2025-08-14 | 13F | Glen Eagle Advisors, LLC | 132 | 0,00 | 2 | 0,00 | ||||
| 2025-08-19 | 13F | Newbridge Financial Services Group, Inc. | 32 | 1 | ||||||
| 2025-06-26 | NP | GYLD - Arrow Dow Jones Global Yield ETF | 6.390 | -19,04 | 128 | -23,49 | ||||
| 2025-08-13 | 13F | Lido Advisors, LLC | 169.923 | 0,05 | 3.149 | -11,77 | ||||
| 2025-07-16 | 13F | PFS Partners, LLC | 1.118 | 0,00 | 21 | -13,04 | ||||
| 2025-08-04 | 13F | Assetmark, Inc | 300 | 100,00 | 6 | 66,67 | ||||
| 2025-07-29 | 13F | Koshinski Asset Management, Inc. | 11.000 | 0,00 | 204 | -12,12 | ||||
| 2025-08-05 | 13F | Fourth Dimension Wealth, LLC | 27 | 0,00 | 0 | |||||
| 2025-08-06 | 13F | Ing Groep Nv | 79.000 | 1.464 | ||||||
| 2025-09-04 | 13F/A | Advisor Group Holdings, Inc. | 61.748 | 88,10 | 1.144 | 66,04 | ||||
| 2025-08-13 | 13F | Icon Advisers Inc/co | 24.214 | -29,21 | 449 | -37,60 | ||||
| 2025-05-08 | 13F | Hopwood Financial Services, Inc. | 0 | -100,00 | 0 | -100,00 | ||||
| 2025-07-07 | 13F | Thurston, Springer, Miller, Herd & Titak, Inc. | 500 | 0,00 | 9 | -10,00 | ||||
| 2025-05-13 | 13F | Clearbridge Investments, LLC | 0 | -100,00 | 0 | |||||
| 2025-07-17 | 13F | Independence Bank of Kentucky | 3.000 | 0,00 | 56 | -12,70 | ||||
| 2025-08-08 | 13F | Cherokee Insurance Co | 16.000 | 0,00 | 296 | -11,90 | ||||
| 2025-07-17 | 13F | Janney Montgomery Scott LLC | 55.404 | 9,77 | 1 | 0,00 | ||||
| 2025-08-01 | 13F | Vision Financial Markets Llc | 2.000 | 0,00 | 37 | -11,90 | ||||
| 2025-08-11 | 13F | HighTower Advisors, LLC | 13.769 | 31,61 | 255 | 16,44 | ||||
| 2025-07-21 | NP | GLPAX - Goldman Sachs MLP Energy Infrastructure Fund Class A Shares | 1.098.253 | -4,10 | 20.691 | -12,97 | ||||
| 2025-06-30 | NP | Two Roads Shared Trust - Conductor Global Equity Value ETF | 62.522 | 42,10 | 1.249 | 34,34 |