Grundlæggende statistik
| Institutionelle aktier (lange) | 129.534.044 - 87,97% (ex 13D/G) - change of 53,50MM shares 70,36% MRQ |
| Institutionel værdi (lang) | $ 1.208.363 USD ($1000) |
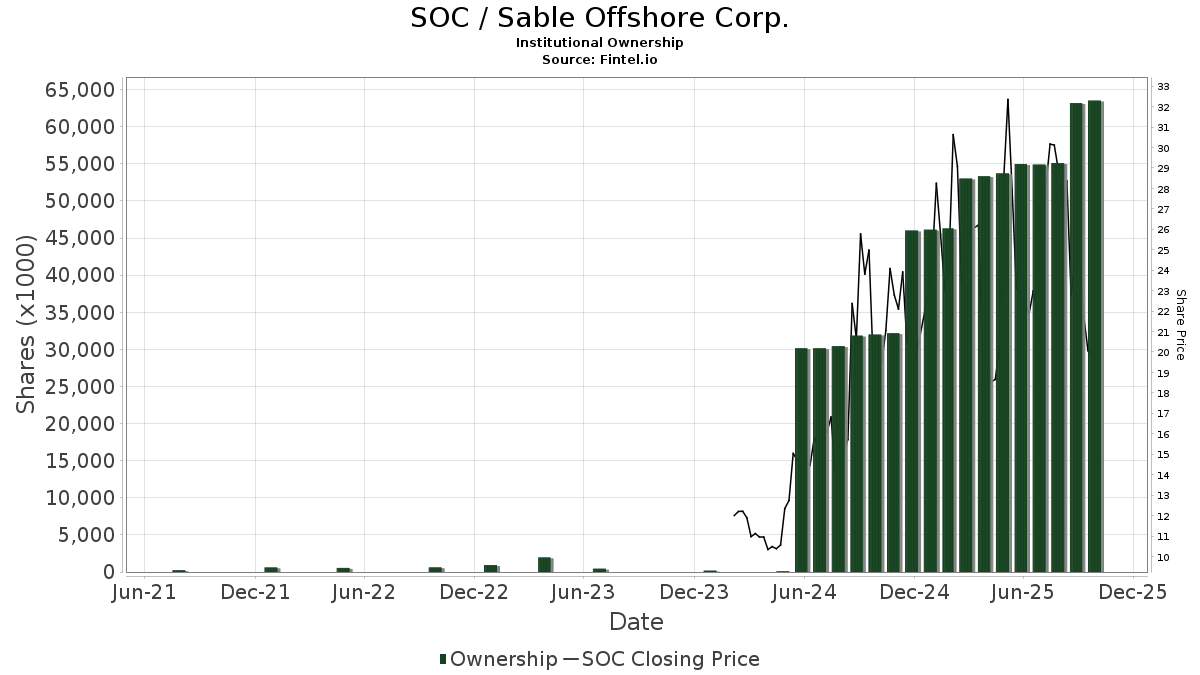
Institutionelt ejerskab og aktionærer
Sable Offshore Corp. (US:SOC) har 236 institutionelle ejere og aktionærer, der har indsendt 13D/G- eller 13F-formularer til Securities Exchange Commission (SEC). Disse institutioner har i alt 129,534,044 aktier. Største aktionærer omfatter Pilgrim Global Advisors LLC, Encompass Capital Advisors LLC, Capital International Investors, Alyeska Investment Group, L.P., FourWorld Capital Management LLC, Vanguard Group Inc, BlackRock, Inc., Morgan Stanley, State Street Corp, and Millennium Management Llc .
Sable Offshore Corp. (NYSE:SOC) institutionel ejerskabsstruktur viser aktuelle positioner i virksomheden efter institutioner og fonde, samt seneste ændringer i positionsstørrelse. Større aktionærer kan omfatte individuelle investorer, investeringsforeninger, hedgefonde eller institutioner. Skema 13D angiver, at investoren besidder (eller besidder) mere end 5 % af virksomheden og har til hensigt (eller har til hensigt at) aktivt at forfølge en ændring i forretningsstrategi. Skema 13G indikerer en passiv investering på over 5%.
The share price as of May 1, 2026 is 14,10 / share. Previously, on May 5, 2025, the share price was 19,78 / share. This represents a decline of 28,72% over that period.
Fondens stemningsscore
Fund Sentiment Score (fka Ownership Accumulation Score) finder de aktier, der bliver mest købt af fonde. Det er resultatet af en sofistikeret, multi-faktor kvantitativ model, der identificerer virksomheder med de højeste niveauer af institutionel akkumulering. Scoringsmodellen bruger en kombination af den samlede stigning i oplyste ejere, ændringerne i porteføljeallokeringer i disse ejere og andre målinger. Tallet går fra 0 til 100, hvor højere tal indikerer et højere niveau af akkumulering for sine jævnaldrende, og 50 er gennemsnittet.
Opdateringsfrekvens: Dagligt
Se Ownership Explorer, som giver en liste over højest rangerende virksomheder.
AI+ Ask Fintel’s AI assistant about Sable Offshore Corp..
Select a question to share a public post with an AI-crafted answer.
Thinking of good questions…
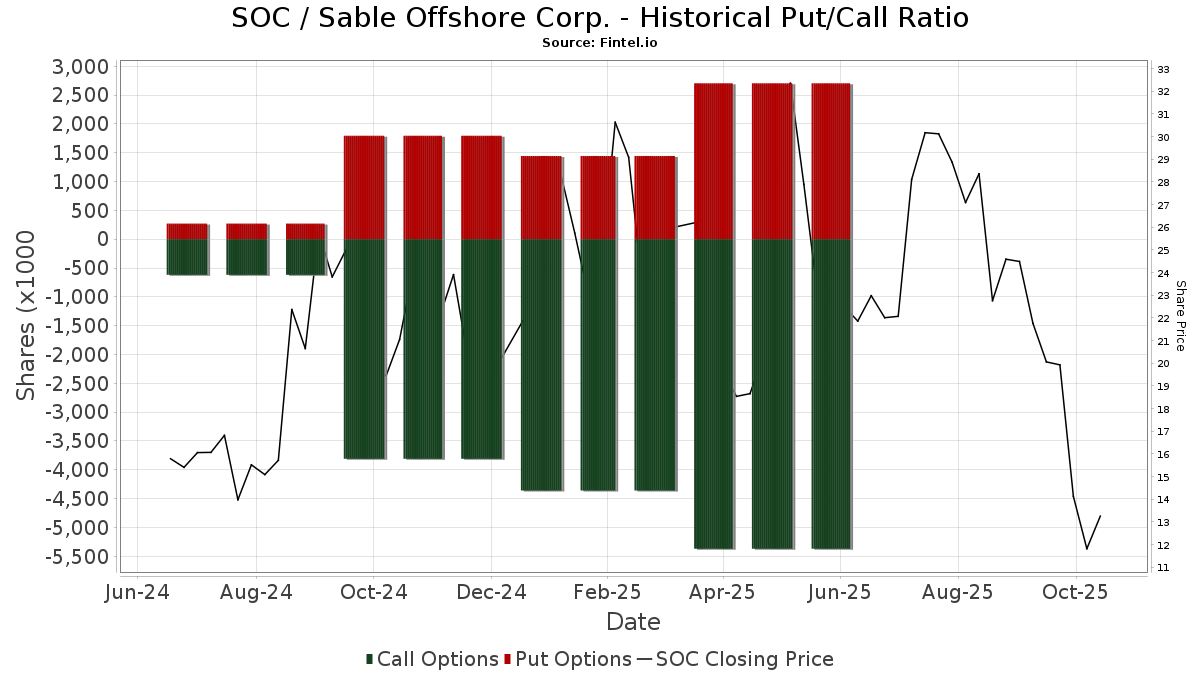
Institutionel Put/Call-forhold
Ud over at indberette standardaktie- og gældsudstedelser skal institutter med mere end 100 mill. aktiver under forvaltning også oplyse deres put- og call-optionsbeholdninger. Da salgsoptioner generelt indikerer negativ stemning, og købsoptioner indikerer positiv stemning, kan vi få en fornemmelse af den overordnede institutionelle stemning ved at plotte forholdet mellem put og kald. Diagrammet til højre viser det historiske put/call-forhold for dette instrument.
Brug af Put/Call Ratio som en indikator for investorernes stemning overvinder en af de vigtigste mangler ved at bruge totalt institutionelt ejerskab, som er, at en betydelig mængde af aktiver under forvaltning investeres passivt for at spore indekser. Passivt forvaltede fonde køber typisk ikke optioner, så indikatoren for put/call-forholdet følger mere nøje følelsen af aktivt forvaltede fonde.
13D/G-arkivering
Vi præsenterer 13D/G ansøgninger separat fra 13F ansøgninger på grund af den forskellige behandling af SEC. 13D/G-ansøgninger kan indgives af grupper af investorer (med én ledende), hvorimod 13F-ansøgninger ikke kan. Dette resulterer i situationer, hvor en investor kan indsende en 13D/G, der rapporterer én værdi for de samlede aktier (der repræsenterer alle de aktier, der ejes af investorgruppen), men derefter indsender en 13F, der rapporterer en anden værdi for de samlede aktier (der udelukkende repræsenterer deres egne) ejendomsret). Det betyder, at aktieejerskab af 13D/G-arkiver og 13F-arkiveringer ofte ikke er direkte sammenlignelige, så vi præsenterer dem separat.
Bemærk: Fra den 16. maj 2021 viser vi ikke længere ejere, der ikke har indsendt en 13D/G inden for det seneste år. Tidligere viste vi den fulde historie af 13D/G-arkiver. Generelt skal enheder, der er forpligtet til at indgive 13D/G-ansøgninger, indgive mindst årligt, før de indsender en afsluttende ansøgning. Dog forlader fonde nogle gange positioner uden at indsende en afsluttende ansøgning (dvs. de afvikler), så visning af den fulde historie resulterede nogle gange i forvirring om det nuværende ejerskab. For at undgå forvirring viser vi nu kun 'aktuelle' ejere - det vil sige - ejere, der har anmeldt inden for det seneste år.
Upgrade to unlock premium data.
| Fil dato | Form | Investor | Forrige Aktier |
Seneste Aktier |
Δ Aktier (Procent) |
Ejendomsret (Procent) |
Δ Ejerskab (Procent) |
|
|---|---|---|---|---|---|---|---|---|
| 2026-02-19 | FourWorld Capital Management LLC | 8,412,108 | 5.80 | |||||
| 2026-02-17 | Alyeska Investment Group, L.P. | 11,091,773 | 7.65 | |||||
| 2026-02-17 | Pilgrim Global ICAV | 10,406,988 | 18,693,451 | 79.62 | 12.90 | 22.86 | ||
| 2026-02-13 | Capital International Investors | 11,592,407 | 8.00 | |||||
| 2026-02-13 | SUSQUEHANNA SECURITIES, LLC | 7,550,839 | 3,283,720 | -56.51 | 2.30 | -69.74 | ||
| 2026-02-03 | CONTINENTAL GENERAL INSURANCE CO | 10,000,000 | 6.90 | |||||
| 2026-01-30 | VANGUARD GROUP INC | 7,557,670 | 5.21 | |||||
| 2026-01-21 | BlackRock, Inc. | 5,005,409 | 6,661,355 | 33.08 | 4.60 | -8.00 | ||
| 2025-11-14 | Encompass Capital Advisors LLC | 5,206,191 | 8,397,316 | 61.29 | 8.44 | 61.07 | ||
| 2025-10-07 | FMR LLC | 5,822,048 | 516,534 | -91.13 | 0.50 | -91.53 |
13F og NPORT arkivering
Detaljer om 13F-arkivering er gratis. Detaljer om NP-ansøgninger kræver et premium-medlemskab. Grønne rækker angiver nye positioner. Røde rækker angiver lukkede positioner. Klik på linket ikon for at se den fulde transaktionshistorik.
Opgrader
for at låse premium-data op og eksportere til Excel ![]() .
.
| Fil dato | Kilde | Investor | Type | Gennemsnitlig pris (Øst) |
Aktier | Δ Aktier (%) |
Rapporteret Værdi ($1000) |
Δ Værdi (%) |
Port Alloc (%) |
|
|---|---|---|---|---|---|---|---|---|---|---|
| 2026-02-17 | 13F | Bank Of America Corp /de/ | Put | 0 | -100,00 | 0 | -100,00 | |||
| 2026-02-12 | 13F | CIBC Private Wealth Group, LLC | 1.000 | 9 | ||||||
| 2026-01-30 | 13F | Levin Capital Strategies, L.p. | Call | 29.500 | 266 | |||||
| 2026-02-11 | 13F | Capital International Investors | 11.592.407 | 542,57 | 104.564 | 231,97 | ||||
| 2026-03-20 | 13F | Purpose Unlimited Inc. | 119.558 | 1.078 | ||||||
| 2026-02-04 | 13F | Blackhawk Capital Partners LLC. | 0 | -100,00 | 0 | -100,00 | ||||
| 2026-02-13 | 13F | Quarry LP | Put | 0 | -100,00 | 0 | -100,00 | |||
| 2026-02-17 | 13F | Russell Investments Group, Ltd. | 6.545 | -86,25 | 59 | -92,90 | ||||
| 2026-02-10 | 13F | Easterly Investment Partners Llc | 232.000 | 2.093 | ||||||
| 2026-02-17 | 13F | Optiver Holding B.V. | 0 | -100,00 | 0 | -100,00 | ||||
| 2026-02-18 | 13F/A | Empowered Funds, LLC | 17.907 | -16,63 | 162 | -57,07 | ||||
| 2026-02-11 | 13F | United Financial Planning Group LLC | 50 | 0 | ||||||
| 2026-02-17 | 13F | Jump Financial, LLC | 276.717 | 261,72 | 2.496 | 86,89 | ||||
| 2026-02-17 | 13F | Raymond James Financial Inc | 59.015 | -27,11 | 532 | -62,35 | ||||
| 2026-04-30 | 13F | Csenge Advisory Group | 16.939 | 280 | ||||||
| 2026-02-06 | 13F | HighTower Advisors, LLC | 14.879 | -44,61 | 134 | -71,43 | ||||
| 2026-02-13 | 13F | Wells Fargo & Company/mn | 83.408 | -48,49 | 752 | -73,40 | ||||
| 2026-02-13 | 13F | Smartleaf Asset Management LLC | 147 | 425,00 | 1 | |||||
| 2026-02-11 | 13F | Deutsche Bank Ag\ | 70.660 | 39,93 | 637 | -27,70 | ||||
| 2026-02-13 | 13F | Thomist Capital Management, LP | 1.818.181 | 21.327 | ||||||
| 2026-02-17 | 13F | Qube Research & Technologies Ltd | Put | 0 | -100,00 | 0 | -100,00 | |||
| 2026-02-17 | 13F | Qube Research & Technologies Ltd | 0 | -100,00 | 0 | -100,00 | ||||
| 2026-02-17 | 13F | Citadel Advisors Llc | 2.340.322 | 241,00 | 21.110 | 76,16 | ||||
| 2026-02-05 | 13F | Gamco Investors, Inc. Et Al | 20.481 | 30,84 | 185 | -32,60 | ||||
| 2026-02-17 | 13F | Citadel Advisors Llc | Put | 1.183.100 | 122,81 | 10.672 | 15,10 | |||
| 2026-02-17 | 13F | Citadel Advisors Llc | Call | 1.410.200 | -2,37 | 12.720 | -49,56 | |||
| 2026-02-17 | 13F | Creative Planning | 23.064 | 208 | ||||||
| 2025-11-14 | 13F | Peak6 Llc | Call | 0 | -100,00 | 0 | -100,00 | |||
| 2026-04-07 | 13F | Signaturefd, Llc | 688 | 56,72 | 11 | 266,67 | ||||
| 2026-02-06 | 13F/A | Rathbone Brothers plc | 11.670 | 105 | ||||||
| 2026-02-04 | 13F | Ameritas Advisory Services, LLC | 0 | -100,00 | 0 | |||||
| 2026-02-13 | 13F | Barclays Plc | Put | 23.400 | -21,48 | 211 | -59,42 | |||
| 2026-02-13 | 13F | Barclays Plc | 604.654 | 208,71 | 5.454 | 59,49 | ||||
| 2026-02-13 | 13F | Barclays Plc | Call | 646.800 | 16,58 | 5.834 | -39,77 | |||
| 2025-11-14 | 13F | Aquatic Capital Management LLC | 0 | -100,00 | 0 | |||||
| 2026-02-13 | 13F | Clear Street Group Inc. | 53.025 | 0 | ||||||
| 2026-02-17 | 13F | Twinbeech Capital Lp | 0 | -100,00 | 0 | -100,00 | ||||
| 2026-04-30 | 13F | Nuveen, LLC | 399.150 | 286,05 | 6.594 | 607,40 | ||||
| 2026-02-13 | 13F | Marshall Wace, Llp | 161.210 | 1.454 | ||||||
| 2025-11-12 | 13F | Bardin Hill Management Partners Lp | Call | 0 | -100,00 | 0 | -100,00 | |||
| 2026-02-13 | 13F | Caitong International Asset Management Co., Ltd | 0 | -100,00 | 0 | |||||
| 2026-02-17 | 13F | Luminus Management Llc | 0 | -100,00 | 0 | -100,00 | ||||
| 2026-01-29 | 13F | Comerica Bank | 2.172 | 223,21 | 20 | 72,73 | ||||
| 2026-04-29 | 13F | Hughes Financial Services, LLC | 2 | 0 | ||||||
| 2026-02-17 | 13F | Massar Capital Management, LP | 54.000 | -55,00 | 487 | -76,75 | ||||
| 2025-11-14 | 13F | Pentwater Capital Management LP | 0 | -100,00 | 0 | -100,00 | ||||
| 2026-04-07 | 13F | U.S. Capital Wealth Advisors, LLC | 42.094 | -2,32 | 695 | 79,12 | ||||
| 2026-02-17 | 13F | Man Group plc | 391.038 | 3.527 | ||||||
| 2026-02-17 | 13F | Dark Forest Capital Management Lp | 13.754 | 124 | ||||||
| 2026-02-17 | 13F | Toronto Dominion Bank | 123.100 | 153,77 | 1.110 | 31,21 | ||||
| 2026-02-17 | 13F | Philadelphia Financial Management of San Francisco, LLC | 328.081 | 2.959 | ||||||
| 2026-02-17 | 13F | Fmr Llc | 12.951 | -97,49 | 117 | -98,71 | ||||
| 2026-01-30 | 13F | Us Bancorp \de\ | 894 | 8 | ||||||
| 2026-02-17 | 13F | D. E. Shaw & Co., Inc. | 0 | -100,00 | 0 | -100,00 | ||||
| 2026-02-17 | 13F | Weiss Asset Management LP | 328.195 | 48,87 | 2.960 | -23,10 | ||||
| 2026-02-17 | 13F | Weiss Asset Management LP | Put | 700.000 | 0,00 | 6.314 | -48,34 | |||
| 2026-02-17 | 13F | Legacy Wealth Advisors, LLC | 362.273 | 3.268 | ||||||
| 2026-02-17 | 13F | Jones Financial Companies Lllp | 7.372 | 490,23 | 66 | 175,00 | ||||
| 2026-02-17 | 13F | Alliancebernstein L.p. | 70.685 | 0,25 | 638 | -48,25 | ||||
| 2026-02-13 | 13F | Parkside Financial Bank & Trust | 70 | 180,00 | 1 | |||||
| 2026-01-29 | 13F | UBS Group AG | Call | 150.000 | -65,42 | 1.353 | -82,14 | |||
| 2026-01-29 | 13F | UBS Group AG | 2.690.017 | 173,08 | 24.264 | 41,07 | ||||
| 2026-02-17 | 13F | Encompass Capital Advisors LLC | Call | 0 | -100,00 | 0 | -100,00 | |||
| 2026-02-17 | 13F | Millennium Management Llc | Call | 258.500 | -41,30 | 2.332 | -69,68 | |||
| 2026-02-17 | 13F | Millennium Management Llc | 3.232.576 | 248,48 | 29.158 | 80,03 | ||||
| 2025-11-14 | 13F | 683 Capital Management, LLC | 0 | -100,00 | 0 | -100,00 | ||||
| 2026-01-29 | 13F | IMC-Chicago, LLC | 179.321 | 140,49 | 1.617 | 24,29 | ||||
| 2026-02-06 | 13F | Larson Financial Group LLC | 2.278 | 341,47 | 21 | 122,22 | ||||
| 2026-02-17 | 13F | Merewether Investment Management, LP | 0 | -100,00 | 0 | -100,00 | ||||
| 2026-02-13 | 13F | State Street Corp | 3.775.884 | 20,40 | 34.058 | -37,80 | ||||
| 2026-02-17 | 13F | Quantinno Capital Management LP | 102.966 | 929 | ||||||
| 2026-02-19 | 13F/A | Himalaya Capital Management LLC | 0 | -100,00 | 0 | -100,00 | ||||
| 2025-11-12 | 13F | HAP Trading, LLC | Put | 1.022.900 | 3.887 | |||||
| 2025-11-12 | 13F | HAP Trading, LLC | 388.524 | 6.784 | ||||||
| 2025-11-12 | 13F | HAP Trading, LLC | Call | 431.400 | 179 | |||||
| 2026-02-13 | 13F | Ubs Oconnor Llc | 0 | -100,00 | 0 | -100,00 | ||||
| 2026-04-28 | 13F | BW Gestao de Investimentos Ltda. | 2.129.105 | 45,11 | 35.173 | 165,77 | ||||
| 2026-02-19 | 13F | CI Private Wealth, LLC | 19.445 | 175 | ||||||
| 2026-02-17 | 13F | Nokomis Capital, L.L.C. | 83.005 | 0,00 | 749 | -48,38 | ||||
| 2026-02-09 | 13F | Legal & General Group Plc | 89.044 | 41,16 | 803 | -27,07 | ||||
| 2026-02-26 | 13F/A | Alpine Global Management, LLC | 20.000 | 33,33 | 180 | -31,03 | ||||
| 2026-02-17 | 13F | Northern Trust Corp | 719.739 | 15,54 | 6.492 | -40,31 | ||||
| 2026-02-13 | 13F | National Bank Of Canada /fi/ | 0 | -100,00 | 0 | -100,00 | ||||
| 2026-02-11 | 13F | Rise Advisors, LLC | 0 | -100,00 | 0 | |||||
| 2026-02-13 | 13F | DLD Asset Management, LP | Put | 66.000 | -64,95 | 597 | -81,86 | |||
| 2026-02-17 | 13F | Fort Baker Capital Management LP | 112.047 | 1.011 | ||||||
| 2026-05-01 | 13F | International Assets Investment Management, Llc | 580 | 0,00 | 9 | 60,00 | ||||
| 2026-02-13 | 13F | DLD Asset Management, LP | Call | 251.500 | 2.274 | |||||
| 2026-02-17 | 13F | Encompass Capital Advisors LLC | 13.489.241 | 88,08 | 121.673 | -2,83 | ||||
| 2026-01-12 | 13F | Salem Investment Counselors Inc | 0 | -100,00 | 0 | -100,00 | ||||
| 2026-02-17 | 13F | Polymer Capital Management (US) LLC | 0 | -100,00 | 0 | -100,00 | ||||
| 2026-02-13 | 13F | Gts Securities Llc | 0 | -100,00 | 0 | -100,00 | ||||
| 2025-11-14 | 13F | Oxford Asset Management Llp | 36.793 | 91,92 | 642 | 52,49 | ||||
| 2026-02-05 | 13F | Amalgamated Bank | 2.390 | 36,42 | 0 | |||||
| 2026-02-17 | 13F | MIRAE ASSET GLOBAL ETFS HOLDINGS Ltd. | 35.349 | 0,02 | 319 | -48,46 | ||||
| 2026-02-17 | 13F | Scoggin Management Lp | Call | 0 | -100,00 | 0 | -100,00 | |||
| 2026-02-06 | 13F | EverSource Wealth Advisors, LLC | 98 | -74,41 | 1 | -100,00 | ||||
| 2026-02-17 | 13F | Aster Capital Management (DIFC) Ltd | 5.230 | 263,19 | 47 | 88,00 | ||||
| 2026-02-05 | 13F | Mission Wealth Management, Lp | 18.988 | 171 | ||||||
| 2026-02-13 | 13F | Ubs Asset Management Americas Inc | 160.542 | 125,69 | 1.448 | 16,59 | ||||
| 2026-02-12 | 13F | DRW Securities, LLC | 60.583 | 546 | ||||||
| 2026-02-13 | 13F | Squarepoint Ops LLC | Call | 38.200 | 45,80 | 345 | -24,73 | |||
| 2026-02-12 | 13F | DRW Securities, LLC | Call | 18.500 | 167 | |||||
| 2026-02-13 | 13F | Squarepoint Ops LLC | Put | 101.800 | 150,12 | 918 | 29,30 | |||
| 2026-02-13 | 13F | Greenhaven Road Investment Management, L.P. | 0 | -100,00 | 0 | -100,00 | ||||
| 2026-02-12 | 13F | Hrt Financial Lp | 0 | -100,00 | 0 | -100,00 | ||||
| 2026-02-17 | 13F | Moore Capital Management, Lp | 25.000 | -87,50 | 226 | -93,56 | ||||
| 2026-04-29 | 13F | Bluefin Capital Management, Llc | Call | 1.356.700 | 47,95 | 352 | -17,99 | |||
| 2026-04-29 | 13F | Bluefin Capital Management, Llc | Put | 408.000 | -58,27 | 3.243 | 68,64 | |||
| 2026-02-17 | 13F | Schonfeld Strategic Advisors LLC | 0 | -100,00 | 0 | -100,00 | ||||
| 2026-04-24 | 13F | Root Financial Partners, LLC | 11 | 0 | ||||||
| 2026-02-17 | 13F | Susquehanna International Group, Llp | Call | 2.831.700 | -45,71 | 25.542 | -71,95 | |||
| 2026-02-17 | 13F | Susquehanna International Group, Llp | 442.020 | -80,29 | 3.987 | -89,82 | ||||
| 2026-02-10 | 13F | Bnp Paribas Arbitrage, Sa | 151.744 | 273,19 | 1.369 | 92,95 | ||||
| 2026-02-17 | 13F | Susquehanna International Group, Llp | Put | 1.917.600 | -52,85 | 17.297 | -75,64 | |||
| 2026-04-23 | 13F | American National Bank | 0 | -100,00 | 0 | |||||
| 2026-02-11 | 13F | Los Angeles Capital Management Llc | 19.871 | 255 | ||||||
| 2026-02-17 | 13F | Lombard Odier Asset Management (USA) Corp | Put | 83.700 | 755 | |||||
| 2026-02-23 | 13F | Virtu Financial LLC | 0 | -100,00 | 0 | |||||
| 2026-02-10 | 13F | Goldman Sachs Group Inc | 954.259 | 25,54 | 8.607 | -35,15 | ||||
| 2026-02-17 | 13F | Bank Of America Corp /de/ | 398.827 | -88,67 | 3.597 | -94,15 | ||||
| 2026-01-26 | 13F | Cwm, Llc | 675 | -63,98 | 0 | |||||
| 2026-02-10 | 13F | Goldman Sachs Group Inc | Put | 20.000 | 0,00 | 180 | -48,42 | |||
| 2026-02-13 | 13F | Walleye Capital LLC | Put | 35.000 | -20,45 | 316 | -58,98 | |||
| 2026-02-13 | 13F | Walleye Capital LLC | 92.513 | 1.776,53 | 834 | 869,77 | ||||
| 2026-01-26 | 13F | Patriot Financial Group Insurance Agency, LLC | 0 | -100,00 | 0 | |||||
| 2026-02-13 | 13F | Walleye Capital LLC | Call | 39.300 | -13,44 | 354 | -55,30 | |||
| 2026-04-06 | 13F | GAMMA Investing LLC | 1.069 | 218,15 | 18 | 466,67 | ||||
| 2026-02-13 | 13F | Rhumbline Advisers | 91.384 | -14,57 | 824 | -55,87 | ||||
| 2026-04-28 | 13F | Lee Danner & Bass Inc | 70.000 | 1.156 | ||||||
| 2026-04-30 | 13F | Hsbc Holdings Plc | 98.986 | 1.663 | ||||||
| 2026-02-17 | 13F | Cetera Investment Advisers | 10.417 | -51,79 | 94 | -75,33 | ||||
| 2026-02-17 | 13F | Cetera Investment Advisers | Call | 500 | 1 | |||||
| 2026-04-30 | 13F | Clear Street Markets Llc | 0 | -100,00 | 0 | |||||
| 2026-02-09 | 13F | Emerald Advisers, Llc | 0 | -100,00 | 0 | -100,00 | ||||
| 2026-02-09 | 13F | Quest Partners LLC | 14.747 | 78,66 | 133 | -7,64 | ||||
| 2026-02-17 | 13F | Bitterroot Capital Advisors Llc | 16.000 | 144 | ||||||
| 2026-04-16 | 13F | Capital Advisors, Ltd. LLC | 103 | -0,96 | 0 | |||||
| 2026-02-17 | 13F | Garnet Equity Capital Holdings, Inc. | Call | 300.000 | -81,25 | 2.706 | -90,31 | |||
| 2026-02-17 | 13F | Garnet Equity Capital Holdings, Inc. | 157.891 | -24,05 | 1.424 | -60,76 | ||||
| 2026-02-12 | 13F | Cibc World Markets Corp | 0 | -100,00 | 0 | |||||
| 2026-02-17 | 13F | Point72 Asset Management, L.P. | Call | 0 | -100,00 | 0 | ||||
| 2026-02-17 | 13F | Kultura Capital Management LP | Call | 11.200 | 101 | |||||
| 2026-04-28 | 13F | Whittier Trust Co | 6.000 | 0,00 | 85 | 41,67 | ||||
| 2026-02-17 | 13F | Scientech Research LLC | 0 | -100,00 | 0 | |||||
| 2026-02-12 | 13F | BlackRock, Inc. | 6.709.689 | 21,80 | 60.521 | -37,08 | ||||
| 2026-02-13 | 13F | Mariner, LLC | 33.088 | -9,59 | 298 | -53,36 | ||||
| 2026-02-17 | 13F | Sig Brokerage, Lp | Put | 22.500 | 203 | |||||
| 2026-02-17 | 13F | Sig Brokerage, Lp | Call | 10.000 | -82,24 | 90 | -90,84 | |||
| 2026-02-13 | 13F | Brown Advisory Inc | 30.939 | 0,00 | 279 | -48,33 | ||||
| 2026-02-13 | 13F | Morgan Stanley | 5.233.890 | 518,77 | 47.210 | 219,67 | ||||
| 2026-02-20 | 13F/A | FourWorld Capital Management LLC | Call | 306.500 | 2.765 | |||||
| 2026-02-13 | 13F | DLD Asset Management, LP | 0 | -100,00 | 0 | -100,00 | ||||
| 2025-11-14 | 13F | Concorde Financial Corp | 0 | -100,00 | 0 | -100,00 | ||||
| 2026-02-13 | 13F | Stifel Financial Corp | 0 | -100,00 | 0 | |||||
| 2026-04-23 | 13F | Mayflower Financial Advisors, LLC | 18.188 | 0,00 | 300 | 82,93 | ||||
| 2026-02-17 | 13F | Engineers Gate Manager LP | 0 | -100,00 | 0 | -100,00 | ||||
| 2026-02-17 | 13F | Royal Bank Of Canada | 4.022 | -97,09 | 35 | -98,55 | ||||
| 2026-02-09 | 13F | Harbour Investments, Inc. | 40 | 0 | ||||||
| 2025-11-14 | 13F | Sculptor Capital LP | 0 | -100,00 | 0 | -100,00 | ||||
| 2026-02-11 | 13F | Two Seas Capital LP | Call | 0 | -100,00 | 0 | -100,00 | |||
| 2026-02-11 | 13F | Ameritas Investment Partners, Inc. | 6.355 | 57 | ||||||
| 2026-02-11 | 13F | Argent Advisors, Inc. | 0 | -100,00 | 0 | -100,00 | ||||
| 2026-02-12 | 13F | Quadrant Capital Group Llc | 1.991 | 18 | ||||||
| 2026-01-29 | 13F | Vanguard Group Inc | 7.557.670 | 64,94 | 68.170 | -14,79 | ||||
| 2026-04-07 | 13F | Farther Finance Advisors, LLC | 65 | -23,53 | 1 | |||||
| 2025-11-14 | 13F/A | Skopos Labs, Inc. | 0 | -100,00 | 0 | |||||
| 2026-04-21 | 13F | Clarus Group, Inc. | 21.513 | -0,13 | 355 | 82,99 | ||||
| 2025-11-14 | 13F | Josh Arnold Investment Consultant, Llc | 0 | -100,00 | 0 | -100,00 | ||||
| 2026-02-13 | 13F | Ieq Capital, Llc | 20.000 | -62,53 | 180 | -80,67 | ||||
| 2026-02-11 | 13F | CenterBook Partners LP | 0 | -100,00 | 0 | -100,00 | ||||
| 2026-02-13 | 13F | Fifth Lane Capital, Lp | 27.500 | 83,21 | 248 | -5,34 | ||||
| 2026-02-06 | 13F | Pnc Financial Services Group, Inc. | 1.043 | 44,86 | 9 | -25,00 | ||||
| 2026-02-13 | 13F | Fifth Lane Capital, Lp | Call | 1.000 | 9 | |||||
| 2026-05-01 | 13F | Fifth Third Bancorp | 1.763 | 29 | ||||||
| 2026-02-12 | 13F | Brown Brothers Harriman & Co | 0 | -100,00 | 0 | |||||
| 2026-02-13 | 13F | Manufacturers Life Insurance Company, The | 46.716 | 18,64 | 421 | -38,72 | ||||
| 2026-02-12 | 13F | Steward Partners Investment Advisory, Llc | 2.210 | -47,56 | 20 | -73,97 | ||||
| 2026-02-11 | 13F | LPL Financial LLC | 424.201 | 1.966,55 | 3.826 | 968,72 | ||||
| 2026-02-17 | 13F | Whitefort Capital Management, LP | 1.910.793 | 17.235 | ||||||
| 2025-11-13 | 13F | Private Advisor Group, LLC | 0 | -100,00 | 0 | -100,00 | ||||
| 2026-02-17 | 13F | Lighthouse Investment Partners, LLC | Call | 200.000 | 1.804 | |||||
| 2026-02-10 | 13F | Rothschild Investment Llc | 20 | -60,00 | 0 | |||||
| 2026-04-22 | 13F | Pictet Asset Management Holding SA | 14.391 | -19,92 | 238 | 46,30 | ||||
| 2026-02-17 | 13F | IHT Wealth Management, LLC | 0 | -100,00 | 0 | -100,00 | ||||
| 2025-11-14 | 13F | Saba Capital Management, L.P. | 0 | -100,00 | 0 | -100,00 | ||||
| 2026-02-17 | 13F | Moore Capital Management, Lp | Call | 0 | -100,00 | 0 | ||||
| 2026-02-11 | 13F | Jpmorgan Chase & Co | 34.830 | -78,13 | 314 | -88,71 | ||||
| 2026-02-03 | 13F | Ballentine Partners, LLC | 0 | -100,00 | 0 | -100,00 | ||||
| 2026-02-13 | 13F | Williams Jones Wealth Management, LLC. | 10.000 | 90 | ||||||
| 2026-02-17 | 13F | Qube Research & Technologies Ltd | Call | 0 | -100,00 | 0 | -100,00 | |||
| 2026-02-17 | 13F | Pilgrim Global Advisors LLC | 18.206.121 | 83,28 | 164.219 | -5,31 | ||||
| 2026-02-11 | 13F | Two Seas Capital LP | 1.733.239 | 182,27 | 15.634 | 45,82 | ||||
| 2026-04-23 | 13F | Oppenheimer & Co Inc | 26.542 | 438 | ||||||
| 2026-02-13 | 13F | Edgestream Partners, L.P. | 0 | -100,00 | 0 | |||||
| 2026-02-17 | 13F | Raffles Associates Lp | 0 | -100,00 | 0 | -100,00 | ||||
| 2026-02-17 | 13F | XTX Topco Ltd | 0 | -100,00 | 0 | -100,00 | ||||
| 2026-05-01 | 13F | Arizona State Retirement System | 27.978 | -1,53 | 462 | 80,47 | ||||
| 2026-02-13 | 13F | Squarepoint Ops LLC | 0 | -100,00 | 0 | -100,00 | ||||
| 2026-02-17 | 13F | Pickering Energy Partners Lp | 80.000 | 146,15 | 722 | 27,16 | ||||
| 2026-02-06 | 13F | Global Retirement Partners, LLC | 113 | -75,06 | 1 | -85,71 | ||||
| 2026-02-17 | 13F | FourWorld Capital Management LLC | 8.105.608 | 73.113 | ||||||
| 2026-02-11 | 13F | T3 Companies, LLC | Put | 16.500 | 11 | |||||
| 2026-04-20 | 13F | Inscription Capital, LLC | 19.244 | 0,00 | 318 | 83,24 | ||||
| 2026-02-17 | 13F | Evercore Wealth Management, LLC | 15.750 | 142 | ||||||
| 2026-02-11 | 13F | T3 Companies, LLC | 95.870 | 865 | ||||||
| 2026-02-17 | 13F | Clayton Partners LLC | 0 | -100,00 | 0 | -100,00 | ||||
| 2026-02-11 | 13F | T3 Companies, LLC | Call | 143.100 | 40 | |||||
| 2026-02-13 | 13F | Centiva Capital, LP | Call | 25.000 | -89,19 | 226 | -94,43 | |||
| 2026-02-17 | 13F | Millennium Management Llc | Put | 0 | -100,00 | 0 | -100,00 | |||
| 2026-02-12 | 13F | MetLife Investment Management, LLC | 43.314 | -2,90 | 391 | -49,87 | ||||
| 2026-01-29 | 13F | UBS Group AG | Put | 0 | -100,00 | 0 | -100,00 | |||
| 2026-04-28 | 13F | Whittier Trust Co Of Nevada Inc | 4.150 | 0,00 | 59 | 41,46 | ||||
| 2026-02-17 | 13F | VARCOV Co. | 38.430 | 347 | ||||||
| 2025-11-14 | 13F | Two Sigma Advisers, Lp | 0 | -100,00 | 0 | -100,00 | ||||
| 2026-02-13 | 13F | Kilter Group LLC | 0 | -100,00 | 0 | |||||
| 2026-02-17 | 13F | Brevan Howard Capital Management LP | 26.774 | 23,09 | 242 | -36,41 | ||||
| 2026-02-17 | 13F | Angeles Wealth Management, Llc | 11.304 | -6,70 | 102 | -52,13 | ||||
| 2026-04-16 | 13F | SG Americas Securities, LLC | 0 | -100,00 | 0 | |||||
| 2026-01-12 | 13F | Rialto Wealth Management, LLC | 0 | -100,00 | 0 | |||||
| 2026-02-11 | 13F | Simplex Trading, Llc | 129.451 | 220,62 | 1.168 | |||||
| 2026-02-17 | 13F | Caption Management, LLC | 1.512.347 | 6,39 | 13.641 | -45,04 | ||||
| 2026-02-17 | 13F | Caption Management, LLC | Put | 2.631.200 | -16,13 | 23.733 | -56,68 | |||
| 2026-02-13 | 13F | Verition Fund Management LLC | 2.456.241 | 92,94 | 22.155 | -0,33 | ||||
| 2026-02-18 | 13F | GWM Advisors LLC | 42.612 | 83,86 | 384 | -4,95 | ||||
| 2026-02-17 | 13F | State Of Wisconsin Investment Board | 57.767 | -15,52 | 521 | -56,33 | ||||
| 2026-02-13 | 13F | Verition Fund Management LLC | Put | 675.000 | 350,00 | 6.088 | 132,46 | |||
| 2026-02-17 | 13F | Tudor Investment Corp Et Al | Put | 206.700 | 1.864 | |||||
| 2026-02-13 | 13F | Verition Fund Management LLC | Call | 200.400 | -49,95 | 1.808 | -74,15 | |||
| 2026-02-17 | 13F | Tudor Investment Corp Et Al | Call | 444.200 | 4.007 | |||||
| 2026-02-17 | 13F | TCG Advisory Services, LLC | 0 | -100,00 | 0 | -100,00 | ||||
| 2026-01-30 | 13F | Wealthfront Advisers Llc | 17.891 | 161 | ||||||
| 2026-02-04 | 13F | BCJ Capital Management, LLC | 0 | -100,00 | 0 | -100,00 | ||||
| 2026-02-10 | 13F | Goldman Sachs Group Inc | Call | 0 | -100,00 | 0 | -100,00 | |||
| 2026-02-17 | 13F | Rangeley Capital, LLC | 19.000 | -54,76 | 171 | -76,67 | ||||
| 2026-02-17 | 13F | Plustick Management Llc | 350.000 | 3.157 | ||||||
| 2026-02-17 | 13F | Scoggin Management Lp | Put | 100.000 | -55,56 | 902 | -77,04 | |||
| 2026-02-17 | 13F | Two Sigma Investments, Lp | 455.208 | 109,78 | 4.106 | 8,37 | ||||
| 2026-03-16 | 13F/A | Rockefeller Capital Management L.P. | 0 | -100,00 | 0 | -100,00 | ||||
| 2026-02-10 | 13F | Axq Capital, Lp | 19.815 | 179 | ||||||
| 2026-02-17 | 13F | Caption Management, LLC | Call | 1.370.000 | -56,73 | 12.357 | -77,65 | |||
| 2026-02-20 | 13F | Sunbelt Securities, Inc. | 67.000 | -11,84 | 604 | -54,45 | ||||
| 2025-11-14 | 13F | Centiva Capital, LP | 0 | -100,00 | 0 | -100,00 | ||||
| 2026-02-04 | 13F | Sentry Investment Management Llc | 0 | -100,00 | 0 | |||||
| 2026-02-10 | 13F | Quantbot Technologies LP | 0 | -100,00 | 0 | -100,00 | ||||
| 2026-02-06 | 13F | Bare Financial Services, Inc | 81 | 1 | ||||||
| 2026-01-26 | 13F | KBC Group NV | 2.106 | 0,00 | 0 | |||||
| 2026-04-15 | 13F | Financial Management Professionals, Inc. | 833 | 14 | ||||||
| 2026-04-24 | 13F | ProShare Advisors LLC | 18.044 | 29,81 | 298 | 138,40 | ||||
| 2026-02-17 | 13F | Cobalt Capital Management, Inc. | 260.000 | 1.200,00 | 2.345 | 571,92 | ||||
| 2026-02-17 | 13F | Rpo Llc | 14.018 | 126 | ||||||
| 2026-01-23 | 13F | TFC Financial Management | 0 | -100,00 | 0 | |||||
| 2026-02-10 | 13F | Bank of New York Mellon Corp | 198.726 | -7,47 | 1.793 | -52,20 | ||||
| 2026-02-17 | 13F | Scoggin Management Lp | 250.000 | -42,86 | 2.255 | -70,48 | ||||
| 2026-02-09 | 13F | Huntington National Bank | 200 | 0,00 | 2 | -66,67 | ||||
| 2026-02-17 | 13F | Sig Brokerage, Lp | 0 | -100,00 | 0 | -100,00 | ||||
| 2026-02-13 | 13F | Hudson Bay Capital Management LP | Put | 0 | -100,00 | 0 | -100,00 | |||
| 2026-02-13 | 13F | Continental General Insurance Co | 640.106 | 5.774 | ||||||
| 2026-02-17 | 13F | Prelude Capital Management, Llc | 35.000 | 60,60 | 316 | -17,11 | ||||
| 2026-02-06 | 13F | HighTower Advisors, LLC | Put | 0 | -100,00 | 0 | ||||
| 2026-02-11 | 13F | Parallel Advisors, LLC | 187 | 18,35 | 2 | -50,00 | ||||
| 2026-01-30 | 13F | Pekin Hardy Strauss, Inc. | 0 | -100,00 | 0 | -100,00 | ||||
| 2026-02-17 | 13F | Pertento Partners LLP | 1.107.901 | 9.993 | ||||||
| 2025-11-25 | 13F | Briaud Financial Planning, Inc | 0 | -100,00 | 0 | |||||
| 2026-02-12 | 13F | Jane Street Group, Llc | Put | 1.803.300 | 79,22 | 16.266 | -7,42 | |||
| 2026-02-12 | 13F | Jane Street Group, Llc | Call | 2.730.500 | -37,82 | 24.629 | -67,88 | |||
| 2026-02-13 | 13F | MAI Capital Management | 15.508 | 33,49 | 140 | -31,19 | ||||
| 2026-02-17 | 13F | Capital Fund Management S.a. | 95.487 | 527,38 | 861 | 224,91 | ||||
| 2026-02-26 | 13F/A | Aristides Capital LLC | 13.400 | 121 | ||||||
| 2026-02-17 | 13F | Parallax Volatility Advisers, L.P. | Put | 52.500 | 474 | |||||
| 2026-02-13 | 13F | BNP Paribas Asset Management Holding S.A. | 1.908 | 202,38 | 0 | |||||
| 2026-01-22 | 13F | DDD Partners, LLC | 0 | -100,00 | 0 | -100,00 | ||||
| 2026-04-30 | 13F | Nisa Investment Advisors, Llc | 319 | 4,59 | 5 | 150,00 | ||||
| 2025-11-13 | 13F | Renaissance Technologies Llc | 0 | -100,00 | 0 | -100,00 | ||||
| 2026-02-17 | 13F | California State Teachers Retirement System | 159.520 | 196,96 | 1.439 | 53,47 | ||||
| 2026-02-17 | 13F | Lighthouse Investment Partners, LLC | 0 | -100,00 | 0 | -100,00 | ||||
| 2026-04-29 | 13F | Bluefin Capital Management, Llc | 0 | -100,00 | 0 | -100,00 | ||||
| 2026-02-10 | 13F | SCS Capital Management LLC | 50.000 | -16,67 | 451 | -56,92 | ||||
| 2026-02-06 | 13F | Covestor Ltd | 6 | -99,96 | 0 | |||||
| 2026-04-15 | 13F | Gf Fund Management Co. Ltd. | 40.930 | 13,83 | 676 | 108,64 | ||||
| 2026-02-09 | 13F | Emerald Mutual Fund Advisers Trust | 0 | -100,00 | 0 | |||||
| 2026-02-17 | 13F | Pentwater Capital Management LP | Call | 0 | -100,00 | 0 | -100,00 | |||
| 2026-02-13 | 13F | Diametric Capital, LP | 0 | -100,00 | 0 | |||||
| 2026-02-17 | 13F | Toronto Dominion Bank | Call | 480.400 | -80,02 | 4.333 | -89,68 | |||
| 2026-02-12 | 13F | Federation des caisses Desjardins du Quebec | 230 | 2 | ||||||
| 2026-04-13 | 13F | Massmutual Trust Co Fsb/adv | 400 | 0,00 | 7 | 100,00 | ||||
| 2026-04-16 | 13F | REX Advisers, LLC | Put | 77.200 | 118 | |||||
| 2026-04-16 | 13F | REX Advisers, LLC | Call | 77.200 | 7 | |||||
| 2026-04-16 | 13F | REX Advisers, LLC | 38.600 | 638 | ||||||
| 2026-02-17 | 13F | Interval Partners, LP | 0 | -100,00 | 0 | -100,00 | ||||
| 2026-02-19 | 13F | Invesco Ltd. | 133.874 | 226,28 | 1.208 | 68,58 | ||||
| 2026-02-13 | 13F | Kore Advisors LP | 151.045 | 367,11 | 1.362 | 141,49 | ||||
| 2026-02-17 | 13F | Parallax Volatility Advisers, L.P. | Call | 477.300 | -31,33 | 4.305 | -64,53 | |||
| 2026-02-17 | 13F | Ghisallo Capital Management LLC | 0 | -100,00 | 0 | -100,00 | ||||
| 2026-02-17 | 13F | Parallax Volatility Advisers, L.P. | 10.975 | -91,86 | 99 | -95,84 | ||||
| 2026-02-17 | 13F | Advisor Group Holdings, Inc. | 3.485 | -49,15 | 31 | -81,55 | ||||
| 2026-02-11 | 13F | Winton Capital Group Ltd | 24.826 | 224 | ||||||
| 2026-02-17 | 13F | Nomura Holdings Inc | 324.749 | -29,04 | 2.929 | -63,34 | ||||
| 2026-02-17 | 13F | Nomura Holdings Inc | Call | 218.000 | -24,78 | 1.966 | -61,14 | |||
| 2026-02-17 | 13F | Nomura Holdings Inc | Put | 407.800 | -68,57 | 3.678 | -83,76 | |||
| 2026-02-12 | 13F | Voya Investment Management Llc | 13.444 | 0,00 | 121 | -48,29 | ||||
| 2026-02-09 | 13F | GeoSphere Capital Management | 0 | -100,00 | 0 | |||||
| 2026-02-13 | 13F | Citigroup Inc | 239.047 | 96,81 | 2.156 | 1,70 | ||||
| 2026-02-17 | 13F | Shay Capital LLC | 12.000 | -98,16 | 108 | -99,05 | ||||
| 2026-04-29 | 13F | Klp Kapitalforvaltning As | 28.600 | -23,53 | 472 | 40,06 | ||||
| 2026-02-17 | 13F | Shay Capital LLC | Call | 50.000 | -95,72 | 451 | -97,79 | |||
| 2026-02-13 | 13F | Walleye Trading LLC | Call | 252.200 | 5,52 | 2.275 | -45,49 | |||
| 2026-02-13 | 13F | Walleye Trading LLC | 56.650 | 160,30 | 511 | 34,56 | ||||
| 2026-04-15 | 13F | FNY Investment Advisers, LLC | 500 | -97,72 | 0 | |||||
| 2026-02-13 | 13F | Citigroup Inc | Put | 459.300 | 16,04 | 4.143 | -40,06 | |||
| 2026-02-13 | 13F | Walleye Trading LLC | Put | 349.300 | 42,46 | 3.151 | -26,42 | |||
| 2026-02-12 | 13F | Swiss National Bank | 200.000 | 89,93 | 1.804 | -1,85 | ||||
| 2026-02-12 | 13F | New York State Common Retirement Fund | 22.300 | 0,00 | 201 | -48,33 | ||||
| 2026-02-10 | 13F | DiMeo Schneider & Associates, L.L.C. | 48.300 | 0,00 | 436 | -48,40 | ||||
| 2026-02-17 | 13F | Toronto Dominion Bank | Put | 59.400 | -13,03 | 536 | -55,12 | |||
| 2026-01-27 | 13F | Zurcher Kantonalbank (Zurich Cantonalbank) | 15.765 | 72,01 | 142 | -11,25 | ||||
| 2026-02-06 | 13F | Mraz, Amerine & Associates, Inc. | 13.629 | 123 | ||||||
| 2026-04-15 | 13F | Atwood & Palmer Inc | 1.200 | 0,00 | 20 | 90,00 | ||||
| 2026-01-28 | 13F | CAPROCK Group, Inc. | 26.108 | 235 | ||||||
| 2025-11-14 | 13F | SummitTX Capital, L.P. | 0 | -100,00 | 0 | |||||
| 2026-01-07 | 13F | Aventura Private Wealth, LLC | 0 | -100,00 | 0 | -100,00 | ||||
| 2026-02-17 | 13F | Union Square Park Capital Management, LLC | 0 | -100,00 | 0 | -100,00 | ||||
| 2026-04-29 | 13F | KDK Private Wealth Management, LLC | 39.500 | 0,00 | 653 | 83,15 | ||||
| 2026-02-02 | 13F | Danske Bank A/s | 1.700 | 0,00 | 15 | -48,28 | ||||
| 2026-02-04 | 13F | Independent Advisor Alliance | 0 | -100,00 | 0 | -100,00 | ||||
| 2026-02-17 | 13F | Yaupon Capital Management LP | Put | 0 | -100,00 | 0 | -100,00 | |||
| 2026-02-17 | 13F | Cooper Creek Partners Management Llc | 0 | -100,00 | 0 | -100,00 | ||||
| 2026-04-28 | 13F | SBI Securities Co., Ltd. | 1.778 | -32,70 | 29 | 26,09 | ||||
| 2026-02-17 | 13F | Trexquant Investment LP | 517.692 | 4.670 | ||||||
| 2025-11-14 | 13F | Ionic Capital Management LLC | 0 | -100,00 | 0 | |||||
| 2025-11-14 | 13F | ExodusPoint Capital Management, LP | Call | 190.000 | 3.315 | |||||
| 2026-02-17 | 13F | D. E. Shaw & Co., Inc. | Put | 55.000 | -95,07 | 496 | -97,45 | |||
| 2026-04-16 | 13F | Tactive Advisors, LLC | 45.270 | 748 | ||||||
| 2026-02-17 | 13F | D. E. Shaw & Co., Inc. | Call | 266.200 | 0,00 | 2.401 | -48,33 | |||
| 2026-02-17 | 13F | Balyasny Asset Management Llc | 18.196 | 164 | ||||||
| 2026-04-30 | 13F | Kestra Advisory Services, LLC | 33.521 | 211,22 | 554 | 470,10 | ||||
| 2026-02-10 | 13F | Intech Investment Management Llc | 27.563 | -10,47 | 249 | -53,82 | ||||
| 2026-02-17 | 13F | LMR Partners LLP | Call | 183.800 | -22,22 | 1.658 | -59,83 | |||
| 2026-02-09 | 13F | Bleakley Financial Group, LLC | 64.050 | 25,71 | 578 | -35,10 | ||||
| 2026-04-23 | 13F | SJS Investment Consulting Inc. | 0 | -100,00 | 0 | |||||
| 2026-02-17 | 13F | Aventail Capital Group, LP | Call | 0 | -100,00 | 0 | -100,00 | |||
| 2026-02-05 | 13F | ANTIPODES PARTNERS Ltd | 0 | -100,00 | 0 | -100,00 | ||||
| 2025-11-14 | 13F | Cubist Systematic Strategies, LLC | 2.790 | 49 | ||||||
| 2026-02-17 | 13F | Guggenheim Capital Llc | 11.257 | 102 | ||||||
| 2026-02-13 | 13F | Charles Schwab Investment Management Inc | 923.740 | 42,98 | 8.332 | -26,13 | ||||
| 2026-02-12 | 13F | Ensign Peak Advisors, Inc | 7.650 | -39,76 | 69 | -68,78 | ||||
| 2026-04-22 | 13F | Stone House Investment Management, LLC | 16 | 0 | ||||||
| 2026-04-29 | 13F | Police & Firemen's Retirement System of New Jersey | 33.415 | 59,35 | 552 | 192,06 | ||||
| 2026-02-18 | 13F | NFP Retirement, Inc. | 0 | -100,00 | 0 | |||||
| 2026-02-17 | 13F | Yaupon Capital Management LP | 449.215 | 124,61 | 4.052 | 16,01 | ||||
| 2026-01-29 | 13F | UMA Financial Services, Inc. | 0 | -100,00 | 0 | |||||
| 2025-11-14 | 13F | Wolverine Trading, Llc | 116.196 | 516,29 | 2.153 | 398,38 | ||||
| 2025-11-14 | 13F | Wolverine Trading, Llc | Call | 580.900 | 281,42 | 10.764 | 208,42 | |||
| 2026-02-17 | 13F | Aventail Capital Group, LP | 1.264.639 | 361,52 | 11.407 | 138,44 | ||||
| 2025-11-14 | 13F | Wolverine Trading, Llc | Put | 361.400 | 1.387,24 | 6.697 | 1.104,32 | |||
| 2025-11-03 | 13F | Annis Gardner Whiting Capital Advisors, LLC | 0 | -100,00 | 0 | |||||
| 2026-02-17 | 13F | Mirabella Financial Services Llp | 26.619 | 240 | ||||||
| 2026-02-05 | 13F | Allworth Financial LP | 646 | 6.360,00 | 6 | |||||
| 2026-02-17 | 13F | Advisory Services Network, LLC | 0 | -100,00 | 0 | -100,00 | ||||
| 2026-02-09 | 13F | Penn Capital Management Co Inc | 56.860 | 53,14 | 513 | -20,99 | ||||
| 2026-02-17 | 13F | Cantor Fitzgerald, L. P. | Call | 0 | -100,00 | 0 | -100,00 | |||
| 2026-02-17 | 13F | Price T Rowe Associates Inc /md/ | 61.886 | 3,09 | 1 | -100,00 | ||||
| 2026-02-10 | 13F | Bbr Partners, Llc | 49.842 | -28,64 | 450 | -63,17 | ||||
| 2026-02-12 | 13F | Hollencrest Capital Management | 55.467 | 500 | ||||||
| 2026-02-13 | 13F | SRS Capital Advisors, Inc. | 353 | -13,05 | 3 | -57,14 | ||||
| 2026-02-17 | 13F | Clough Capital Partners L P | 172.830 | 1.559 | ||||||
| 2026-01-15 | 13F | Allspring Global Investments Holdings, LLC | 0 | -100,00 | 0 | -100,00 | ||||
| 2026-02-11 | 13F | Group One Trading, L.p. | 448.925 | -2,46 | 4.049 | -49,61 | ||||
| 2026-02-13 | 13F | Centiva Capital, LP | Put | 0 | -100,00 | 0 | -100,00 | |||
| 2026-02-13 | 13F | Rafferty Asset Management, LLC | 157.523 | 23,18 | 1.421 | -36,38 | ||||
| 2026-02-17 | 13F | Aqr Capital Management Llc | 15.220 | 40,19 | 137 | -27,51 | ||||
| 2026-02-17 | 13F | Tower Research Capital LLC (TRC) | 4.325 | 100,42 | 39 | 5,41 | ||||
| 2025-11-14 | 13F | SWAN Capital LLC | 0 | -100,00 | 0 | |||||
| 2026-02-10 | 13F | Belvedere Trading LLC | Call | 13.300 | 120 | |||||
| 2026-02-10 | 13F | Belvedere Trading LLC | 13.389 | 121 | ||||||
| 2026-02-13 | 13F | Quarry LP | 526 | 5 | ||||||
| 2026-02-17 | 13F | Point72 Asset Management, L.P. | 0 | -100,00 | 0 | |||||
| 2026-02-10 | 13F | Belvedere Trading LLC | Put | 200 | 2 | |||||
| 2026-01-28 | 13F | M&t Bank Corp | 0 | -100,00 | 0 | |||||
| 2026-02-12 | 13F | Marex Group plc | 18.484 | -4,58 | 167 | -53,63 | ||||
| 2026-04-13 | 13F | IFP Advisors, Inc | 1 | -99,97 | 0 | -100,00 | ||||
| 2026-04-22 | 13F | Sterling Capital Management LLC | 808 | 60,00 | 13 | 225,00 | ||||
| 2026-04-21 | 13F | OneAscent Financial Services LLC | 10.295 | 170 | ||||||
| 2026-02-05 | 13F | Gabelli Funds Llc | 84.608 | 11,60 | 763 | -42,33 | ||||
| 2026-02-13 | 13F | Formula Growth Ltd | 26.968 | 243 | ||||||
| 2025-11-13 | 13F | Riggs Asset Managment Co. Inc. | 0 | -100,00 | 0 | -100,00 | ||||
| 2026-02-02 | 13F | Avidian Wealth Solutions, LLC | 45.874 | -0,06 | 414 | -48,44 | ||||
| 2026-04-28 | 13F | GM Advisory Group, Inc. | 1.000.000 | 0,00 | 16.520 | 83,15 | ||||
| 2026-02-13 | 13F | Alyeska Investment Group, L.P. | 11.091.773 | 1.504,02 | 100.048 | 728,68 | ||||
| 2026-02-09 | 13F | Geode Capital Management, Llc | 2.294.121 | 28,60 | 20.699 | -33,56 | ||||
| 2025-11-14 | 13F | Jane Street Group, Llc | 0 | -100,00 | 0 | -100,00 | ||||
| 2026-02-10 | 13F | Bnp Paribas Arbitrage, Sa | Put | 0 | -100,00 | 0 | -100,00 | |||
| 2026-02-10 | 13F | Norges Bank | 806.300 | 7.273 | ||||||
| 2026-04-21 | 13F/A | Corsair Capital Management, L.p. | 0 | -100,00 | 0 | |||||
| 2026-02-17 | 13F | Janus Henderson Group Plc | 23.900 | 0,00 | 216 | -48,20 | ||||
| 2025-11-21 | 13F | Nebula Research & Development LLC | 0 | -100,00 | 0 | -100,00 | ||||
| 2025-11-14 | 13F | Lloyd Harbor Capital Management, LLC | Call | 0 | -100,00 | 0 | -100,00 |
Other Listings
| IT:1SOC | 11,30 € |