Grundlæggende statistik
| Institutionelle aktier (lange) | 15.934.649 - 78,86% (ex 13D/G) - change of -4,20MM shares -20,86% MRQ |
| Institutionel værdi (lang) | $ 283.212 USD ($1000) |
Institutionelt ejerskab og aktionærer
Simulations Plus, Inc. (US:SLP) har 173 institutionelle ejere og aktionærer, der har indsendt 13D/G- eller 13F-formularer til Securities Exchange Commission (SEC). Disse institutioner har i alt 15,934,649 aktier. Største aktionærer omfatter First Light Asset Management, LLC, BlackRock, Inc., Vanguard Group Inc, Morgan Stanley, Marshall Wace, Llp, Rockefeller Capital Management L.P., Tributary Capital Management, LLC, First Eagle Investment Management, LLC, Goldman Sachs Group Inc, and Royce & Associates Lp .
Simulations Plus, Inc. (NasdaqGS:SLP) institutionel ejerskabsstruktur viser aktuelle positioner i virksomheden efter institutioner og fonde, samt seneste ændringer i positionsstørrelse. Større aktionærer kan omfatte individuelle investorer, investeringsforeninger, hedgefonde eller institutioner. Skema 13D angiver, at investoren besidder (eller besidder) mere end 5 % af virksomheden og har til hensigt (eller har til hensigt at) aktivt at forfølge en ændring i forretningsstrategi. Skema 13G indikerer en passiv investering på over 5%.
The share price as of May 1, 2026 is 14,91 / share. Previously, on May 2, 2025, the share price was 33,32 / share. This represents a decline of 55,25% over that period.

Fondens stemningsscore
Fund Sentiment Score (fka Ownership Accumulation Score) finder de aktier, der bliver mest købt af fonde. Det er resultatet af en sofistikeret, multi-faktor kvantitativ model, der identificerer virksomheder med de højeste niveauer af institutionel akkumulering. Scoringsmodellen bruger en kombination af den samlede stigning i oplyste ejere, ændringerne i porteføljeallokeringer i disse ejere og andre målinger. Tallet går fra 0 til 100, hvor højere tal indikerer et højere niveau af akkumulering for sine jævnaldrende, og 50 er gennemsnittet.
Opdateringsfrekvens: Dagligt
Se Ownership Explorer, som giver en liste over højest rangerende virksomheder.
AI+ Ask Fintel’s AI assistant about Simulations Plus, Inc..
Select a question to share a public post with an AI-crafted answer.
Thinking of good questions…
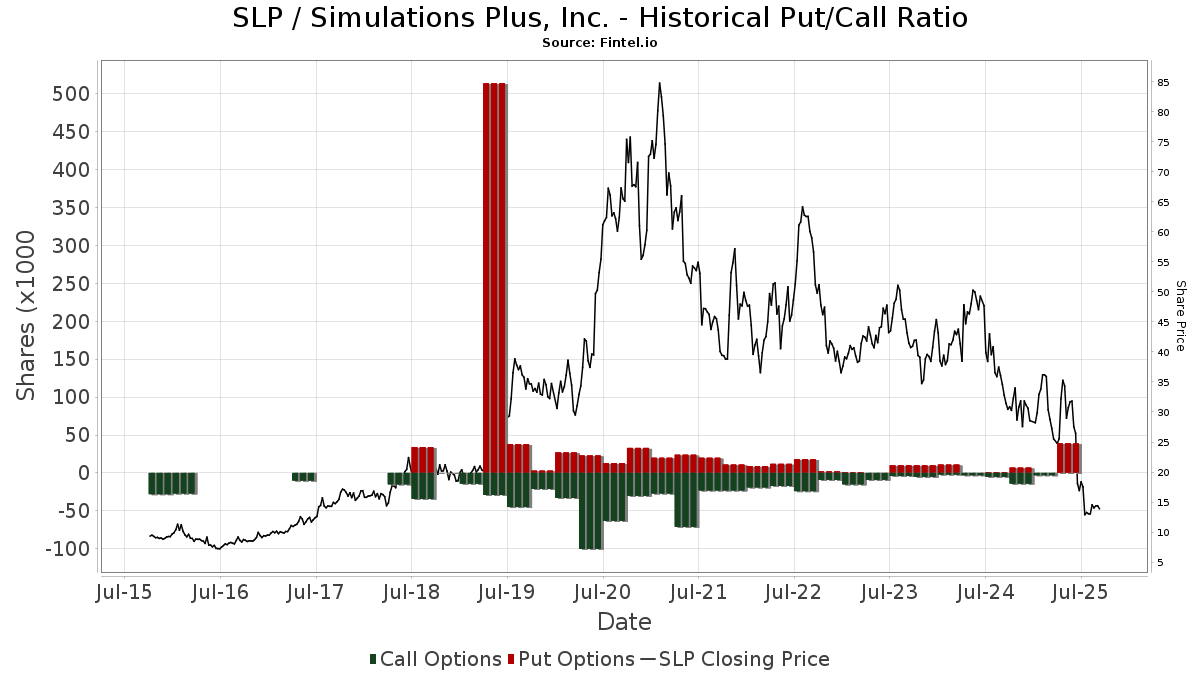
Institutionel Put/Call-forhold
Ud over at indberette standardaktie- og gældsudstedelser skal institutter med mere end 100 mill. aktiver under forvaltning også oplyse deres put- og call-optionsbeholdninger. Da salgsoptioner generelt indikerer negativ stemning, og købsoptioner indikerer positiv stemning, kan vi få en fornemmelse af den overordnede institutionelle stemning ved at plotte forholdet mellem put og kald. Diagrammet til højre viser det historiske put/call-forhold for dette instrument.
Brug af Put/Call Ratio som en indikator for investorernes stemning overvinder en af de vigtigste mangler ved at bruge totalt institutionelt ejerskab, som er, at en betydelig mængde af aktiver under forvaltning investeres passivt for at spore indekser. Passivt forvaltede fonde køber typisk ikke optioner, så indikatoren for put/call-forholdet følger mere nøje følelsen af aktivt forvaltede fonde.
13D/G-arkivering
Vi præsenterer 13D/G ansøgninger separat fra 13F ansøgninger på grund af den forskellige behandling af SEC. 13D/G-ansøgninger kan indgives af grupper af investorer (med én ledende), hvorimod 13F-ansøgninger ikke kan. Dette resulterer i situationer, hvor en investor kan indsende en 13D/G, der rapporterer én værdi for de samlede aktier (der repræsenterer alle de aktier, der ejes af investorgruppen), men derefter indsender en 13F, der rapporterer en anden værdi for de samlede aktier (der udelukkende repræsenterer deres egne) ejendomsret). Det betyder, at aktieejerskab af 13D/G-arkiver og 13F-arkiveringer ofte ikke er direkte sammenlignelige, så vi præsenterer dem separat.
Bemærk: Fra den 16. maj 2021 viser vi ikke længere ejere, der ikke har indsendt en 13D/G inden for det seneste år. Tidligere viste vi den fulde historie af 13D/G-arkiver. Generelt skal enheder, der er forpligtet til at indgive 13D/G-ansøgninger, indgive mindst årligt, før de indsender en afsluttende ansøgning. Dog forlader fonde nogle gange positioner uden at indsende en afsluttende ansøgning (dvs. de afvikler), så visning af den fulde historie resulterede nogle gange i forvirring om det nuværende ejerskab. For at undgå forvirring viser vi nu kun 'aktuelle' ejere - det vil sige - ejere, der har anmeldt inden for det seneste år.
Upgrade to unlock premium data.
| Fil dato | Form | Investor | Forrige Aktier |
Seneste Aktier |
Δ Aktier (Procent) |
Ejendomsret (Procent) |
Δ Ejerskab (Procent) |
|
|---|---|---|---|---|---|---|---|---|
| 2026-03-27 | VANGUARD GROUP INC | 1,011,706 | 0 | -100.00 | 0.00 | -100.00 | ||
| 2026-02-06 | First Light Asset Management, LLC | 2,649,879 | 13.15 | |||||
| 2025-10-02 | BlackRock, Inc. | 2,542,709 | 1,170,069 | -53.98 | 5.80 | -54.33 |
13F og NPORT arkivering
Detaljer om 13F-arkivering er gratis. Detaljer om NP-ansøgninger kræver et premium-medlemskab. Grønne rækker angiver nye positioner. Røde rækker angiver lukkede positioner. Klik på linket ikon for at se den fulde transaktionshistorik.
Opgrader
for at låse premium-data op og eksportere til Excel ![]() .
.
| Fil dato | Kilde | Investor | Type | Gennemsnitlig pris (Øst) |
Aktier | Δ Aktier (%) |
Rapporteret Værdi ($1000) |
Δ Værdi (%) |
Port Alloc (%) |
|
|---|---|---|---|---|---|---|---|---|---|---|
| 2026-01-30 | 13F | Us Bancorp \de\ | 4.119 | -33,21 | 75 | -18,48 | ||||
| 2026-02-13 | 13F | State Street Corp | 364.773 | -8,47 | 6.650 | 10,72 | ||||
| 2026-02-09 | 13F | Huntington National Bank | 463 | -22,83 | 8 | -11,11 | ||||
| 2026-02-13 | 13F | National Bank Of Canada /fi/ | 1 | 0,00 | 0 | |||||
| 2026-02-17 | 13F | Creative Planning | 21.760 | 397 | ||||||
| 2026-02-12 | 13F | Dimensional Fund Advisors Lp | 348.234 | -15,24 | 6.348 | 2,54 | ||||
| 2026-04-30 | 13F | Azzad Asset Management Inc /adv | 50.348 | 80,10 | 595 | 16,90 | ||||
| 2026-02-13 | 13F | Parkside Financial Bank & Trust | 303 | 0,00 | 6 | 25,00 | ||||
| 2026-02-17 | 13F | Glenmede Trust Co Na | 0 | -100,00 | 0 | |||||
| 2026-02-13 | 13F | Pathstone Holdings, LLC | 16.479 | 300 | ||||||
| 2026-04-30 | 13F | Kornitzer Capital Management Inc /ks | 49.545 | -3,27 | 586 | -37,30 | ||||
| 2026-02-17 | 13F | Jones Financial Companies Lllp | 47 | -92,18 | 1 | -100,00 | ||||
| 2026-02-12 | 13F | Federated Hermes, Inc. | 10.000 | -92,11 | 182 | -90,47 | ||||
| 2026-02-17 | 13F | PharVision Advisers, LLC | 0 | -100,00 | 0 | |||||
| 2026-02-13 | 13F | Citigroup Inc | 107.221 | -7,31 | 1.955 | 12,11 | ||||
| 2026-05-01 | 13F | Fifth Third Bancorp | 4.594 | 54 | ||||||
| 2026-01-14 | 13F | Nova Wealth Management, Inc. | 0 | -100,00 | 0 | |||||
| 2026-01-30 | 13F | Values First Advisors, Inc. | 0 | -100,00 | 0 | -100,00 | ||||
| 2026-02-13 | 13F | SRS Capital Advisors, Inc. | 221 | -33,43 | 4 | -20,00 | ||||
| 2026-05-01 | 13F | Concord Wealth Partners | 0 | -100,00 | 0 | |||||
| 2026-04-29 | 13F | Skopos Labs, Inc. | 0 | -100,00 | 0 | |||||
| 2026-02-13 | 13F | Marshall Wace, Llp | 569.783 | 10.387 | ||||||
| 2026-04-15 | 13F | Financial Management Professionals, Inc. | 1.087 | 0,00 | 13 | -36,84 | ||||
| 2026-04-07 | 13F | CoreCap Advisors, LLC | 231 | -0,86 | 3 | -50,00 | ||||
| 2026-02-06 | 13F | Global Retirement Partners, LLC | 119 | 2,59 | 2 | 100,00 | ||||
| 2026-02-09 | 13F | Illumine Investment Management, LLC | 32.378 | 3,09 | 590 | 24,74 | ||||
| 2026-02-13 | 13F | First National Bank Of Omaha | 17.401 | -2,13 | 317 | 18,73 | ||||
| 2026-02-17 | 13F | Alliancebernstein L.p. | 19.110 | 29,91 | 348 | 57,47 | ||||
| 2026-01-26 | 13F | Asset Dedication, LLC | 21 | 0,00 | 0 | |||||
| 2026-02-13 | 13F | Squarepoint Ops LLC | 223.084 | 1,35 | 4.067 | 22,62 | ||||
| 2026-02-17 | 13F | Bank Of America Corp /de/ | 166.423 | -54,97 | 3.034 | -45,54 | ||||
| 2026-04-29 | 13F | Navalign, LLC | 35.006 | 0,00 | 414 | -35,27 | ||||
| 2026-02-12 | 13F | New York State Common Retirement Fund | 5.934 | -9,18 | 108 | 10,20 | ||||
| 2026-02-17 | 13F | Numerai GP LLC | 0 | -100,00 | 0 | |||||
| 2026-04-29 | 13F | Hughes Financial Services, LLC | 0 | -100,00 | 0 | |||||
| 2026-02-19 | 13F | Invesco Ltd. | 26.641 | 34,70 | 486 | 62,75 | ||||
| 2026-04-02 | 13F | MJT & Associates Financial Advisory Group, Inc. | 76 | 0,00 | 1 | -100,00 | ||||
| 2026-02-09 | 13F | Legal & General Group Plc | 1.791 | -3,14 | 33 | 18,52 | ||||
| 2026-02-17 | 13F | Brevan Howard Capital Management LP | 0 | -100,00 | 0 | -100,00 | ||||
| 2026-02-06 | 13F | Larson Financial Group LLC | 393 | 22,05 | 7 | 75,00 | ||||
| 2026-02-17 | 13F | Quantinno Capital Management LP | 20.825 | 104,11 | 380 | 147,71 | ||||
| 2026-04-30 | 13F | Nisa Investment Advisors, Llc | 477 | 171,02 | 6 | 66,67 | ||||
| 2026-02-17 | 13F | Susquehanna Portfolio Strategies, LLC | 67.002 | 43,74 | 1.221 | 73,93 | ||||
| 2026-02-17 | 13F | Northern Trust Corp | 187.514 | -9,74 | 3.418 | 9,20 | ||||
| 2026-04-06 | 13F | Versant Capital Management, Inc | 4.926 | 1.125,37 | 58 | 728,57 | ||||
| 2026-02-12 | 13F | Campbell & CO Investment Adviser LLC | 10.585 | 193 | ||||||
| 2026-02-19 | 13F | CI Private Wealth, LLC | 21.795 | 397 | ||||||
| 2026-02-10 | 13F | Goldman Sachs Group Inc | 427.865 | 278,57 | 7.800 | 357,96 | ||||
| 2026-02-06 | 13F | Covestor Ltd | 3 | 0,00 | 0 | |||||
| 2026-02-11 | 13F | Simplex Trading, Llc | Put | 0 | -100,00 | 0 | ||||
| 2026-04-06 | 13F | GAMMA Investing LLC | 2.246 | 212,81 | 27 | 100,00 | ||||
| 2026-02-19 | 13F | Connective Capital Management, LLC | 0 | -100,00 | 0 | |||||
| 2026-04-13 | 13F | Massmutual Trust Co Fsb/adv | 0 | -100,00 | 0 | |||||
| 2026-02-11 | 13F | SOUTH STATE Corp | 175 | 3 | ||||||
| 2026-01-26 | 13F | Cwm, Llc | 5.480 | 160,21 | 0 | |||||
| 2026-02-11 | 13F | Group One Trading, L.p. | 0 | -100,00 | 0 | -100,00 | ||||
| 2026-05-01 | 13F | Avion Wealth | 41 | 0 | ||||||
| 2026-04-16 | 13F | SG Americas Securities, LLC | 0 | -100,00 | 0 | |||||
| 2026-05-01 | 13F | Hantz Financial Services, Inc. | 0 | -100,00 | 0 | |||||
| 2026-02-17 | 13F | Aquatic Capital Management LLC | 24.447 | -10,23 | 446 | 8,54 | ||||
| 2026-02-11 | 13F | Simplex Trading, Llc | Call | 100 | -92,86 | 2 | ||||
| 2026-02-10 | 13F | Bnp Paribas Arbitrage, Sa | 7.366 | -48,57 | 134 | -37,67 | ||||
| 2026-02-11 | 13F | Group One Trading, L.p. | Put | 700 | 0,00 | 13 | 20,00 | |||
| 2025-11-14 | 13F | Nfj Investment Group, Llc | 0 | -100,00 | 0 | -100,00 | ||||
| 2026-04-30 | 13F | Torren Management, LLC | 0 | -100,00 | 0 | |||||
| 2026-02-13 | 13F | Walleye Capital LLC | 44.302 | -71,18 | 808 | -65,16 | ||||
| 2026-02-11 | 13F | Simplex Trading, Llc | 1.971 | -53,73 | 36 | |||||
| 2026-04-28 | 13F | SBI Securities Co., Ltd. | 0 | -100,00 | 0 | |||||
| 2026-02-13 | 13F/A | Texas Permanent School Fund | 0 | -100,00 | 0 | |||||
| 2026-02-20 | 13F | Sunbelt Securities, Inc. | 19 | 0 | ||||||
| 2026-02-05 | 13F | Amalgamated Bank | 525 | -0,38 | 0 | |||||
| 2025-11-14 | 13F | Ubs Asset Management Americas Inc | 0 | -100,00 | 0 | -100,00 | ||||
| 2026-02-13 | 13F | Rhumbline Advisers | 52.362 | -8,37 | 955 | 10,80 | ||||
| 2025-11-14 | 13F | Point72 (DIFC) Ltd | 3.133 | 47 | ||||||
| 2025-11-05 | 13F | State Of Michigan Retirement System | 0 | -100,00 | 0 | -100,00 | ||||
| 2026-02-17 | 13F | Advisory Services Network, LLC | 0 | -100,00 | 0 | |||||
| 2026-04-28 | 13F | Stephens Inc /ar/ | 0 | -100,00 | 0 | |||||
| 2026-02-17 | 13F | MIRAE ASSET GLOBAL ETFS HOLDINGS Ltd. | 7.726 | -53,82 | 141 | -44,44 | ||||
| 2026-04-28 | 13F | Stephens Investment Management Group LLC | 0 | -100,00 | 0 | |||||
| 2026-02-10 | 13F | Quantbot Technologies LP | 26.511 | -55,40 | 483 | -46,03 | ||||
| 2026-02-17 | 13F | Citadel Advisors Llc | Call | 27.800 | -27,42 | 507 | -12,31 | |||
| 2026-02-17 | 13F | Citadel Advisors Llc | 277.015 | -21,43 | 5.050 | -4,97 | ||||
| 2026-02-13 | 13F | Morgan Stanley | 1.000.149 | -22,91 | 18.233 | -6,75 | ||||
| 2025-11-07 | 13F | Sierra Ocean, Llc | 0 | -100,00 | 0 | |||||
| 2026-01-30 | 13F | Skylands Capital, LLC | 0 | -100,00 | 0 | |||||
| 2026-02-13 | 13F | Herald Investment Management Ltd | 200.000 | 0,00 | 3.642 | 20,76 | ||||
| 2026-02-17 | 13F | Leonteq Securities AG | 0 | -100,00 | 0 | |||||
| 2025-11-13 | 13F | Prudential Financial Inc | 0 | -100,00 | 0 | -100,00 | ||||
| 2026-01-27 | 13F | Zurcher Kantonalbank (Zurich Cantonalbank) | 37.000 | 32,14 | 675 | 60,10 | ||||
| 2026-02-17 | 13F | Susquehanna International Group, Llp | Put | 0 | -100,00 | 0 | ||||
| 2026-02-12 | 13F | BlackRock, Inc. | 1.256.672 | 2,59 | 22.909 | 24,10 | ||||
| 2026-02-09 | 13F | Royce & Associates Lp | 402.416 | 15,39 | 7.336 | 39,60 | ||||
| 2026-02-17 | 13F | Schonfeld Strategic Advisors LLC | 33.009 | 187,53 | 602 | 247,40 | ||||
| 2026-02-13 | 13F | First Trust Advisors Lp | 18.794 | 69,99 | 343 | 106,02 | ||||
| 2026-02-17 | 13F | Susquehanna International Group, Llp | 0 | -100,00 | 0 | |||||
| 2026-02-06 | 13F | Nano Cap New Millennium Growth Fund L P | 97.000 | 1.768 | ||||||
| 2026-02-09 | 13F | Connors Investor Services Inc | 15.570 | -27,82 | 284 | -12,92 | ||||
| 2026-02-17 | 13F | Canada Pension Plan Investment Board | 2.900 | 190,00 | 53 | 246,67 | ||||
| 2025-11-05 | 13F | Ranger Investment Management, L.P. | 0 | -100,00 | 0 | |||||
| 2026-02-10 | 13F | Rothschild Investment Llc | 107 | -37,06 | 2 | -50,00 | ||||
| 2026-02-06 | 13F | Pnc Financial Services Group, Inc. | 2.816 | -1,92 | 51 | 18,60 | ||||
| 2025-11-14 | 13F | Cubist Systematic Strategies, LLC | 82.373 | 1.241 | ||||||
| 2025-11-14 | 13F | Point72 Europe (London) LLP | 554 | 8 | ||||||
| 2026-02-17 | 13F | D. E. Shaw & Co., Inc. | 225.981 | 3,75 | 4.120 | 25,50 | ||||
| 2026-02-13 | 13F | DC Investments Management, LLC | 0 | -100,00 | 0 | |||||
| 2026-02-11 | 13F | LPL Financial LLC | 48.734 | 79,41 | 888 | 117,11 | ||||
| 2026-02-17 | 13F | Crawford Investment Counsel Inc | 0 | -100,00 | 0 | |||||
| 2026-04-27 | 13F | Td Private Client Wealth Llc | 42 | -49,40 | 0 | -100,00 | ||||
| 2026-02-10 | 13F | Connor, Clark & Lunn Investment Management Ltd. | 66.305 | 1.209 | ||||||
| 2026-04-24 | 13F | Strs Ohio | 200 | 0,00 | 2 | -33,33 | ||||
| 2026-04-30 | 13F | Private Trust Co Na | 602 | 0,00 | 7 | -30,00 | ||||
| 2026-04-23 | 13F | Harbor Investment Advisory, Llc | 400 | 0,00 | 5 | -42,86 | ||||
| 2026-02-05 | 13F | HighMark Wealth Management LLC | 367 | 0,00 | 7 | 20,00 | ||||
| 2026-02-17 | 13F | First Light Asset Management, LLC | 1.968.917 | 156,45 | 35.893 | 210,22 | ||||
| 2026-04-24 | 13F | UMA Financial Services, Inc. | 88 | 1 | ||||||
| 2025-11-06 | 13F | Versor Investments LP | 0 | -100,00 | 0 | -100,00 | ||||
| 2026-02-17 | 13F | Balyasny Asset Management Llc | 37.479 | 683 | ||||||
| 2026-02-10 | 13F | Natixis Advisors, L.p. | 23.707 | 7,58 | 0 | |||||
| 2026-02-13 | 13F | Sei Investments Co | 30.458 | 34,25 | 555 | 62,76 | ||||
| 2026-02-12 | 13F | Steward Partners Investment Advisory, Llc | 100 | -11,50 | 2 | 0,00 | ||||
| 2025-11-14 | 13F | Point72 Asia (Singapore) Pte. Ltd. | 16.266 | 245 | ||||||
| 2026-04-20 | 13F | Ronald Blue Trust, Inc. | 0 | -100,00 | 0 | |||||
| 2026-02-13 | 13F | Charles Schwab Investment Management Inc | 150.986 | 8,62 | 2.752 | 31,42 | ||||
| 2026-02-13 | 13F | Kayne Anderson Rudnick Investment Management Llc | 1.487 | 0,00 | 27 | 22,73 | ||||
| 2025-11-14 | 13F | ExodusPoint Capital Management, LP | 60.028 | 440,31 | 905 | |||||
| 2026-02-13 | 13F | Caitong International Asset Management Co., Ltd | 5.038 | 460,40 | 92 | 600,00 | ||||
| 2026-02-09 | 13F | Quest Partners LLC | 2.831 | -74,81 | 52 | -69,82 | ||||
| 2026-04-07 | 13F | Farther Finance Advisors, LLC | 34 | -96,95 | 0 | -100,00 | ||||
| 2026-02-17 | 13F | Point72 Asset Management, L.P. | 130.933 | 2.387 | ||||||
| 2026-01-14 | 13F | Hennion & Walsh Asset Management, Inc. | 35.432 | 23,22 | 646 | 48,96 | ||||
| 2026-04-22 | 13F | Janney Montgomery Scott LLC | 11.014 | 0 | ||||||
| 2026-04-29 | 13F | Police & Firemen's Retirement System of New Jersey | 5.225 | 0,00 | 62 | -35,79 | ||||
| 2026-02-11 | 13F | Franklin Resources Inc | 11.233 | 205 | ||||||
| 2026-01-20 | 13F | Savvy Advisors, Inc. | 10.172 | 0,04 | 185 | 20,92 | ||||
| 2026-04-24 | 13F | SOL Capital Management CO | 13.960 | 468 | ||||||
| 2026-02-17 | 13F | Tower Research Capital LLC (TRC) | 485 | -71,40 | 9 | -68,00 | ||||
| 2025-11-07 | 13F | BNP Paribas Asset Management Holding S.A. | 0 | -100,00 | 0 | |||||
| 2026-02-13 | 13F | Umb Bank N A/mo | 575 | 1.073,47 | 10 | |||||
| 2026-04-13 | 13F | IFP Advisors, Inc | 49 | -55,45 | 1 | -100,00 | ||||
| 2026-02-11 | 13F | Jpmorgan Chase & Co | 130.280 | -22,29 | 2.375 | -5,98 | ||||
| 2025-11-14 | 13F | Fred Alger Management, Llc | 0 | -100,00 | 0 | -100,00 | ||||
| 2026-02-12 | 13F | Ankerstar Wealth, LLC | 6 | 0 | ||||||
| 2026-02-13 | 13F | Rice Hall James & Associates, Llc | 70.185 | 6,20 | 1.279 | 28,54 | ||||
| 2026-02-17 | 13F | Optiver Holding B.V. | 32 | 0,00 | 1 | |||||
| 2026-02-05 | 13F | Allworth Financial LP | 157 | 227,08 | 3 | |||||
| 2026-02-17 | 13F | Engineers Gate Manager LP | 17.851 | -21,93 | 325 | -5,52 | ||||
| 2026-01-27 | 13F | Tributary Capital Management, LLC | 520.855 | -8,38 | 9.495 | 10,83 | ||||
| 2025-11-14 | 13F | Centiva Capital, LP | 0 | -100,00 | 0 | -100,00 | ||||
| 2026-02-03 | 13F | Broadwater Capital Management Llc | 700 | 0,00 | 13 | 20,00 | ||||
| 2026-02-17 | 13F | Bridgeway Capital Management Inc | 23.500 | 428 | ||||||
| 2026-01-29 | 13F | UBS Group AG | 76.955 | -68,15 | 1.403 | -61,48 | ||||
| 2026-04-21 | 13F | Wedbush Securities Inc | 10.548 | 4,98 | 0 | |||||
| 2025-11-24 | 13F | CIBC Private Wealth Group, LLC | 0 | -100,00 | 0 | -100,00 | ||||
| 2026-02-13 | 13F | Palisade Asset Management, LLC | 0 | -100,00 | 0 | |||||
| 2025-11-17 | 13F | Great West Life Assurance Co /can/ | 0 | -100,00 | 0 | |||||
| 2026-04-23 | 13F | North Star Investment Management Corp. | 197.330 | 17,37 | 2.332 | -23,92 | ||||
| 2026-02-09 | 13F | King Luther Capital Management Corp | 16.000 | 292 | ||||||
| 2026-02-17 | 13F | Price T Rowe Associates Inc /md/ | 10.192 | 0 | ||||||
| 2026-02-09 | 13F | Geode Capital Management, Llc | 399.811 | 1,45 | 7.290 | 22,71 | ||||
| 2026-02-17 | 13F | Aqr Capital Management Llc | 101.979 | 288,21 | 1.859 | 370,63 | ||||
| 2025-11-14 | 13F | Weiss Asset Management LP | 47.069 | 709 | ||||||
| 2025-11-12 | 13F | Teachers Retirement System Of The State Of Kentucky | 0 | -100,00 | 0 | |||||
| 2025-11-13 | 13F | Ensign Peak Advisors, Inc | 0 | -100,00 | 0 | -100,00 | ||||
| 2026-04-22 | 13F | Sterling Capital Management LLC | 109 | 0,00 | 1 | 0,00 | ||||
| 2026-04-10 | 13F | Kopion Asset Management, LLC | 222.443 | 65,52 | 2.629 | 7,35 | ||||
| 2026-02-17 | 13F | California State Teachers Retirement System | 1.028 | -10,76 | 19 | 5,88 | ||||
| 2026-02-13 | 13F | Quarry LP | 542 | -70,89 | 10 | -67,86 | ||||
| 2026-02-17 | 13F | Ameriprise Financial Inc | 0 | -100,00 | 0 | |||||
| 2026-02-09 | 13F | Harbour Investments, Inc. | 3 | 0 | ||||||
| 2026-02-17 | 13F | PDT Partners, LLC | 95.792 | 49,17 | 1.746 | 80,56 | ||||
| 2026-02-12 | 13F | Jane Street Group, Llc | 169.053 | -16,48 | 3.082 | 1,02 | ||||
| 2026-04-23 | 13F | SJS Investment Consulting Inc. | 9 | 0 | ||||||
| 2026-02-02 | 13F | Principal Financial Group Inc | 47.823 | 47,61 | 872 | 78,48 | ||||
| 2026-02-13 | 13F | Wells Fargo & Company/mn | 76.099 | 0,80 | 1.387 | 21,99 | ||||
| 2026-01-15 | 13F | Fortitude Family Office, LLC | 0 | -100,00 | 0 | |||||
| 2026-02-17 | 13F | Two Sigma Investments, Lp | 224.053 | 146,96 | 4.084 | 198,76 | ||||
| 2025-11-07 | 13F | Fiera Capital Corp | 0 | -100,00 | 0 | -100,00 | ||||
| 2025-11-13 | 13F | Dynamic Technology Lab Private Ltd | 0 | -100,00 | 0 | |||||
| 2026-02-14 | 13F | Rockefeller Capital Management L.P. | 557.866 | -25,21 | 10.170 | -9,54 | ||||
| 2026-04-28 | 13F | Harbor Capital Advisors, Inc. | 4.599 | 10.120,00 | 0 | |||||
| 2026-02-06 | 13F | EverSource Wealth Advisors, LLC | 69 | 146,43 | 1 | |||||
| 2026-02-17 | 13F | XTX Topco Ltd | 0 | -100,00 | 0 | |||||
| 2026-02-17 | 13F | Advisor Group Holdings, Inc. | 17.032 | -2,64 | 310 | 25,00 | ||||
| 2026-02-13 | 13F | Barclays Plc | 26.631 | 8,74 | 485 | 31,44 | ||||
| 2026-02-06 | 13F | Gsa Capital Partners Llp | 62.322 | 167,90 | 1 | |||||
| 2025-11-14 | 13F | Deerfield Management Company, L.p. (series C) | 0 | -100,00 | 0 | |||||
| 2025-11-07 | 13F | Summitry Llc | 0 | -100,00 | 0 | |||||
| 2026-02-17 | 13F | Jump Financial, LLC | 0 | -100,00 | 0 | |||||
| 2026-02-17 | 13F | Two Sigma Advisers, Lp | 55.900 | 282,88 | 1.019 | 363,18 | ||||
| 2026-02-17 | 13F | Russell Investments Group, Ltd. | 1.922 | -3,95 | 35 | 16,67 | ||||
| 2026-02-09 | 13F | Atlantic Trust, LLC | 0 | -100,00 | 0 | |||||
| 2026-02-12 | 13F | Hrt Financial Lp | 0 | -100,00 | 0 | |||||
| 2026-04-30 | 13F | Hsbc Holdings Plc | 26.494 | 305 | ||||||
| 2026-01-29 | 13F | Vanguard Group Inc | 1.011.706 | 3,82 | 18.443 | 25,59 | ||||
| 2026-02-04 | 13F | First Eagle Investment Management, LLC | 457.155 | 1.898,06 | 8.334 | 2.322,38 | ||||
| 2026-02-17 | 13F | Petrus Trust Company, LTA | 0 | -100,00 | 0 | |||||
| 2026-04-07 | 13F | Green Alpha Advisors, LLC | 13.706 | -2,97 | 162 | -36,96 | ||||
| 2026-04-13 | 13F | True Wealth Design, LLC | 53 | 12,77 | 1 | |||||
| 2025-11-14 | 13F | Wellington Management Group Llp | 0 | -100,00 | 0 | |||||
| 2026-02-13 | 13F | Kennedy Capital Management, Inc. | 398.902 | 7,76 | 7.272 | 30,35 | ||||
| 2026-02-17 | 13F | Janus Henderson Group Plc | 53.362 | 973 | ||||||
| 2026-02-17 | 13F | Graham Capital Management, L.P. | 0 | -100,00 | 0 | |||||
| 2026-02-13 | 13F | Verition Fund Management LLC | 21.095 | -34,23 | 385 | -20,50 | ||||
| 2026-02-11 | 13F | Deutsche Bank Ag\ | 15.825 | 5,85 | 288 | 28,00 | ||||
| 2026-02-10 | 13F | State of Wyoming | 8.554 | -5,20 | 156 | 14,81 | ||||
| 2026-02-17 | 13F | Royal Bank Of Canada | 25.467 | -65,87 | 465 | -58,63 | ||||
| 2026-02-04 | 13F | Nicholas Company, Inc. | 262.712 | 42,89 | 4.789 | 72,89 | ||||
| 2026-02-11 | 13F | Fox Run Management, L.l.c. | 17.414 | 317 | ||||||
| 2026-02-12 | 13F | Quadrant Capital Group Llc | 147 | 3 | ||||||
| 2025-11-21 | 13F | Nebula Research & Development LLC | 0 | -100,00 | 0 | |||||
| 2026-02-10 | 13F | Mutual Of America Capital Management Llc | 0 | -100,00 | 0 | |||||
| 2026-02-11 | 13F | Los Angeles Capital Management Llc | 97 | 2 | ||||||
| 2025-11-04 | 13F | Thrivent Financial For Lutherans | 0 | -100,00 | 0 | |||||
| 2026-02-11 | 13F | Gwn Securities Inc. | 17.283 | 315 | ||||||
| 2025-11-06 | 13F | Public Sector Pension Investment Board | 0 | -100,00 | 0 | -100,00 | ||||
| 2026-02-17 | 13F | Tudor Investment Corp Et Al | 116.685 | -2,84 | 2.127 | 17,58 | ||||
| 2026-02-12 | 13F | MetLife Investment Management, LLC | 9.214 | 0,00 | 168 | 21,01 | ||||
| 2026-02-05 | 13F | Bessemer Group Inc | 640 | 1.388,37 | 0 | |||||
| 2026-02-11 | 13F | Group One Trading, L.p. | Call | 0 | -100,00 | 0 | -100,00 | |||
| 2026-04-20 | 13F | Inscription Capital, LLC | 15.620 | 185 | ||||||
| 2026-02-17 | 13F | Citadel Advisors Llc | Put | 0 | -100,00 | 0 | ||||
| 2026-02-13 | 13F | Smartleaf Asset Management LLC | 772 | 48,18 | 14 | 100,00 | ||||
| 2026-02-13 | 13F | Meros Investment Management, LP | 339.242 | 6.184 | ||||||
| 2026-02-17 | 13F | Sio Capital Management, LLC | 0 | -100,00 | 0 | |||||
| 2026-02-17 | 13F | Public Employees Retirement System Of Ohio | 32.799 | 0,00 | 598 | 20,85 | ||||
| 2025-11-13 | 13F | Swiss National Bank | 0 | -100,00 | 0 | |||||
| 2025-11-14 | 13F | Raymond James Financial Inc | 0 | -100,00 | 0 | -100,00 | ||||
| 2026-02-11 | 13F | Cerity Partners LLC | 23.725 | 36,01 | 481 | 72,40 | ||||
| 2026-01-28 | 13F | Salomon & Ludwin, LLC | 68 | 0,00 | 1 | 0,00 | ||||
| 2026-04-10 | 13F | Linden Thomas Advisory Services, LLC | 21.245 | 251 | ||||||
| 2026-01-29 | 13F | Comerica Bank | 4.161 | -1,65 | 76 | 19,05 | ||||
| 2026-02-06 | 13F | Prescott Group Capital Management, L.l.c. | 100.885 | 26,11 | 1.839 | 52,61 | ||||
| 2026-02-12 | 13F | Principal Securities, Inc. | 0 | -100,00 | 0 | |||||
| 2026-02-11 | 13F | Ameritas Investment Partners, Inc. | 1.576 | 29 | ||||||
| 2026-04-24 | 13F | Root Financial Partners, LLC | 162 | 2 | ||||||
| 2026-02-18 | 13F | State of Tennessee, Treasury Department | 0 | -100,00 | 0 | |||||
| 2026-02-17 | 13F | Millennium Management Llc | 147.490 | -51,80 | 2.689 | -41,70 | ||||
| 2026-02-17 | 13F | Fmr Llc | 4.494 | 26,70 | 82 | 52,83 | ||||
| 2026-02-10 | 13F | Bank of New York Mellon Corp | 62.748 | 30,99 | 1.144 | 58,53 | ||||
| 2026-02-12 | 13F | Renaissance Technologies Llc | 20.000 | 365 | ||||||
| 2026-04-30 | 13F | Nuveen, LLC | 39.684 | 0,75 | 469 | -34,68 | ||||
| 2026-02-10 | 13F | Envestnet Asset Management Inc | 196.337 | 1,27 | 3.579 | 22,53 |