Grundlæggende statistik
| Institutionelle ejere | 117 total, 117 long only, 0 short only, 0 long/short - change of 21,88% MRQ |
| Gennemsnitlig porteføljeallokering | 0.3671 % - change of -54,40% MRQ |
| Institutionelle aktier (lange) | 5.734.203 (ex 13D/G) - change of -0,78MM shares -12,00% MRQ |
| Institutionel værdi (lang) | $ 150.663 USD ($1000) |
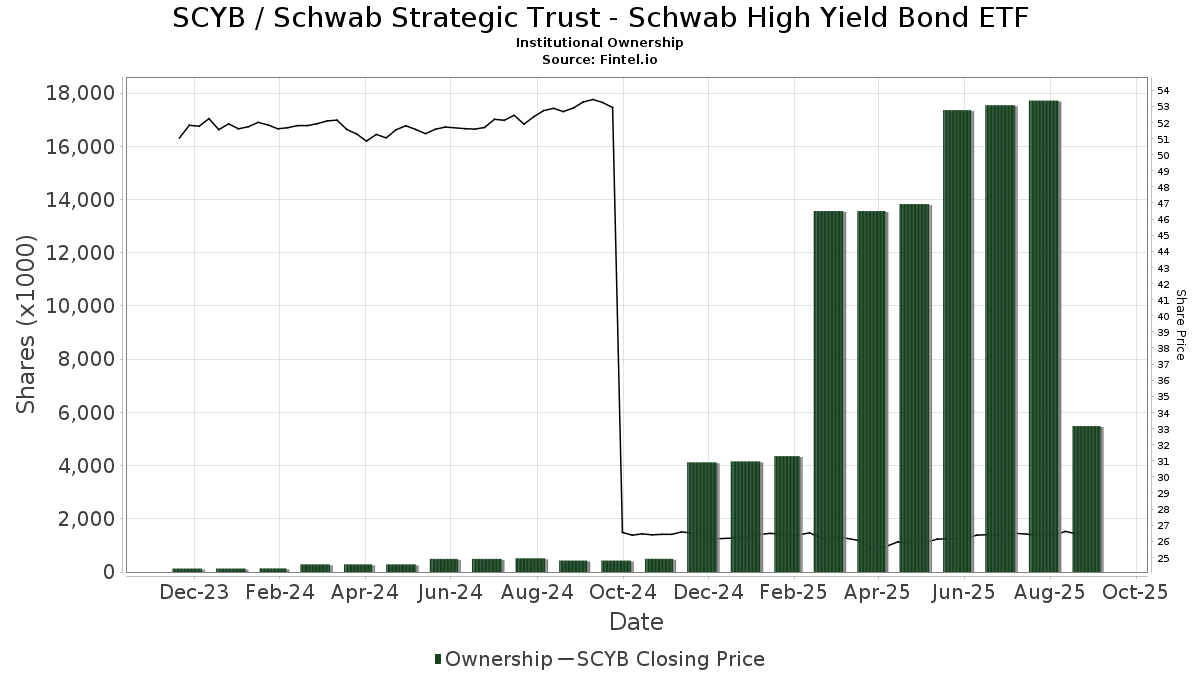
Institutionelt ejerskab og aktionærer
Schwab Strategic Trust - Schwab High Yield Bond ETF (US:SCYB) har 117 institutionelle ejere og aktionærer, der har indsendt 13D/G- eller 13F-formularer til Securities Exchange Commission (SEC). Disse institutioner har i alt 5,734,203 aktier. Største aktionærer omfatter Toroso Investments, LLC, Cornerstone Enterprises, Llc, Charles Schwab Trust Co, Dahring | Cusmano Llc, Jones Financial Companies Lllp, Strategic Financial Planning, Inc., Breakthru Advisory Services, Llc, L2 Asset Management, LLC, Principia Wealth Advisory, LLC, and Gts Securities Llc .
Schwab Strategic Trust - Schwab High Yield Bond ETF (ARCA:SCYB) institutionel ejerskabsstruktur viser aktuelle positioner i virksomheden efter institutioner og fonde, samt seneste ændringer i positionsstørrelse. Større aktionærer kan omfatte individuelle investorer, investeringsforeninger, hedgefonde eller institutioner. Skema 13D angiver, at investoren besidder (eller besidder) mere end 5 % af virksomheden og har til hensigt (eller har til hensigt at) aktivt at forfølge en ændring i forretningsstrategi. Skema 13G indikerer en passiv investering på over 5%.
The share price as of March 26, 2026 is 25,81 / share. Previously, on March 27, 2025, the share price was 26,10 / share. This represents a decline of 1,11% over that period.
Fondens stemningsscore
Fund Sentiment Score (fka Ownership Accumulation Score) finder de aktier, der bliver mest købt af fonde. Det er resultatet af en sofistikeret, multi-faktor kvantitativ model, der identificerer virksomheder med de højeste niveauer af institutionel akkumulering. Scoringsmodellen bruger en kombination af den samlede stigning i oplyste ejere, ændringerne i porteføljeallokeringer i disse ejere og andre målinger. Tallet går fra 0 til 100, hvor højere tal indikerer et højere niveau af akkumulering for sine jævnaldrende, og 50 er gennemsnittet.
Opdateringsfrekvens: Dagligt
Se Ownership Explorer, som giver en liste over højest rangerende virksomheder.
AI+ Ask Fintel’s AI assistant about Schwab Strategic Trust - Schwab High Yield Bond ETF.
Select a question to share a public post with an AI-crafted answer.
Thinking of good questions…
Institutionel Put/Call-forhold
Ud over at indberette standardaktie- og gældsudstedelser skal institutter med mere end 100 mill. aktiver under forvaltning også oplyse deres put- og call-optionsbeholdninger. Da salgsoptioner generelt indikerer negativ stemning, og købsoptioner indikerer positiv stemning, kan vi få en fornemmelse af den overordnede institutionelle stemning ved at plotte forholdet mellem put og kald. Diagrammet til højre viser det historiske put/call-forhold for dette instrument.
Brug af Put/Call Ratio som en indikator for investorernes stemning overvinder en af de vigtigste mangler ved at bruge totalt institutionelt ejerskab, som er, at en betydelig mængde af aktiver under forvaltning investeres passivt for at spore indekser. Passivt forvaltede fonde køber typisk ikke optioner, så indikatoren for put/call-forholdet følger mere nøje følelsen af aktivt forvaltede fonde.
13F og NPORT arkivering
Detaljer om 13F-arkivering er gratis. Detaljer om NP-ansøgninger kræver et premium-medlemskab. Grønne rækker angiver nye positioner. Røde rækker angiver lukkede positioner. Klik på linket ikon for at se den fulde transaktionshistorik.
Opgrader
for at låse premium-data op og eksportere til Excel ![]() .
.
| Fil dato | Kilde | Investor | Type | Gennemsnitlig pris (Øst) |
Aktier | Δ Aktier (%) |
Rapporteret Værdi ($1000) |
Δ Værdi (%) |
Port Alloc (%) |
|
|---|---|---|---|---|---|---|---|---|---|---|
| 2026-02-12 | 13F | JT Stratford LLC | 87.385 | 25,97 | 2.309 | 24,49 | ||||
| 2026-01-14 | 13F | Spire Wealth Management | 13.451 | 60,97 | 355 | 59,19 | ||||
| 2025-11-13 | 13F | Brown Brothers Harriman & Co | 0 | -100,00 | 0 | |||||
| 2026-01-29 | 13F | Camelot Portfolios, LLC | 20 | 1 | ||||||
| 2026-02-11 | 13F | Teachers Insurance & Annuity Association Of America | 738 | 19 | ||||||
| 2026-02-11 | 13F | MCF Advisors LLC | 0 | -100,00 | 0 | |||||
| 2026-02-13 | 13F | Smartleaf Asset Management LLC | 10 | 0,00 | 0 | |||||
| 2026-02-11 | 13F | O'shaughnessy Asset Management, Llc | 1 | 0,00 | 0 | |||||
| 2026-02-17 | 13F | Ancora Advisors, LLC | 1.266 | 33 | ||||||
| 2026-02-18 | 13F | GWM Advisors LLC | 167 | -64,54 | 4 | -66,67 | ||||
| 2026-02-05 | 13F | AlphaCore Capital LLC | 19 | -98,26 | 1 | -100,00 | ||||
| 2025-10-02 | 13F | Ahl Investment Management, Inc. | 20.759 | 555 | ||||||
| 2026-01-21 | 13F | Flagship Harbor Advisors, Llc | 222 | 6 | ||||||
| 2025-10-15 | 13F | Mb, Levis & Associates, Llc | 0 | -100,00 | 0 | |||||
| 2025-09-29 | NP | SMIDX - SMI Dynamic Allocation Fund | 104.230 | -23,69 | 2.755 | -22,34 | ||||
| 2026-02-04 | 13F | Meridian Wealth Management, LLC | 16.722 | 95,81 | 442 | 93,42 | ||||
| 2026-02-09 | 13F | Solutions 4 Wealth, Ltd | 13.208 | 349 | ||||||
| 2026-02-17 | 13F | Royal Bank Of Canada | 130 | -52,55 | 3 | -57,14 | ||||
| 2026-01-15 | 13F | Brookstone Capital Management | 10.937 | 2,25 | 289 | 1,05 | ||||
| 2026-02-05 | 13F | Cambridge Investment Research Advisors, Inc. | 13.286 | -4,27 | 0 | |||||
| 2026-02-10 | 13F | Natixis Advisors, L.p. | 14.052 | 0 | ||||||
| 2025-11-14 | 13F | Raymond James Financial Inc | 0 | -100,00 | 0 | |||||
| 2026-02-13 | 13F | Baird Financial Group, Inc. | 57.619 | 1.522 | ||||||
| 2026-02-17 | 13F | Cetera Investment Advisers | 38.046 | 6,80 | 1.005 | 5,57 | ||||
| 2026-01-16 | 13F | PFS Partners, LLC | 221 | 0,00 | 6 | 0,00 | ||||
| 2026-02-04 | 13F | Pensionmark Financial Group, Llc | 60.164 | 12,41 | 1.582 | 10,63 | ||||
| 2025-09-29 | NP | SMILX - SMI 50/40/10 Fund | 37.270 | -24,36 | 985 | -22,99 | ||||
| 2026-01-23 | 13F | Carnegie Capital Asset Management, LLC | 24.449 | 646 | ||||||
| 2026-02-11 | 13F | TT Capital Management LLC | 15.600 | 0,00 | 412 | -0,96 | ||||
| 2026-02-17 | 13F | Mercer Global Advisors Inc /adv | 16.471 | 37,79 | 435 | 36,36 | ||||
| 2026-02-18 | 13F | EP Wealth Advisors, Inc. | 19.610 | 518 | ||||||
| 2026-02-03 | 13F | Mma Asset Management Llc | 75.441 | 4,98 | 1.993 | 3,80 | ||||
| 2026-02-12 | 13F | BlackRock, Inc. | 551 | 0,00 | 15 | 0,00 | ||||
| 2026-01-12 | 13F | Breakthru Advisory Services, Llc | 229.327 | 12,85 | 6.059 | 11,52 | ||||
| 2026-01-23 | 13F | Farther Finance Advisors, LLC | 7.251 | -4,07 | 192 | -5,45 | ||||
| 2026-02-05 | 13F | Dahring | Cusmano Llc | 323.169 | 15,93 | 8.538 | 14,59 | ||||
| 2026-02-17 | 13F | Cape Investment Advisory, Inc. | 81 | 2 | ||||||
| 2026-02-13 | 13F | LGT Financial Advisors LLC | 0 | -100,00 | 0 | |||||
| 2026-01-06 | 13F | Nelson, Van Denburg & Campbell Wealth Management Group, LLC | 30.467 | 805 | ||||||
| 2026-01-08 | 13F | Bennett Selby Investments Lp | 11.076 | -61,70 | 293 | -62,18 | ||||
| 2026-02-06 | 13F | Integral Investment Advisors, Inc. | 14.406 | 18,66 | 381 | 17,28 | ||||
| 2025-10-30 | 13F | iA Global Asset Management Inc. | 0 | -100,00 | 0 | |||||
| 2026-01-29 | 13F | OMNI 360 Wealth, Inc. | 26.553 | 1,93 | 706 | 1,29 | ||||
| 2026-01-21 | 13F | Sound Income Strategies, LLC | 16 | 0,00 | 0 | |||||
| 2026-02-11 | 13F | Buckingham Strategic Partners | 27.043 | -19,98 | 714 | -20,04 | ||||
| 2026-02-06 | 13F | Larson Financial Group LLC | 1.426 | 0,35 | 38 | 0,00 | ||||
| 2026-02-13 | 13F | Gts Securities Llc | 145.343 | 3.840 | ||||||
| 2026-02-13 | 13F | FF Advisors,LLC | 43.754 | 1.156 | ||||||
| 2026-02-11 | 13F | LPL Financial LLC | 8.815 | 233 | ||||||
| 2026-02-05 | 13F | Allworth Financial LP | 386 | 4,89 | 10 | 11,11 | ||||
| 2026-02-12 | 13F | Bank Of Montreal /can/ | 1.047 | -4,99 | 28 | -6,90 | ||||
| 2026-02-12 | 13F | Steward Partners Investment Advisory, Llc | 3.431 | 91 | ||||||
| 2026-02-17 | 13F | Advisor Group Holdings, Inc. | 14.198 | 72,18 | 375 | 71,23 | ||||
| 2026-01-22 | 13F | Elm3 Financial Group, LLC | 63.726 | 1.684 | ||||||
| 2026-01-30 | 13F | Bogart Wealth, LLC | 29.008 | 1,87 | 766 | 0,66 | ||||
| 2026-01-30 | 13F | Kohmann Bosshard Financial Services, LLC | 3.331 | 88 | ||||||
| 2026-02-13 | 13F | Toroso Investments, LLC | 1.147.384 | -28,95 | 30.314 | -29,38 | ||||
| 2026-02-17 | 13F | Windsor Advisory Group, LLC | 21.763 | 575 | ||||||
| 2026-02-05 | 13F | Evergreen Advisors, LLC | 24.010 | 9,14 | 634 | 8,75 | ||||
| 2026-02-10 | 13F | Root Financial Partners, LLC | 174 | 234,62 | 5 | 300,00 | ||||
| 2026-02-06 | 13F | Pnc Financial Services Group, Inc. | 741 | 191,73 | 20 | 216,67 | ||||
| 2026-02-09 | 13F | Hartland & Co., LLC | 104 | 0,00 | 3 | 0,00 | ||||
| 2026-02-17 | 13F | Fmr Llc | 2.272 | 261,21 | 60 | 275,00 | ||||
| 2026-02-13 | 13F | Clearview Wealth Advisors LLC | 17.977 | 98,42 | 475 | 95,87 | ||||
| 2026-02-13 | 13F | Mariner, LLC | 8.755 | 231 | ||||||
| 2025-11-14 | 13F | Old Mission Capital Llc | 0 | -100,00 | 0 | |||||
| 2026-02-12 | 13F | Jane Street Group, Llc | 29.403 | 777 | ||||||
| 2026-02-13 | 13F | L2 Asset Management, LLC | 229.194 | 3,16 | 6.055 | 1,97 | ||||
| 2026-02-17 | 13F | Jones Financial Companies Lllp | 246.576 | 140,50 | 6.515 | 138,35 | ||||
| 2026-01-27 | 13F | Financial Management Professionals, Inc. | 14 | 0,00 | 0 | |||||
| 2026-02-12 | 13F | Summit Financial, LLC | 130.589 | 3.450 | ||||||
| 2026-02-13 | 13F | Asset Allocation Strategies LLC | 26.861 | 4,77 | 710 | 3,50 | ||||
| 2025-10-28 | 13F | Wolff Wiese Magana Llc | 0 | -100,00 | 0 | |||||
| 2025-11-19 | 13F | Captrust Financial Advisors | 0 | -100,00 | 0 | |||||
| 2026-01-07 | 13F | Mfg Wealth Management, Inc. | 89.609 | -0,13 | 2.367 | -1,29 | ||||
| 2026-01-09 | 13F | Charles Schwab Trust Co | 434.937 | 3,34 | 11.491 | 2,14 | ||||
| 2025-10-20 | 13F | Mid-American Wealth Advisory Group, Inc. | 0 | -100,00 | 0 | |||||
| 2026-02-13 | 13F | MAI Capital Management | 25 | 0,00 | 1 | |||||
| 2026-02-04 | 13F | Tsfg, Llc | 100 | 0,00 | 0 | |||||
| 2026-02-11 | 13F | Empowered Funds, LLC | 62.804 | -71,05 | 1.659 | -71,23 | ||||
| 2026-02-06 | 13F | Cullen/frost Bankers, Inc. | 0 | -100,00 | 0 | |||||
| 2026-01-23 | 13F | Creative Capital Management Investments LLC | 45 | 1 | ||||||
| 2026-02-11 | 13F | Jpmorgan Chase & Co | 2.254 | 566,86 | 60 | 555,56 | ||||
| 2026-02-13 | 13F | Ausdal Financial Partners, Inc. | 13.338 | 2,43 | 352 | 1,15 | ||||
| 2026-02-11 | 13F | Peachtree Investment Partners, LLC | 343 | 2,08 | 9 | 12,50 | ||||
| 2026-02-11 | 13F | Franklin Resources Inc | 103 | 3 | ||||||
| 2026-02-04 | 13F | Naples Global Advisors, Llc | 7.975 | 211 | ||||||
| 2026-02-17 | 13F | Northern Trust Corp | 49.092 | 1.297 | ||||||
| 2026-02-06 | 13F | Creative Financial Designs Inc /adv | 10.554 | 8,38 | 279 | 6,92 | ||||
| 2026-02-14 | 13F | Howe & Rusling Inc | 2.074 | 367,12 | 55 | 390,91 | ||||
| 2026-02-19 | 13F | CI Private Wealth, LLC | 15.913 | 420 | ||||||
| 2025-11-14 | 13F | Flow Traders U.s. Llc | 0 | -100,00 | 0 | |||||
| 2026-02-17 | 13F | Capasso Planning Partners LLC | 0 | -100,00 | 0 | |||||
| 2026-01-27 | 13F | Forum Financial Management, LP | 19.726 | 3,68 | 521 | 2,56 | ||||
| 2026-02-12 | 13F | Commonwealth Equity Services, Llc | 18.907 | 40,46 | 500 | |||||
| 2026-02-12 | 13F | CIBC Private Wealth Group, LLC | 0 | -100,00 | 0 | |||||
| 2026-02-17 | 13F | Wiley Bros.-aintree Capital, Llc | 7.645 | -0,10 | 202 | -1,47 | ||||
| 2026-02-12 | 13F | Brinker Capital Investments, LLC | 123.917 | 1,74 | 3.274 | 0,55 | ||||
| 2026-02-09 | 13F | Harbour Investments, Inc. | 75.756 | 141,24 | 2.001 | 138,50 | ||||
| 2026-02-17 | 13F | Susquehanna International Group, Llp | 17.658 | 467 | ||||||
| 2026-02-13 | 13F | Golden State Wealth Management, LLC | 770 | 0,00 | 20 | 0,00 | ||||
| 2025-10-10 | 13F | Focus Financial Network, Inc. | 0 | -100,00 | 0 | |||||
| 2026-02-17 | 13F | Citadel Advisors Llc | 0 | -100,00 | 0 | |||||
| 2026-01-26 | 13F | AE Wealth Management LLC | 15 | -65,12 | 0 | -100,00 | ||||
| 2026-01-26 | 13F | Cwm, Llc | 1.887 | 10,35 | 0 | |||||
| 2026-02-13 | 13F | Morgan Stanley | 2.494 | 1.761,19 | 66 | 2.066,67 | ||||
| 2026-01-13 | 13F | CoreCap Advisors, LLC | 466 | -48,68 | 12 | -50,00 | ||||
| 2026-01-22 | 13F | Bartlett & Co. Wealth Management Llc | 0 | -100,00 | 0 | |||||
| 2026-01-29 | 13F | Concurrent Investment Advisors, LLC | 8.079 | 213 | ||||||
| 2025-11-07 | 13F | Ballast, Inc. | 0 | -100,00 | 0 | -100,00 | ||||
| 2026-01-21 | 13F | Wealthbridge Capital Management, Llc | 18.611 | 5,14 | 492 | 3,81 | ||||
| 2025-10-07 | 13F | Salem Investment Counselors Inc | 0 | -100,00 | 0 | |||||
| 2026-01-12 | 13F | Seacrest Wealth Management, Llc | 30.635 | 813 | ||||||
| 2026-02-06 | 13F | HighTower Advisors, LLC | 16.674 | 441 | ||||||
| 2026-01-20 | 13F | Signaturefd, Llc | 27 | 0,00 | 1 | |||||
| 2026-02-10 | 13F/A | Northwestern Mutual Wealth Management Co | 1.014 | 344,74 | 27 | 333,33 | ||||
| 2026-02-03 | 13F | Coston, McIsaac & Partners | 429 | 0 | ||||||
| 2026-01-26 | 13F | WJ Interests, LLC | 11.215 | 0,00 | 296 | -1,00 | ||||
| 2026-02-02 | 13F | Breakwater Investment Management | 3.503 | 0,00 | 93 | -1,08 | ||||
| 2026-01-28 | 13F | Joseph P. Lucia & Associates, LLC | 24.701 | 29,86 | 653 | 28,35 | ||||
| 2026-01-30 | 13F | Axis Wealth Partners, LLC | 7.662 | 202 | ||||||
| 2026-02-04 | 13F | KLCM Advisors, Inc. | 8.873 | 234 | ||||||
| 2026-02-06 | 13F | Prevail Innovative Wealth Advisors, Llc | 0 | -100,00 | 0 | |||||
| 2026-02-13 | 13F | Fairfield, Bush & Co. | 10.987 | -4,92 | 290 | -5,84 | ||||
| 2025-11-14 | 13F | Mpwm Advisory Solutions, Llc | 0 | 0 | ||||||
| 2026-02-09 | 13F | Texas Capital Bank Wealth Management Services Inc | 37.504 | 991 | ||||||
| 2025-10-16 | 13F | Ronald Blue Trust, Inc. | 0 | -100,00 | 0 | |||||
| 2026-02-06 | 13F | IFP Advisors, Inc | 11.048 | 113,49 | 292 | 110,87 | ||||
| 2026-02-13 | 13F | SRS Capital Advisors, Inc. | 1.490 | 39 | ||||||
| 2026-02-13 | 13F | Aptus Capital Advisors, LLC | 0 | -100,00 | 0 | |||||
| 2026-02-13 | 13F | Wells Fargo & Company/mn | 103 | -84,25 | 3 | -88,24 | ||||
| 2026-01-28 | 13F | Cornerstone Enterprises, Llc | 582.491 | 15.389 | ||||||
| 2025-11-12 | 13F | Transce3nd, LLC | 0 | -100,00 | 0 | |||||
| 2025-11-14 | 13F/A | NorthRock Partners, LLC | 0 | -100,00 | 0 | |||||
| 2026-02-10 | 13F | Principia Wealth Advisory, LLC | 165.725 | 40,20 | 4.378 | 38,59 | ||||
| 2026-02-12 | 13F | Wealthspire Advisors, LLC | 0 | -100,00 | 0 | |||||
| 2026-01-23 | 13F | Assetmark, Inc | 473 | 0,00 | 12 | 0,00 | ||||
| 2026-02-05 | 13F | 1620 Investment Advisors, Inc. | 5.800 | -22,67 | 153 | -23,50 | ||||
| 2026-01-26 | 13F | Sightline Wealth Advisors, LLC | 15.685 | -8,26 | 414 | -9,41 | ||||
| 2026-02-17 | 13F | Strategic Financial Planning, Inc. | 237.534 | 3,86 | 6.276 | 2,65 | ||||
| 2026-02-17 | 13F | Bank Of America Corp /de/ | 62.283 | 6,33 | 1.646 | 5,11 | ||||
| 2026-01-21 | 13F | SJS Investment Consulting Inc. | 303 | 8 | ||||||
| 2026-02-13 | 13F | Kestra Advisory Services, LLC | 1.231 | 33 |